In today’s data-driven world, the success of any program, be it a business initiative, software application or development project, largely depends on its performance metrics. Boasting of excellent outcomes without concrete evidence to support it is no longer enough; stakeholders and decision-makers demand measurable, tangible results.
This is where program performance metrics come into play. In this blog post, we delve into the significance of these performance indicators, breaking down their various components, functions, and best practices. This comprehensive guide will help you understand how to leverage and analyze key metrics to optimize performance, streamline operations and ultimately, ensure the success of your program. So, let’s embark on this journey towards better understanding and mastery of program performance metrics.
Program Performance Metrics You Should Know
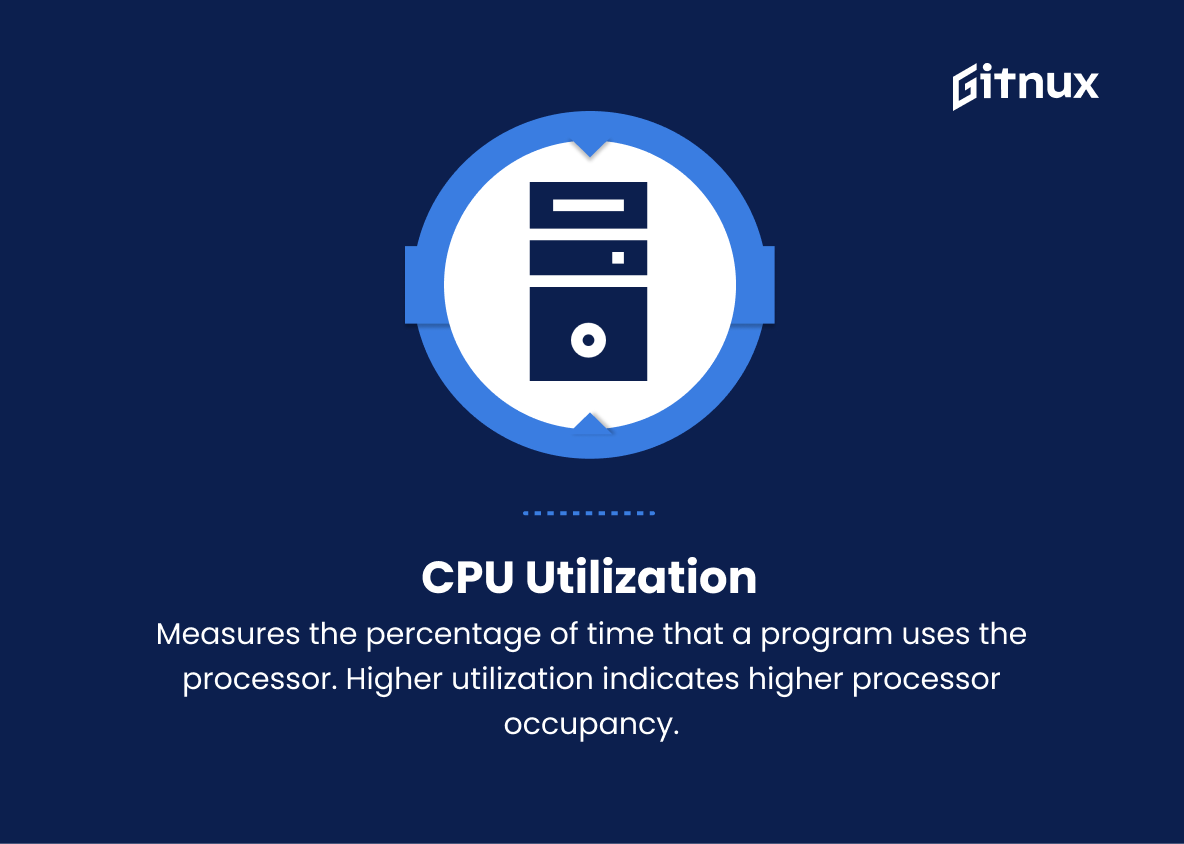
1. CPU utilization
Measures the percentage of time that a program uses the processor. Higher utilization indicates higher processor occupancy.
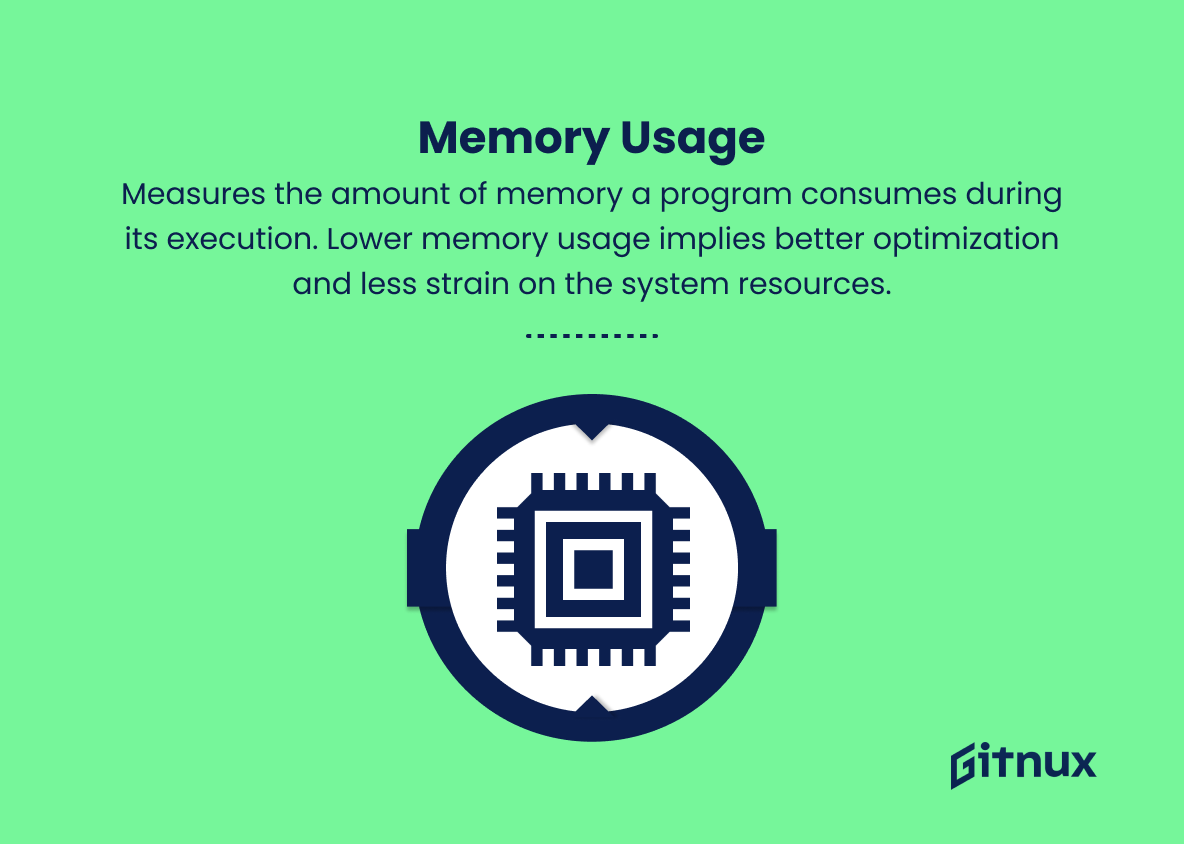
2. Memory usage
Measures the amount of memory a program consumes during its execution. Lower memory usage implies better optimization and less strain on the system resources.
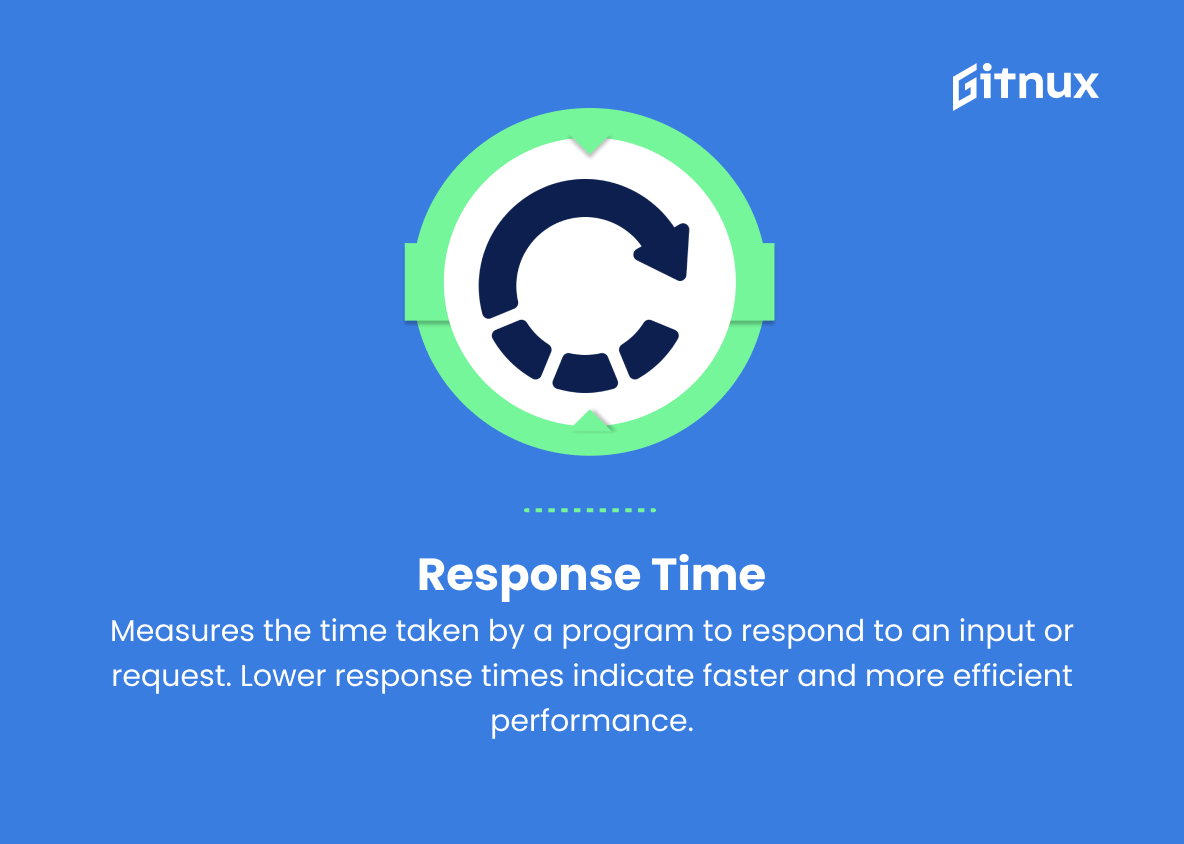
3. Response time
Measures the time taken by a program to respond to an input or request. Lower response times indicate faster and more efficient performance.
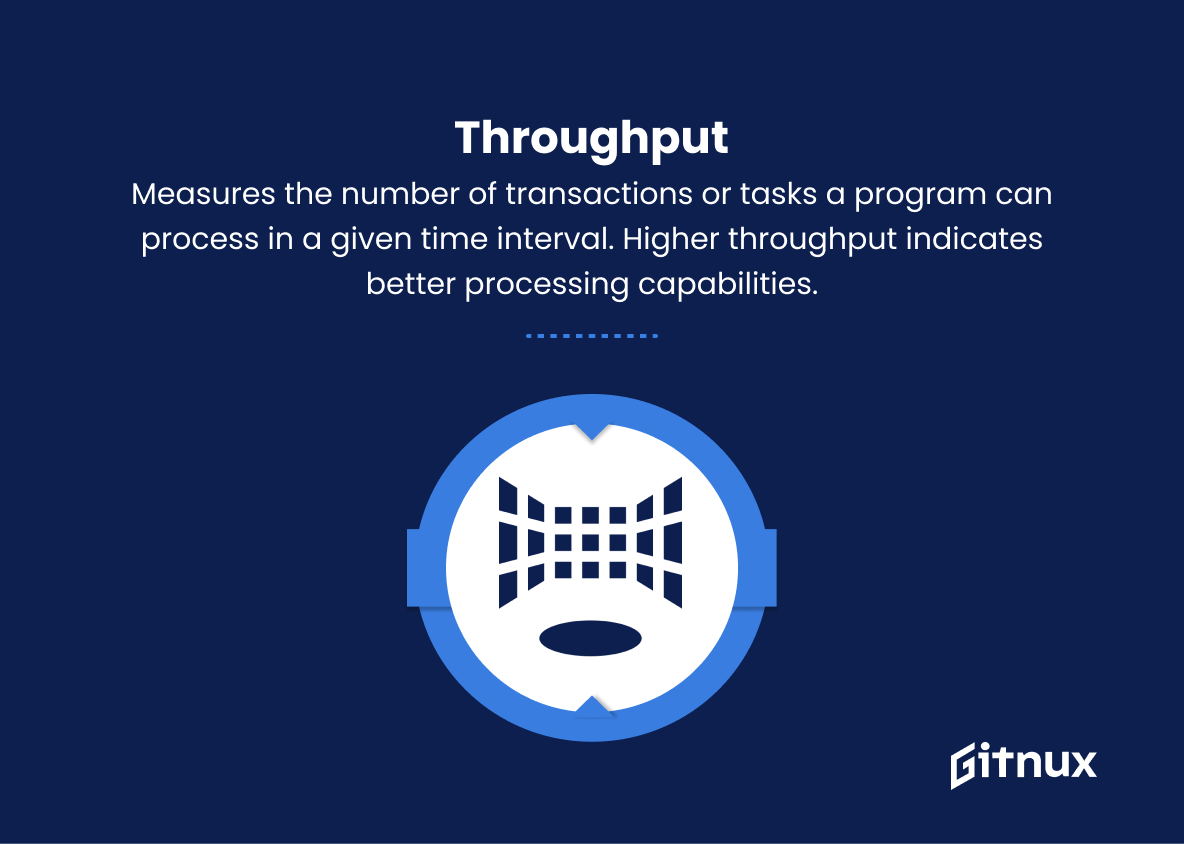
4. Throughput
Measures the number of transactions or tasks a program can process in a given time interval. Higher throughput indicates better processing capabilities.
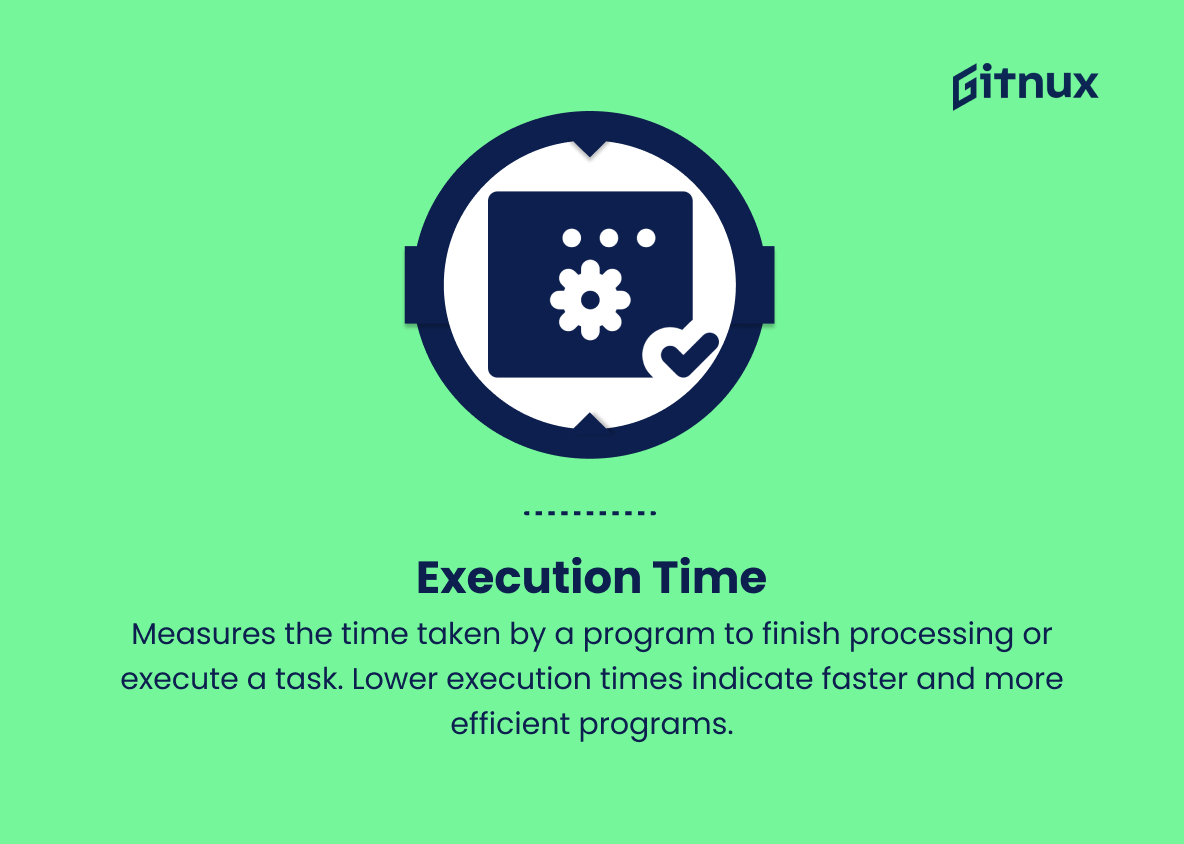
5. Execution time
Measures the time taken by a program to finish processing or execute a task. Lower execution times indicate faster and more efficient programs.
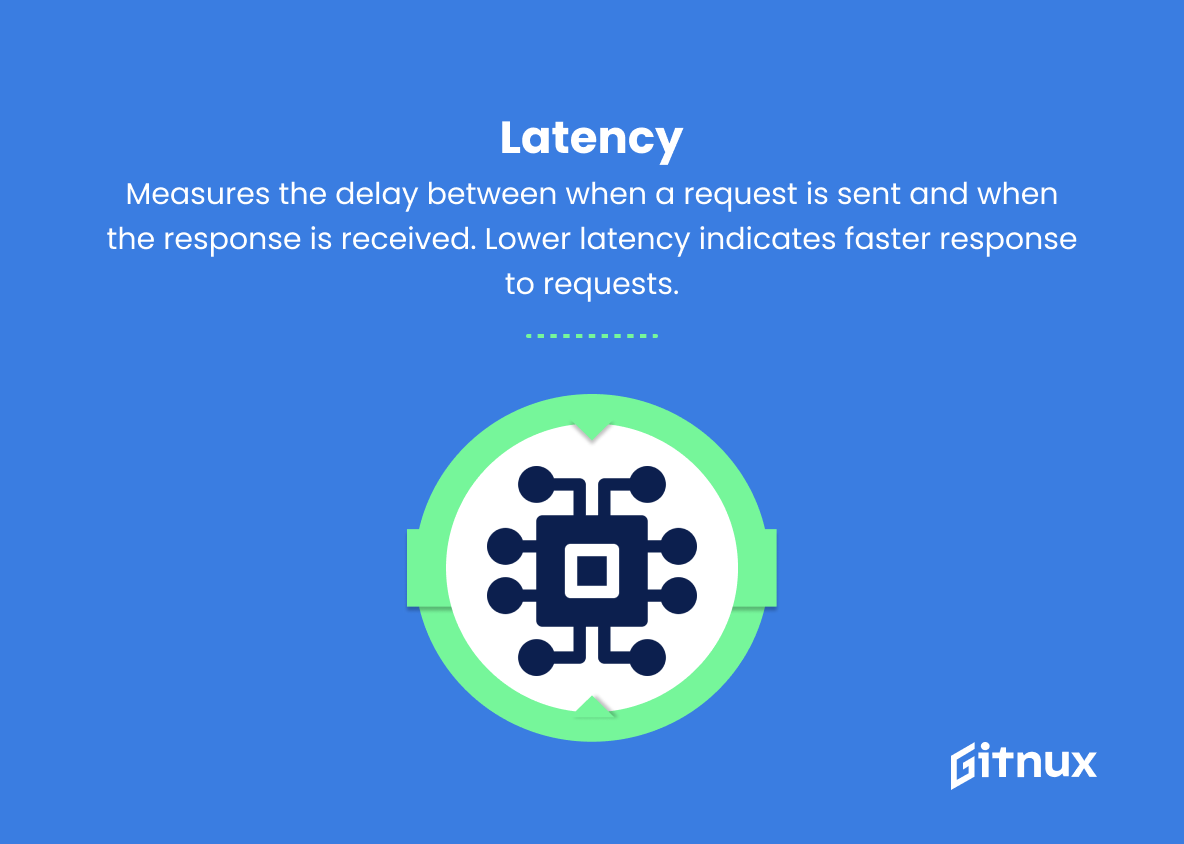
6. Latency
Measures the delay between when a request is sent and when the response is received. Lower latency indicates faster response to requests.
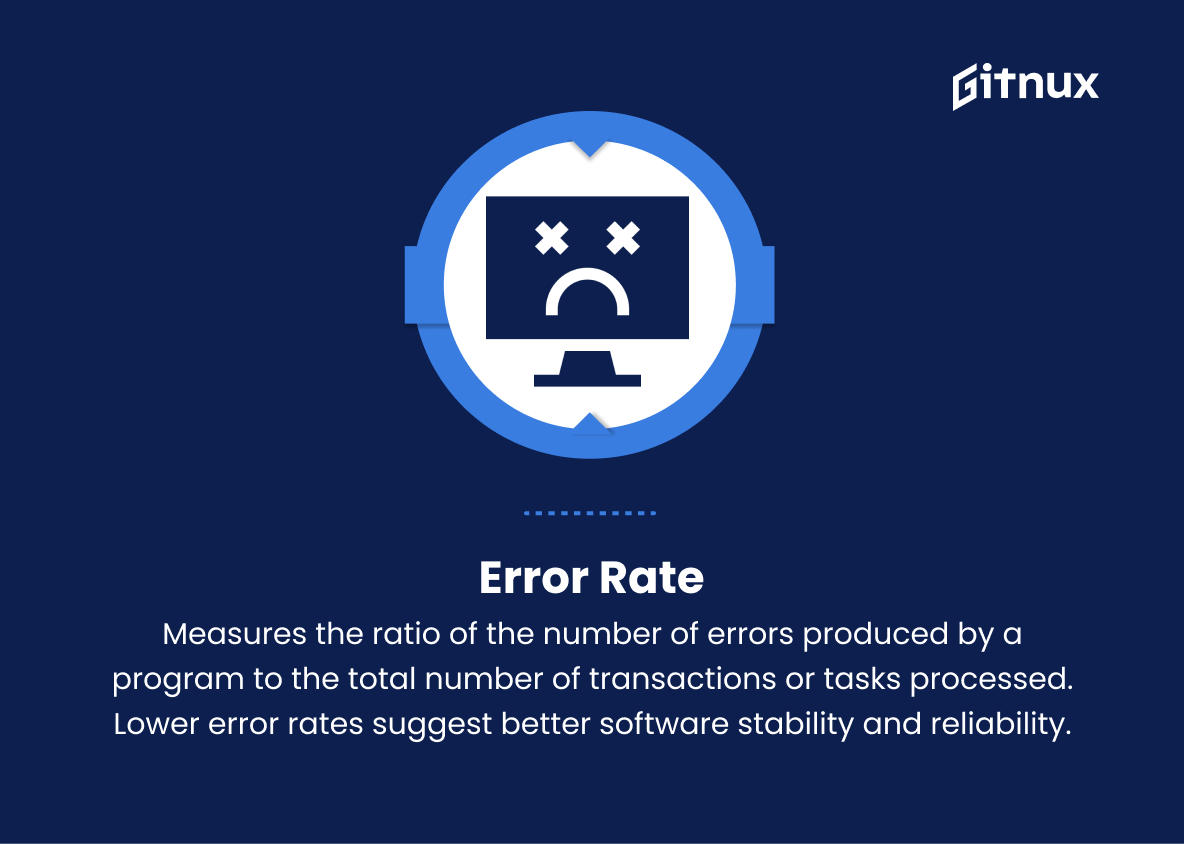
7. Error rate
Measures the ratio of the number of errors produced by a program to the total number of transactions or tasks processed. Lower error rates suggest better software stability and reliability.
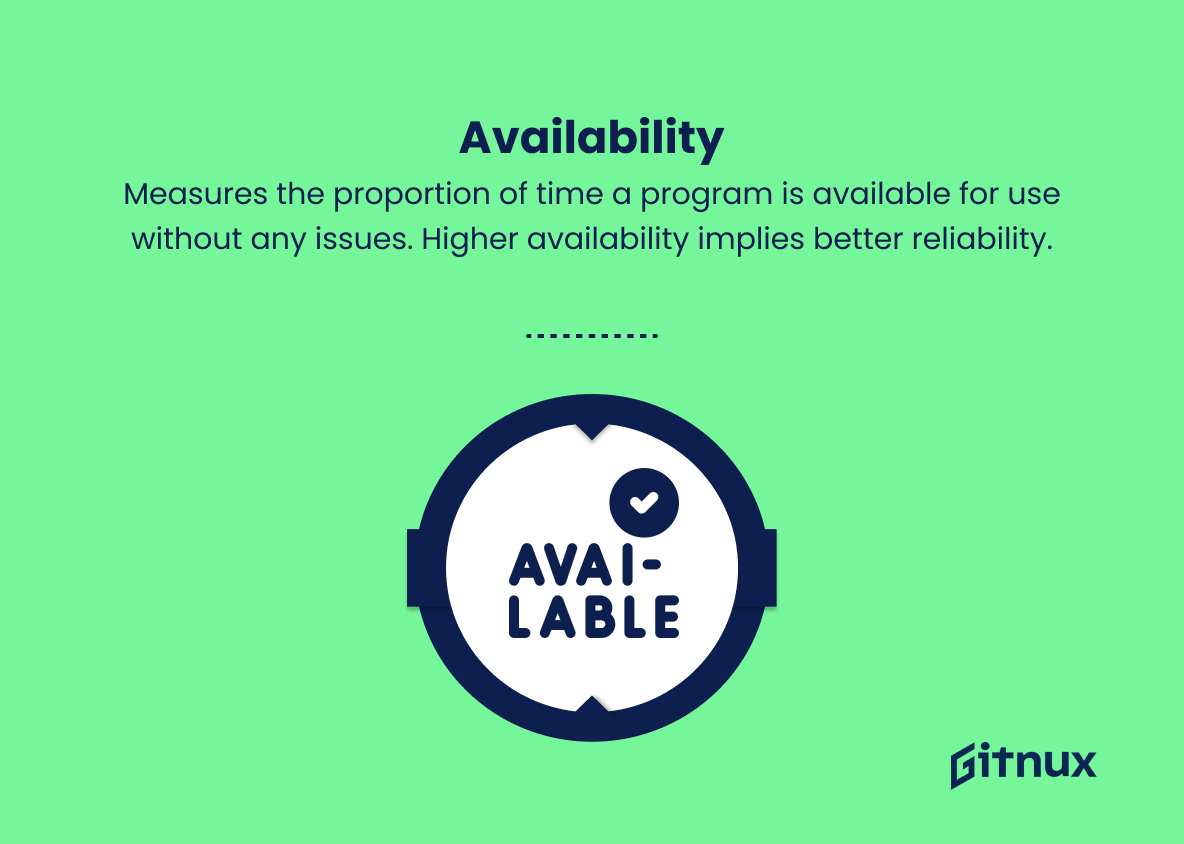
8. Availability
Measures the proportion of time a program is available for use without any issues. Higher availability implies better reliability.
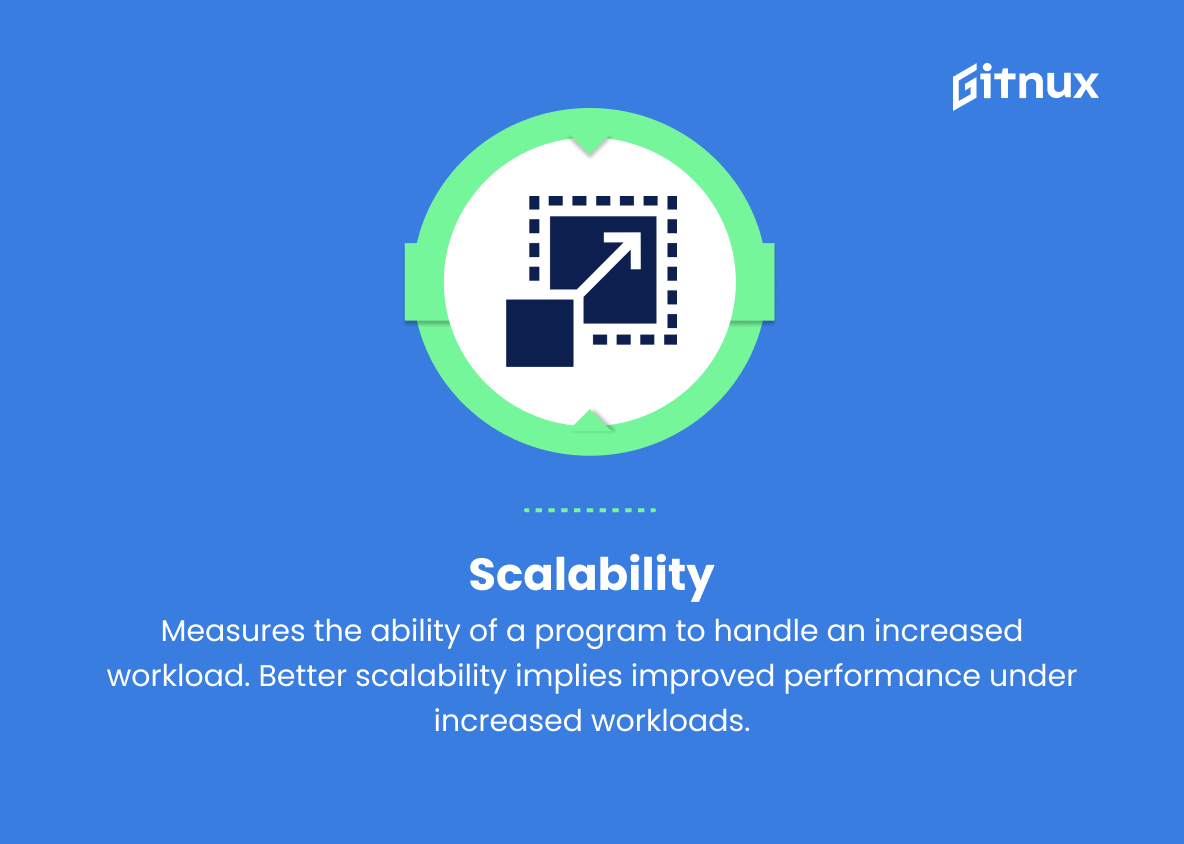
9. Scalability
Measures the ability of a program to handle an increased workload. Better scalability implies improved performance under increased workloads.
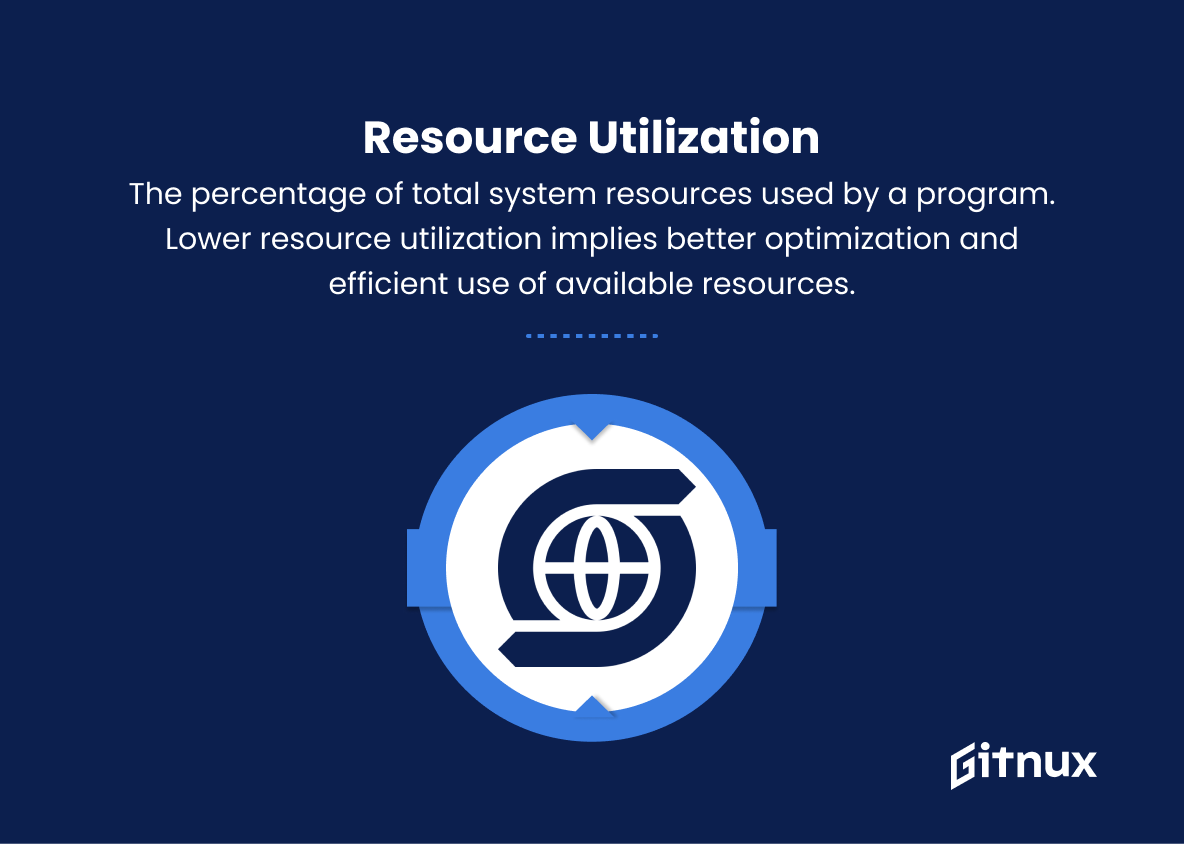
10. Resource utilization
The percentage of total system resources used by a program. Lower resource utilization implies better optimization and efficient use of available resources.
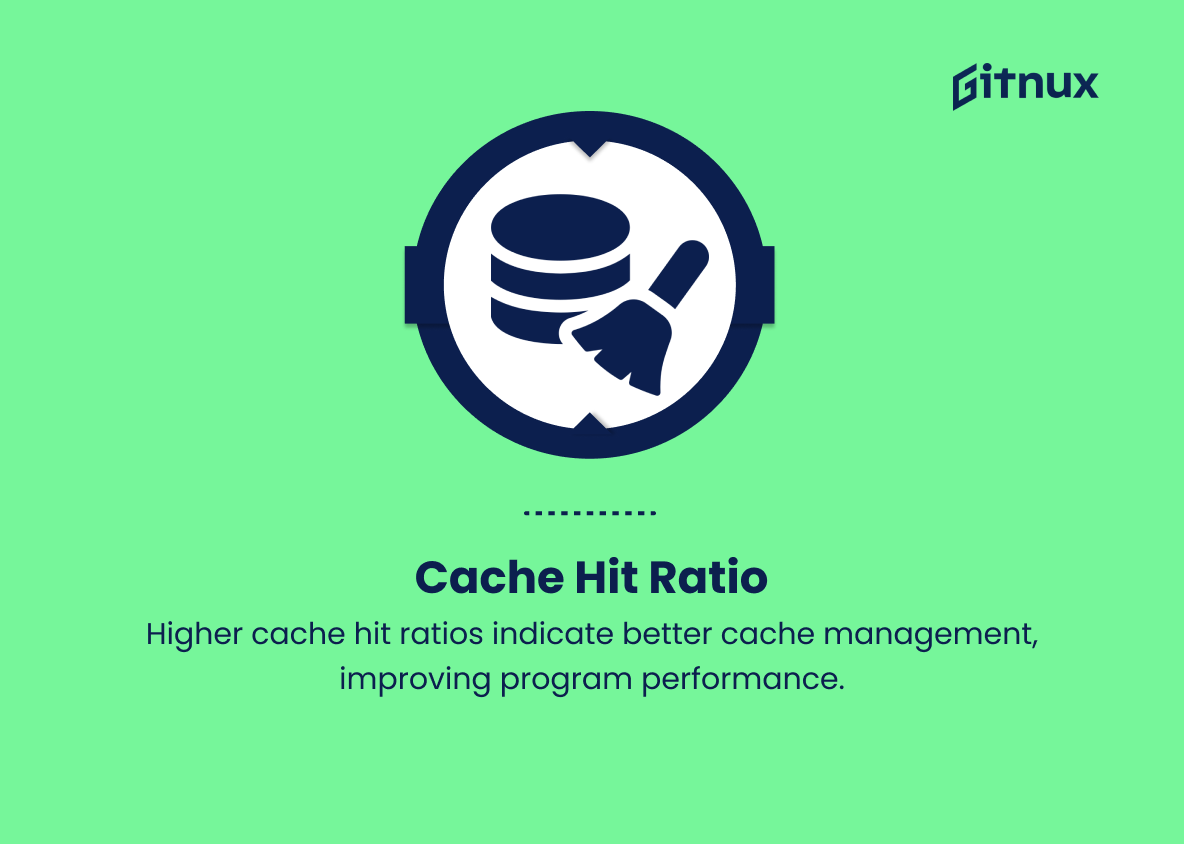
11. Cache hit ratio
The ratio of cache requests that result in a cache hit (data is found in the cache) to the total number of cache requests. Higher cache hit ratios indicate better cache management, improving program performance.
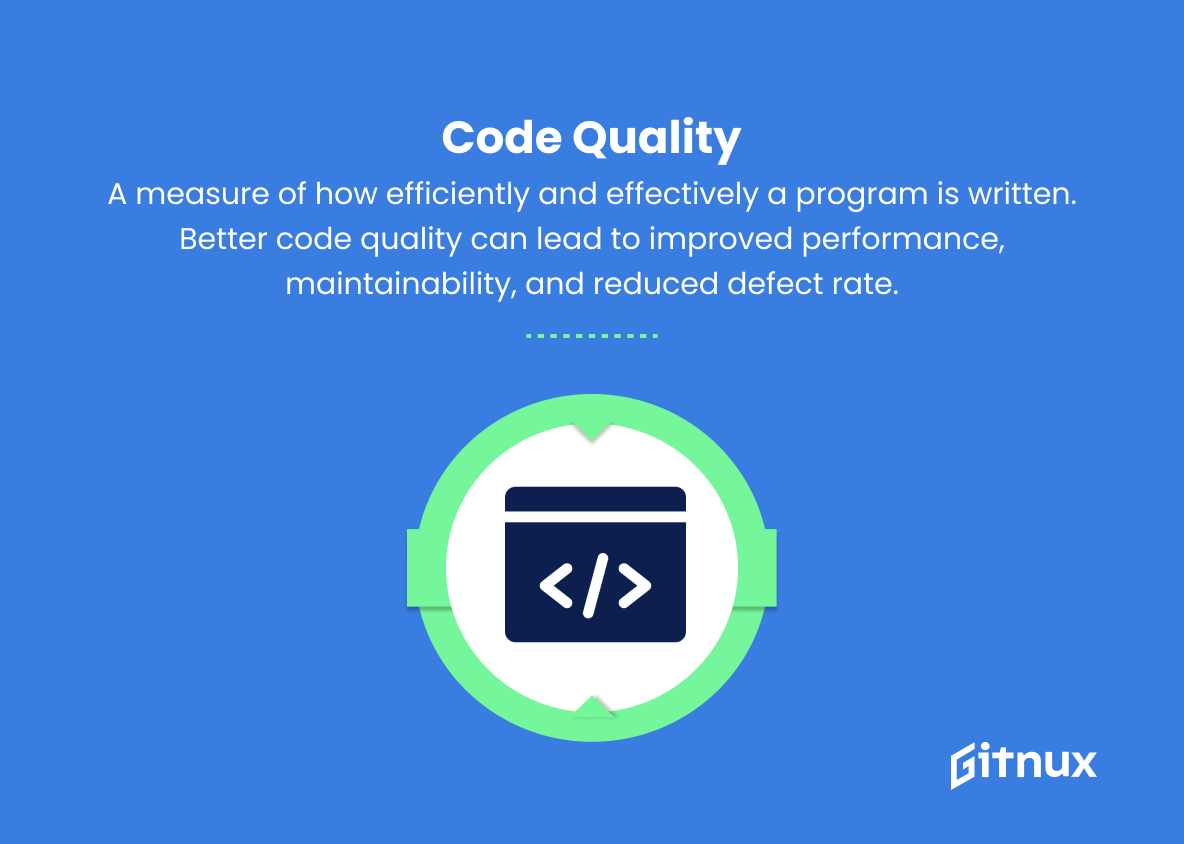
12. Code quality
A measure of how efficiently and effectively a program is written. Better code quality can lead to improved performance, maintainability, and reduced defect rate.
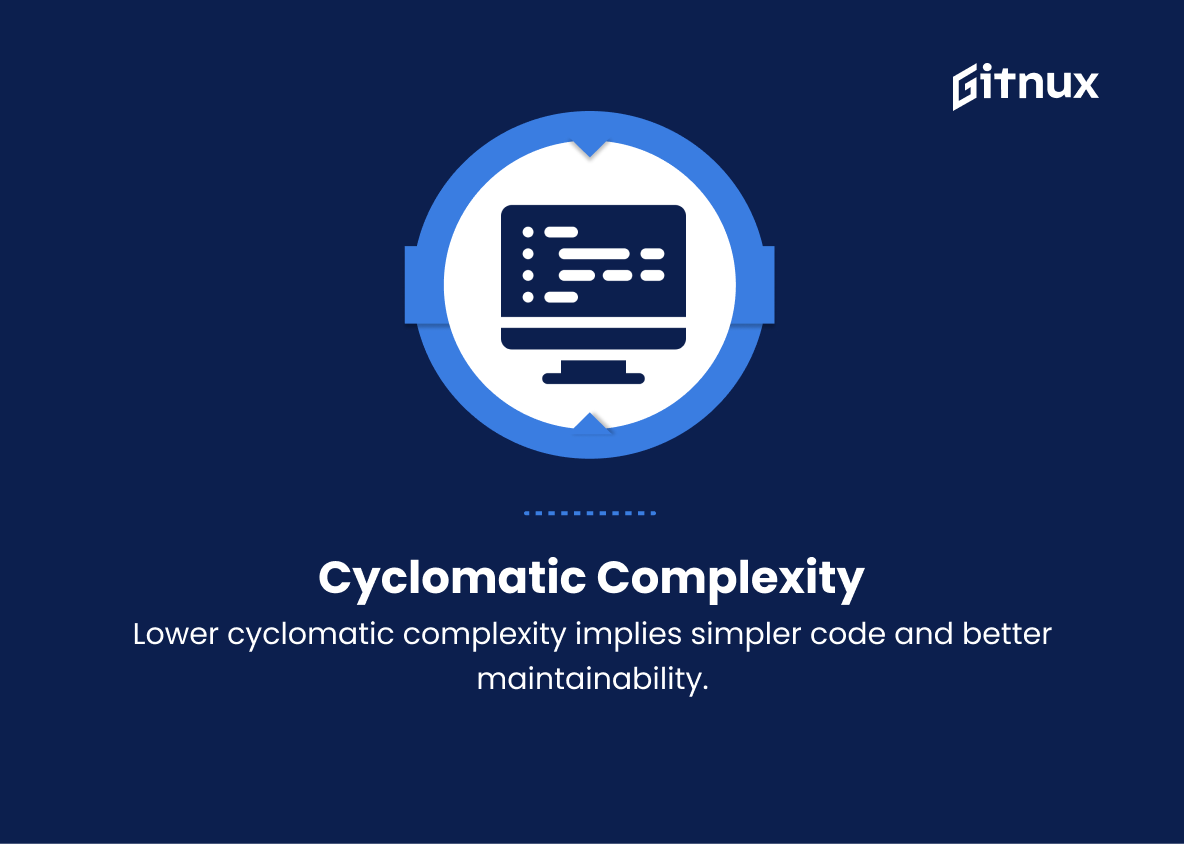
13. Cyclomatic complexity
A measure of the complexity of a program’s code, indicating its potential difficulty in understanding and maintaining. Lower cyclomatic complexity implies simpler code and better maintainability.
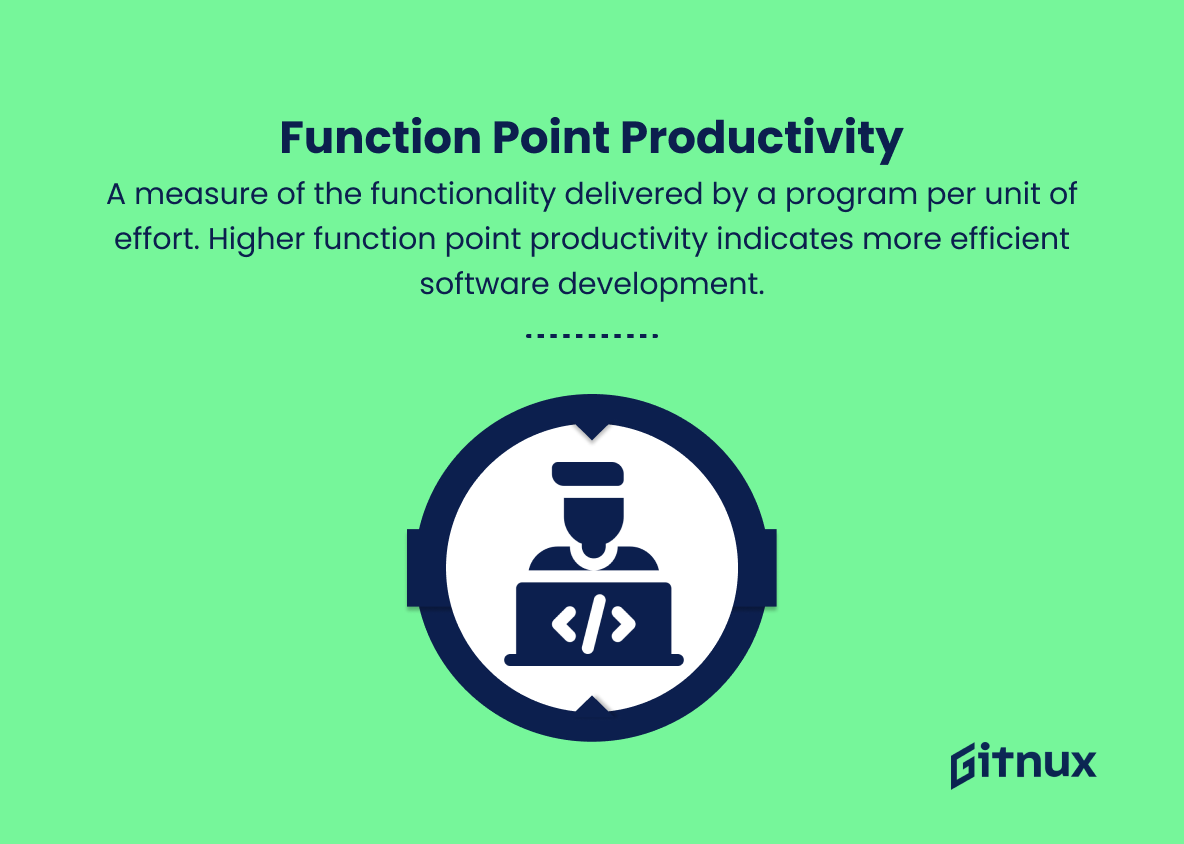
14. Function point productivity
A measure of the functionality delivered by a program per unit of effort. Higher function point productivity indicates more efficient software development.
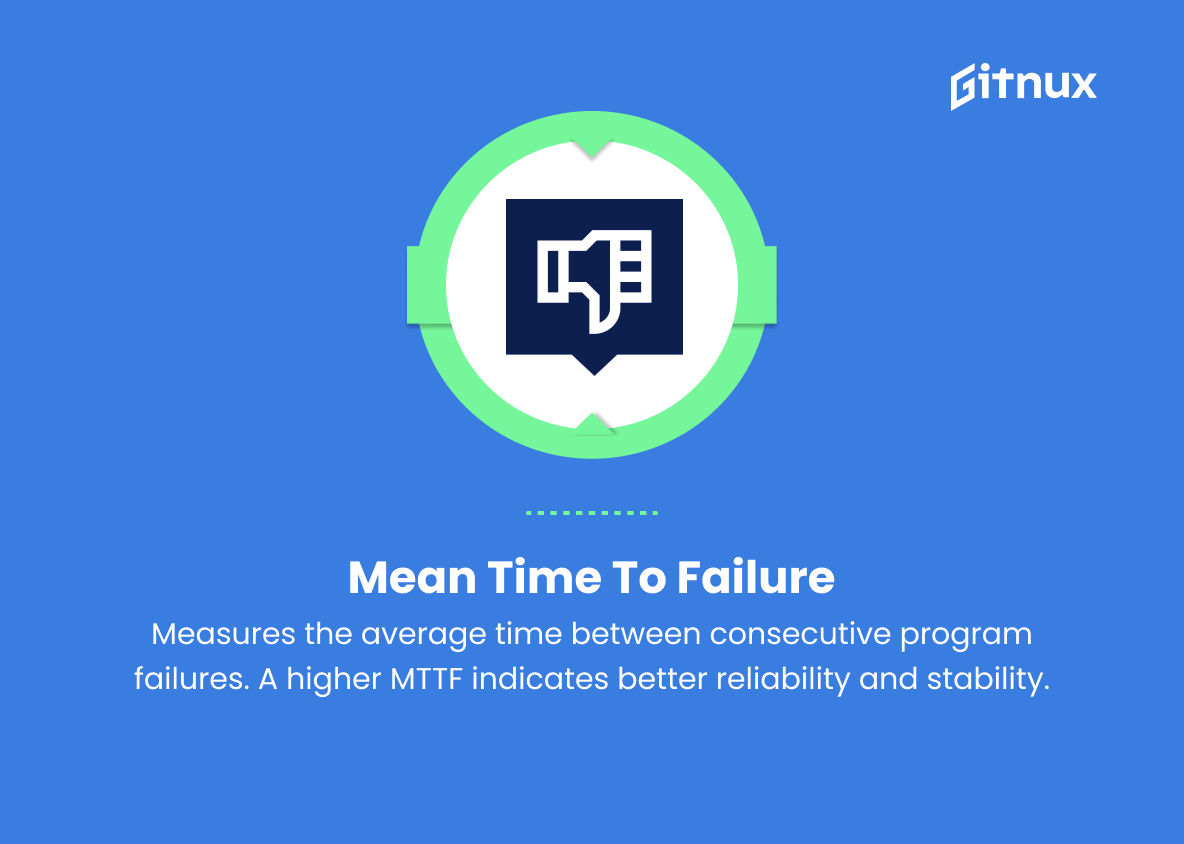
15. Mean time to failure (MTTF)
Measures the average time between consecutive program failures. A higher MTTF indicates better reliability and stability.
16. Mean time to recover (MTTR)
Measures the average time it takes to recover from a program failure. Lower MTTR values indicate a more robust and quickly recoverable system.
Program Performance Metrics Explained
Program performance metrics play a crucial role in evaluating and improving the efficiency and effectiveness of a software application. Metrics such as CPU utilization, memory usage, and resource utilization help to assess the optimization and strain imposed on system resources. Response time, throughput, execution time, and latency are crucial indicators of the speed and overall performance of the program.
Error rate, availability, and reliability metrics such as MTTF and MTTR provide insights into the software’s stability and robustness. Scalability is essential for evaluating a program’s adaptability to handle increased workloads. Additionally, cache hit ratio, code quality, cyclomatic complexity, and function point productivity contribute to assessing cache management, maintainability, and software development efficiency. Collectively, these performance metrics enable developers to optimize their programs, enhance user experiences, and reduce system strain.
Conclusion
In closing, monitoring and analyzing program performance metrics is an essential aspect of successful project management, allowing organizations to make data-driven decisions and continuously improve their processes. By adopting a comprehensive approach that encompasses various key performance indicators, companies can identify strengths and weaknesses, optimize resource allocation, and fine-tune their strategies in real-time. A thorough understanding of the array of metrics available — from efficiency and effectiveness to quality and customer satisfaction — equips businesses with the tools to not only meet but exceed their objectives.
By investing in performance measurement and its continuous application, organizations can foster a culture of continuous improvement, maximizing their potential within an ever-evolving competitive landscape.
