In today’s highly competitive and rapidly evolving business landscape, measuring and tracking product success has become an absolute necessity for organizations. With a myriad of metrics available, it can be a complex and overwhelming task for product managers and executives to decipher what resonates best with their product’s unique value proposition.
In this insightful blog post, we will explore and demystify the most relevant and actionable product success metrics, helping you to truly understand the impact of your product, optimize user experiences, and ultimately, drive your product towards unparalleled growth and success. So, let’s dive into the world of product success metrics and discover the right tools and insights you need to make data-driven decisions, ensuring your product not only survives, but thrives in the ever-changing market ecosystem.
Product Success Metrics You Should Know
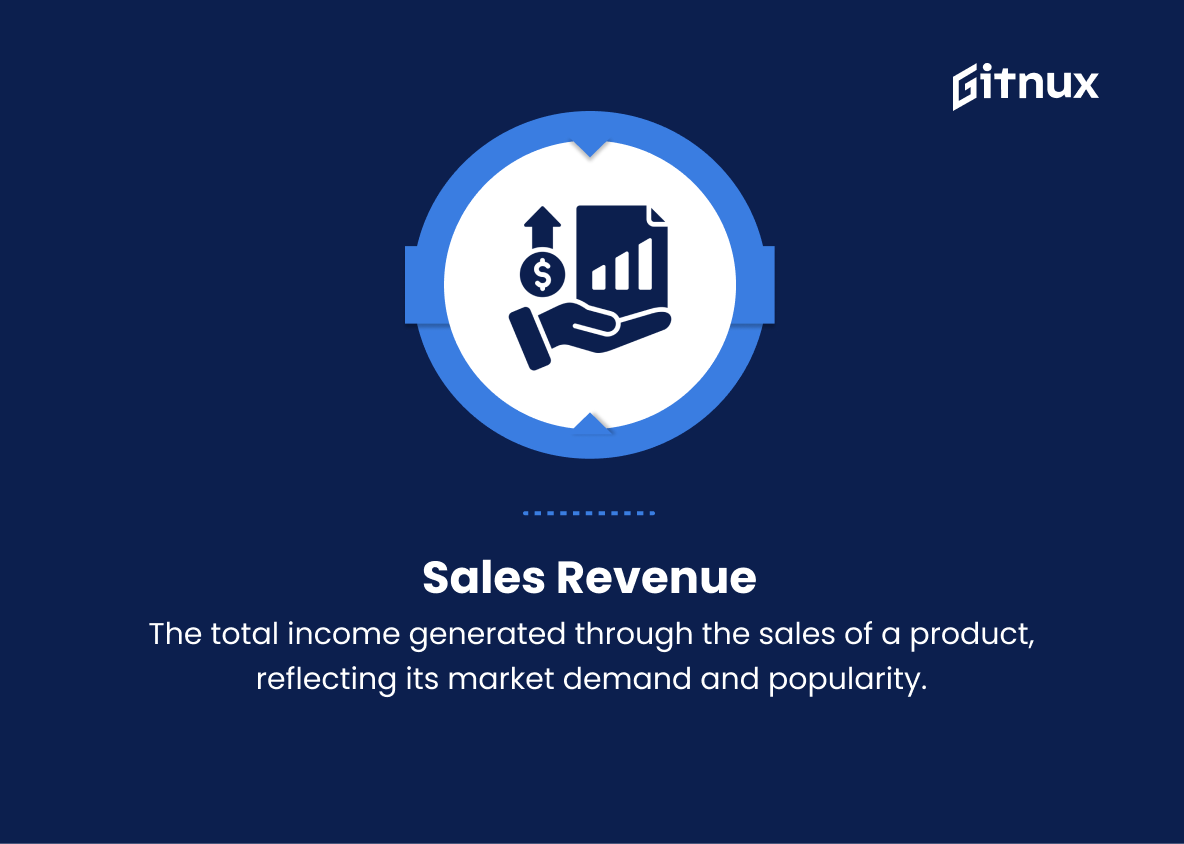
1. Sales revenue
The total income generated through the sales of a product, reflecting its market demand and popularity.
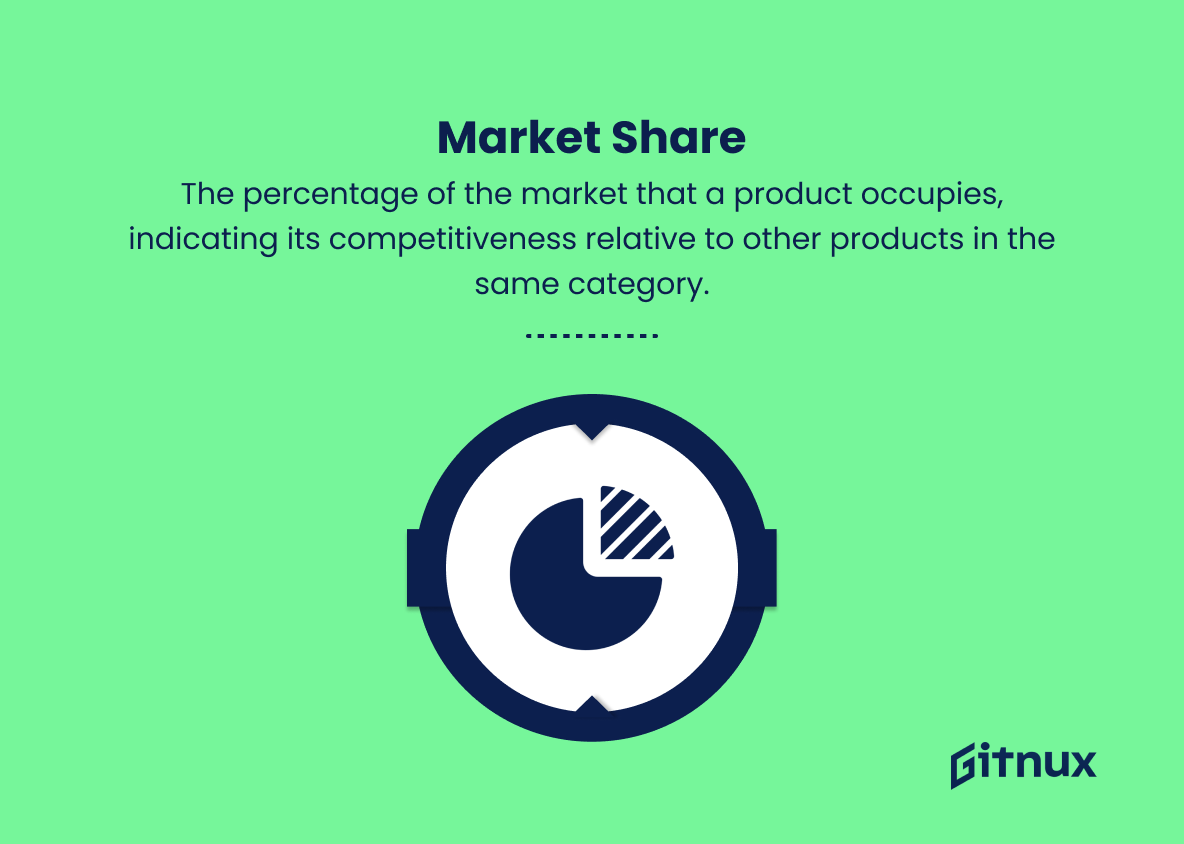
2. Market share
The percentage of the market that a product occupies, indicating its competitiveness relative to other products in the same category.
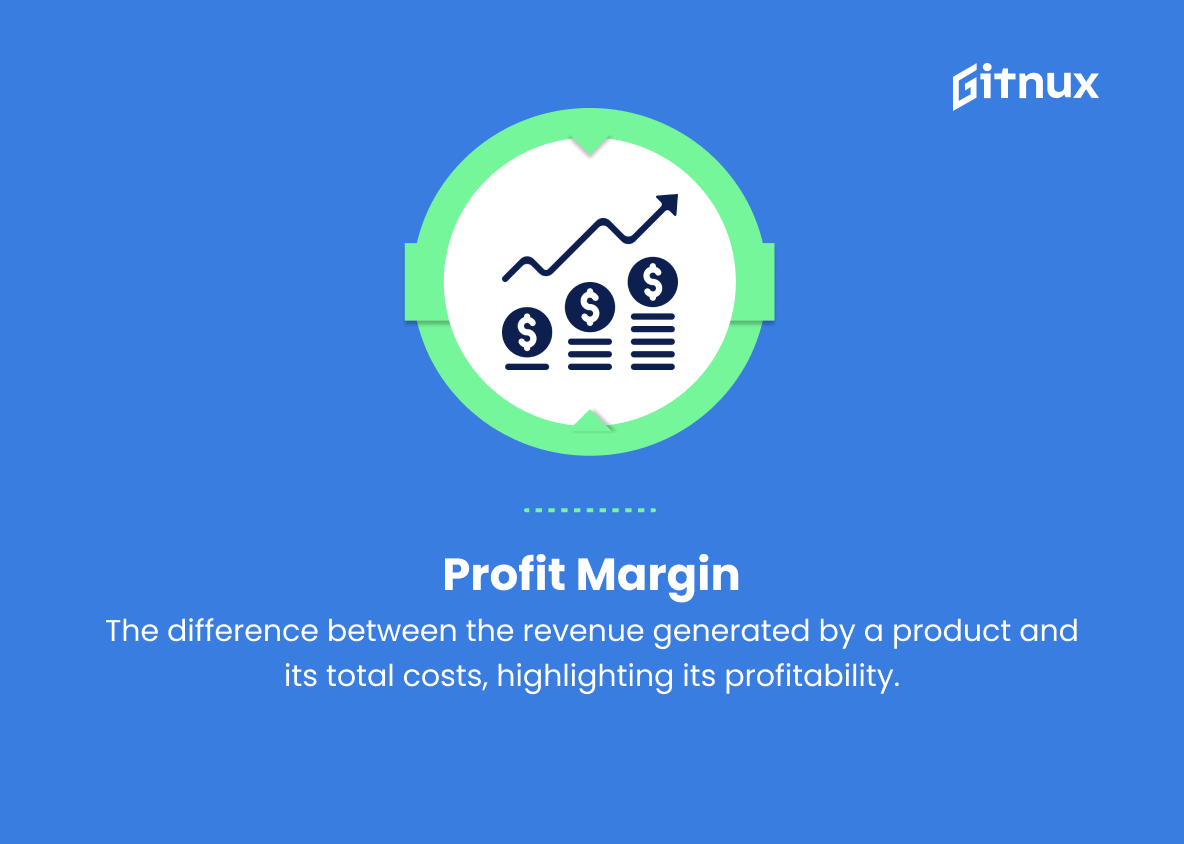
3. Profit margin
The difference between the revenue generated by a product and its total costs, highlighting its profitability.
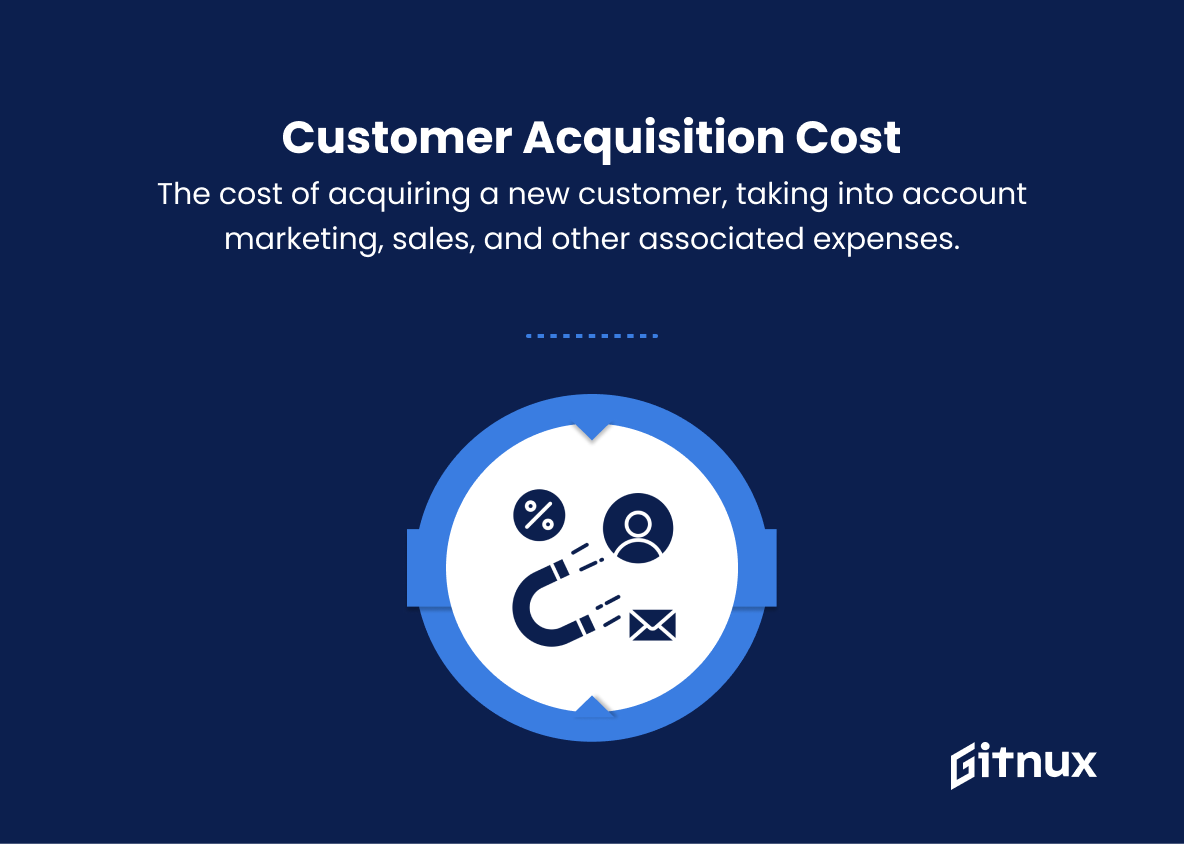
4. Customer acquisition cost (CAC)
The cost of acquiring a new customer, taking into account marketing, sales, and other associated expenses.
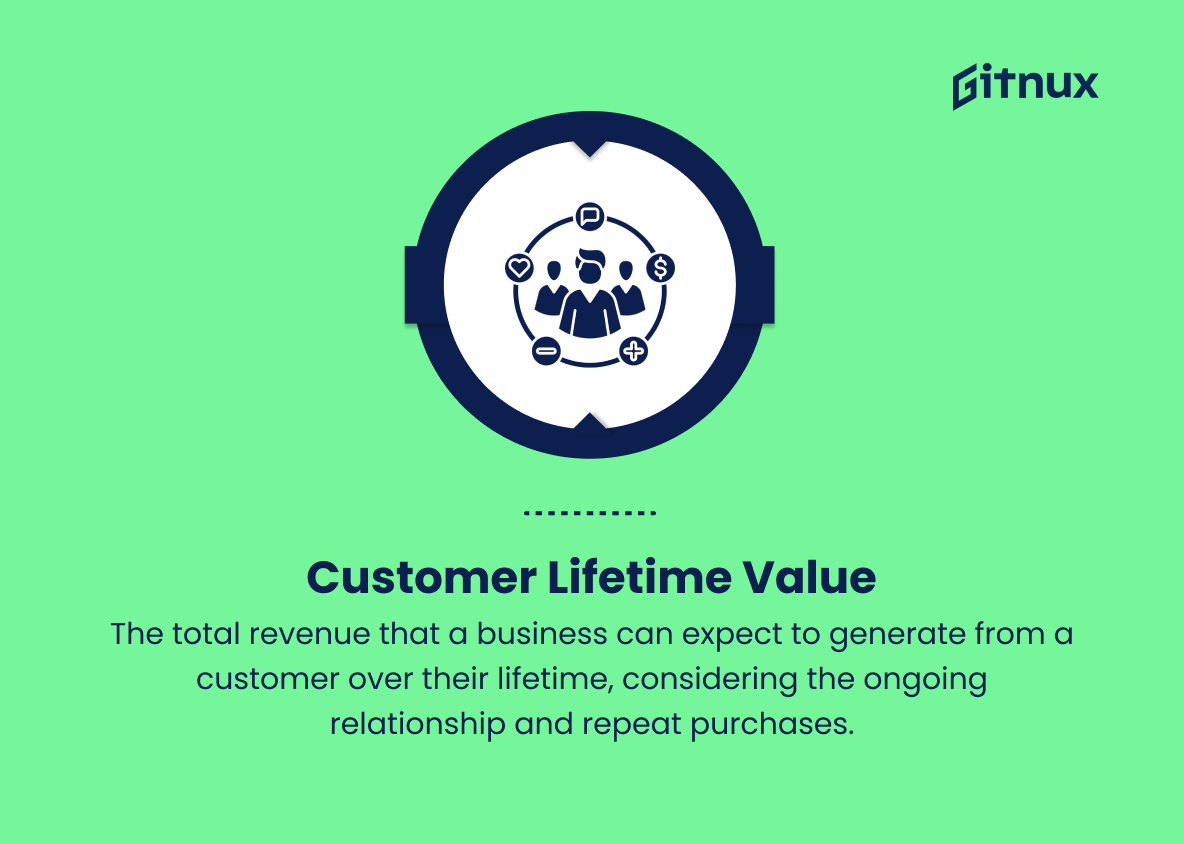
5. Customer lifetime value (CLTV)
The total revenue that a business can expect to generate from a customer over their lifetime, considering the ongoing relationship and repeat purchases.
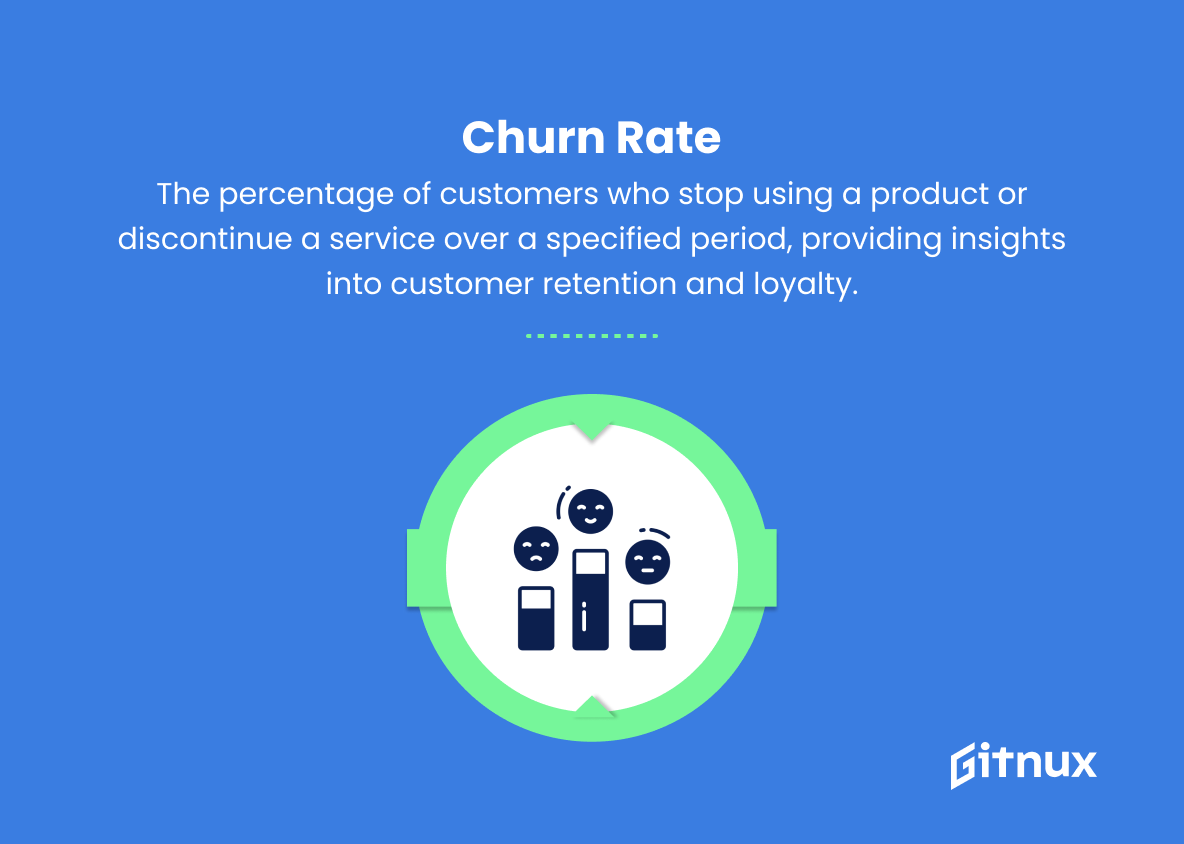
6. Churn rate
The percentage of customers who stop using a product or discontinue a service over a specified period, providing insights into customer retention and loyalty.
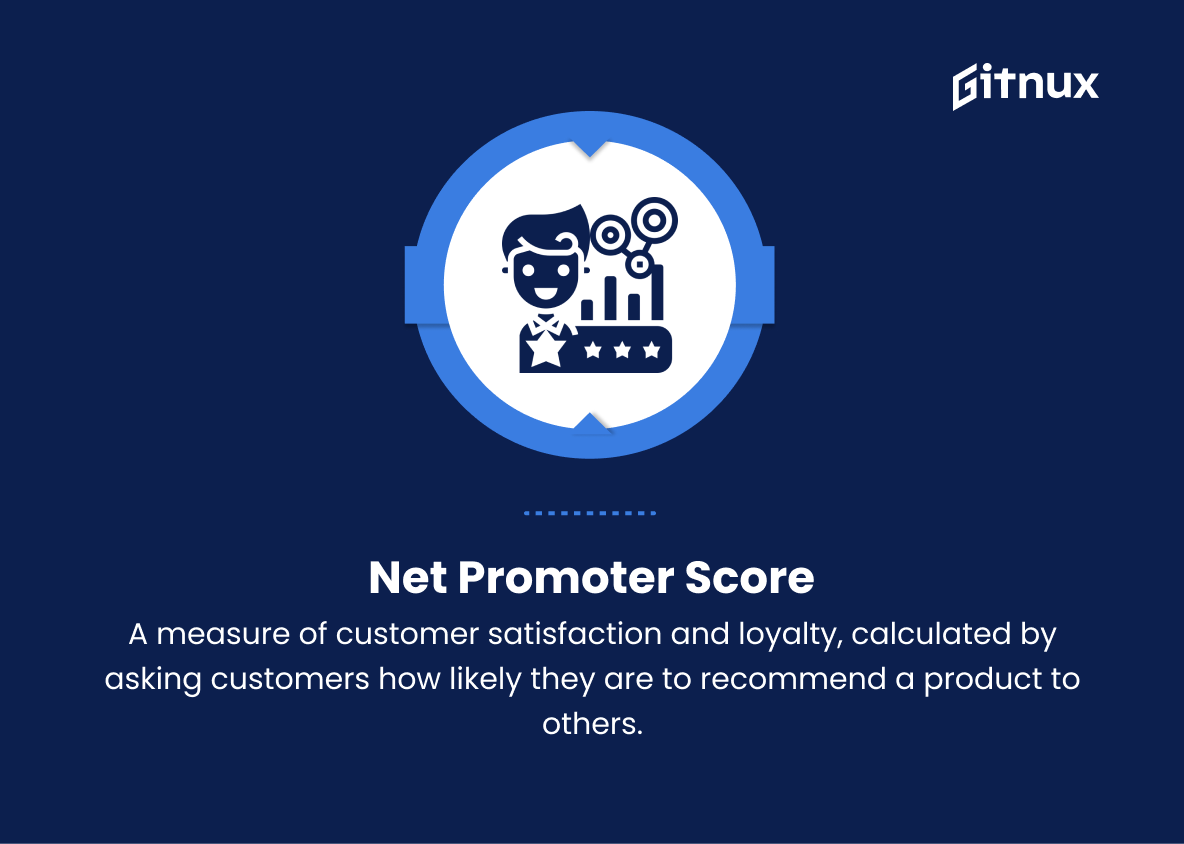
7. Net promoter score (NPS)
A measure of customer satisfaction and loyalty, calculated by asking customers how likely they are to recommend a product to others.
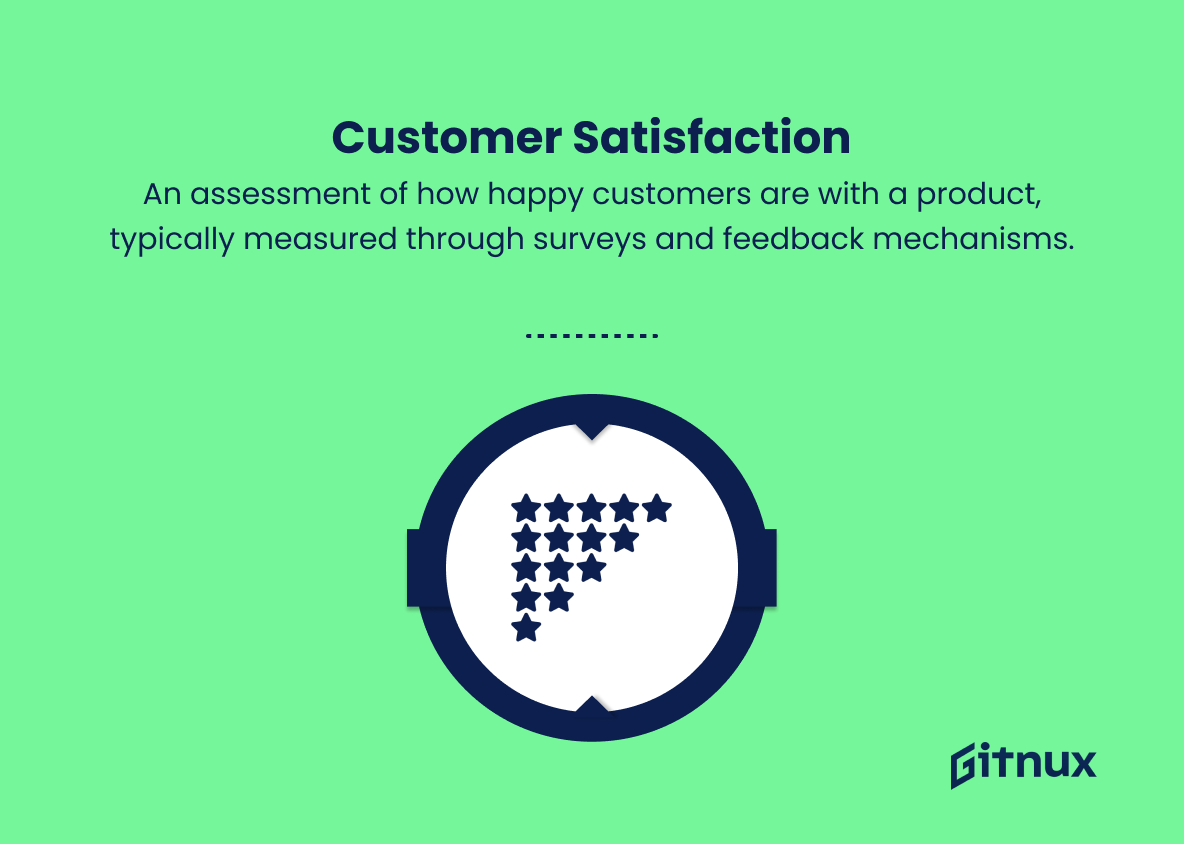
8. Customer satisfaction (CSAT)
An assessment of how happy customers are with a product, typically measured through surveys and feedback mechanisms.
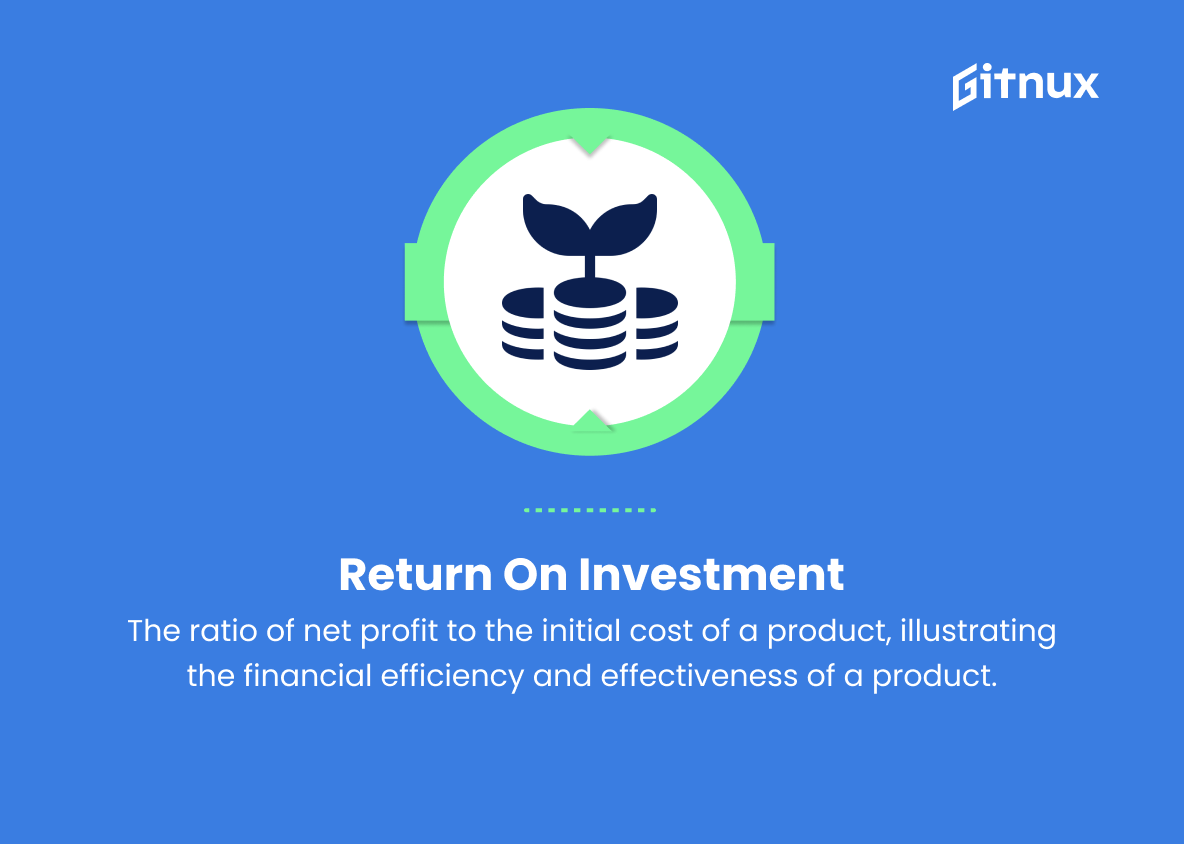
9. Return on investment (ROI)
The ratio of net profit to the initial cost of a product, illustrating the financial efficiency and effectiveness of a product.
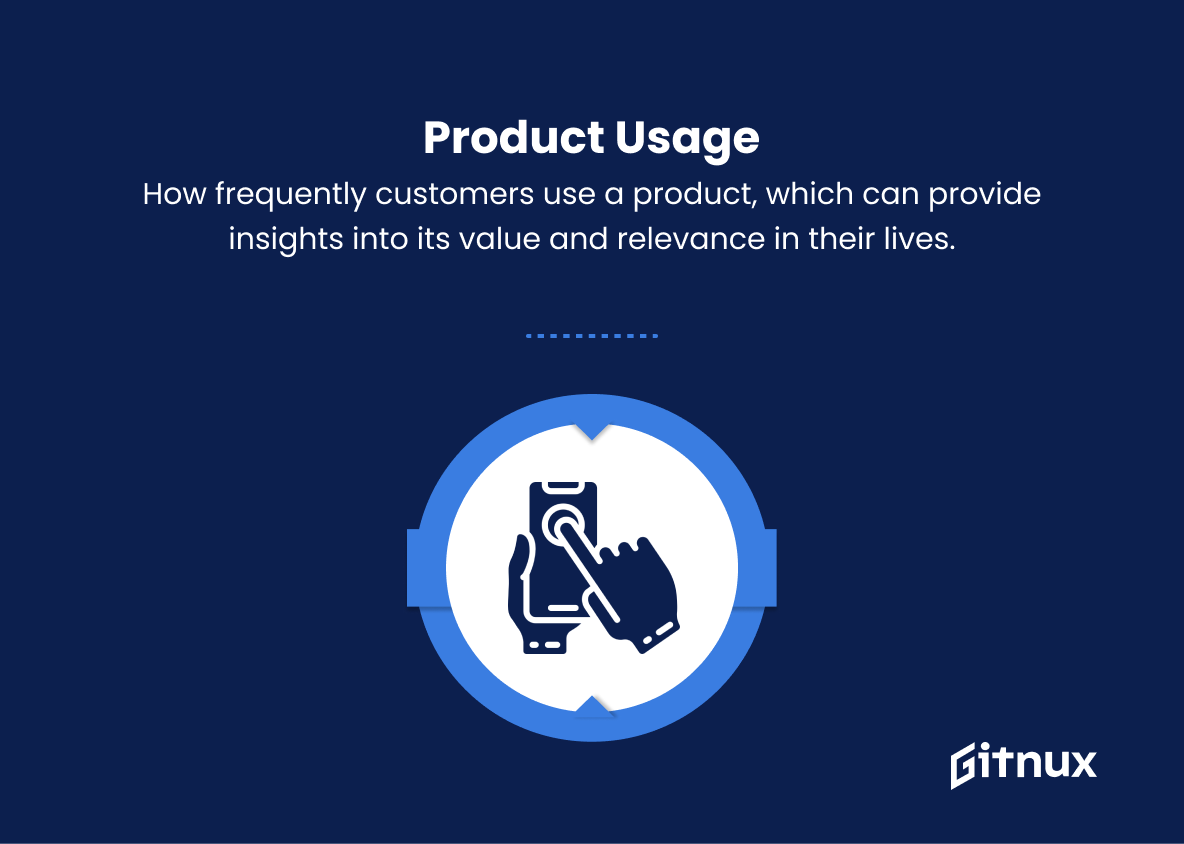
10. Product usage
How frequently customers use a product, which can provide insights into its value and relevance in their lives.
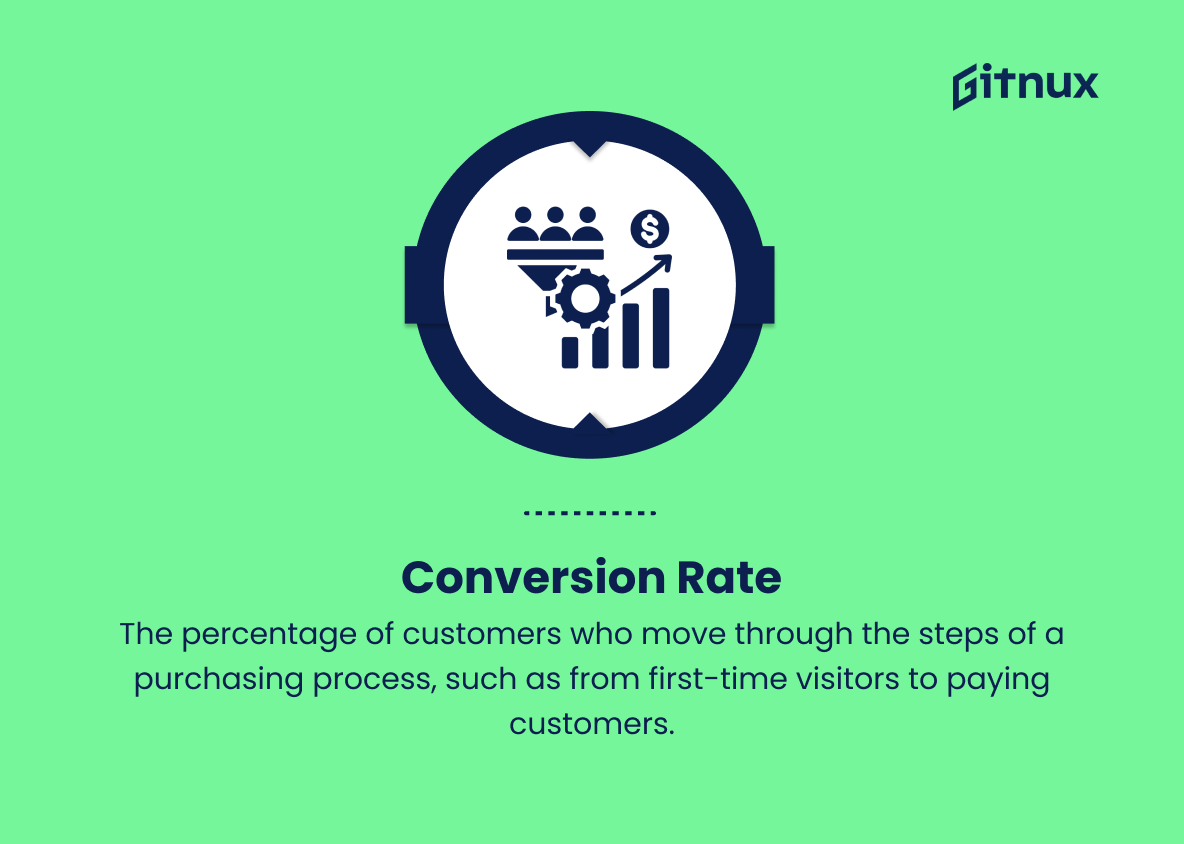
11. Conversion rate
The percentage of customers who move through the steps of a purchasing process, such as from first-time visitors to paying customers.
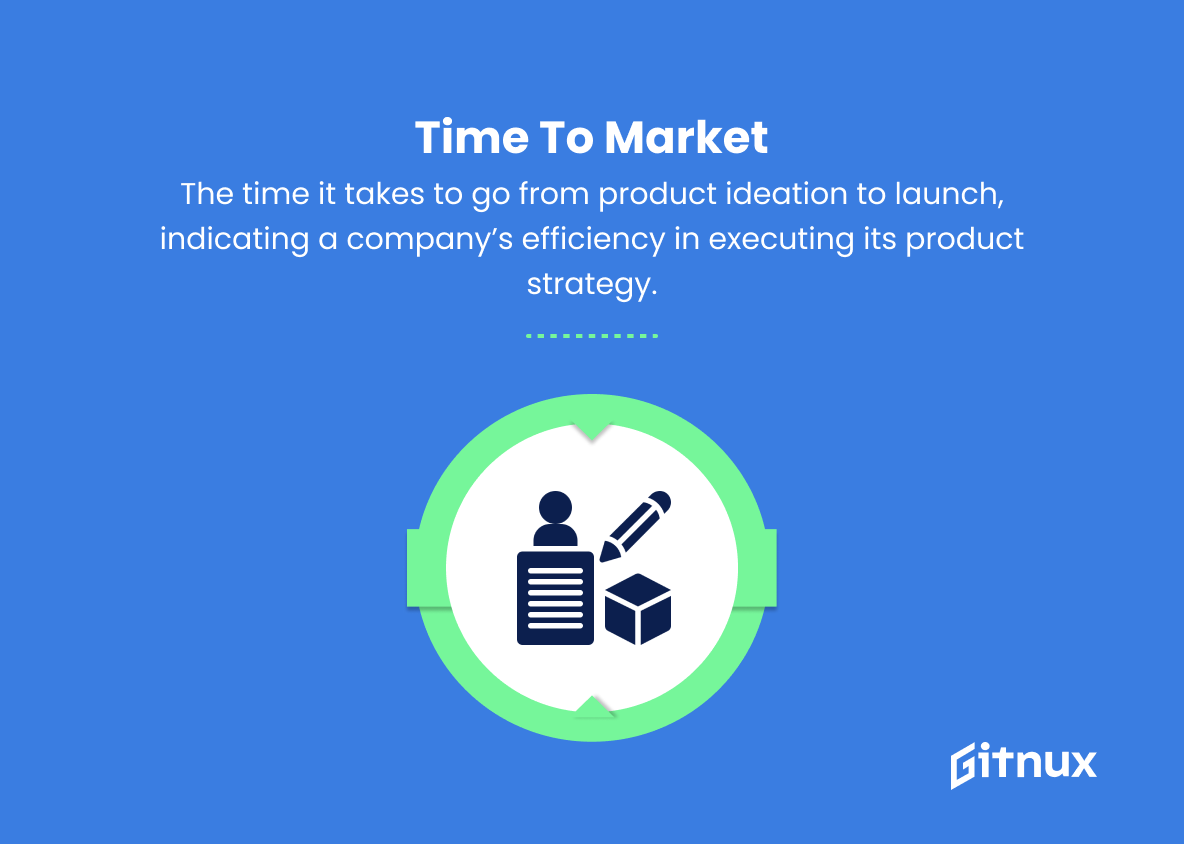
12. Time to market
The time it takes to go from product ideation to launch, indicating a company’s efficiency in executing its product strategy.
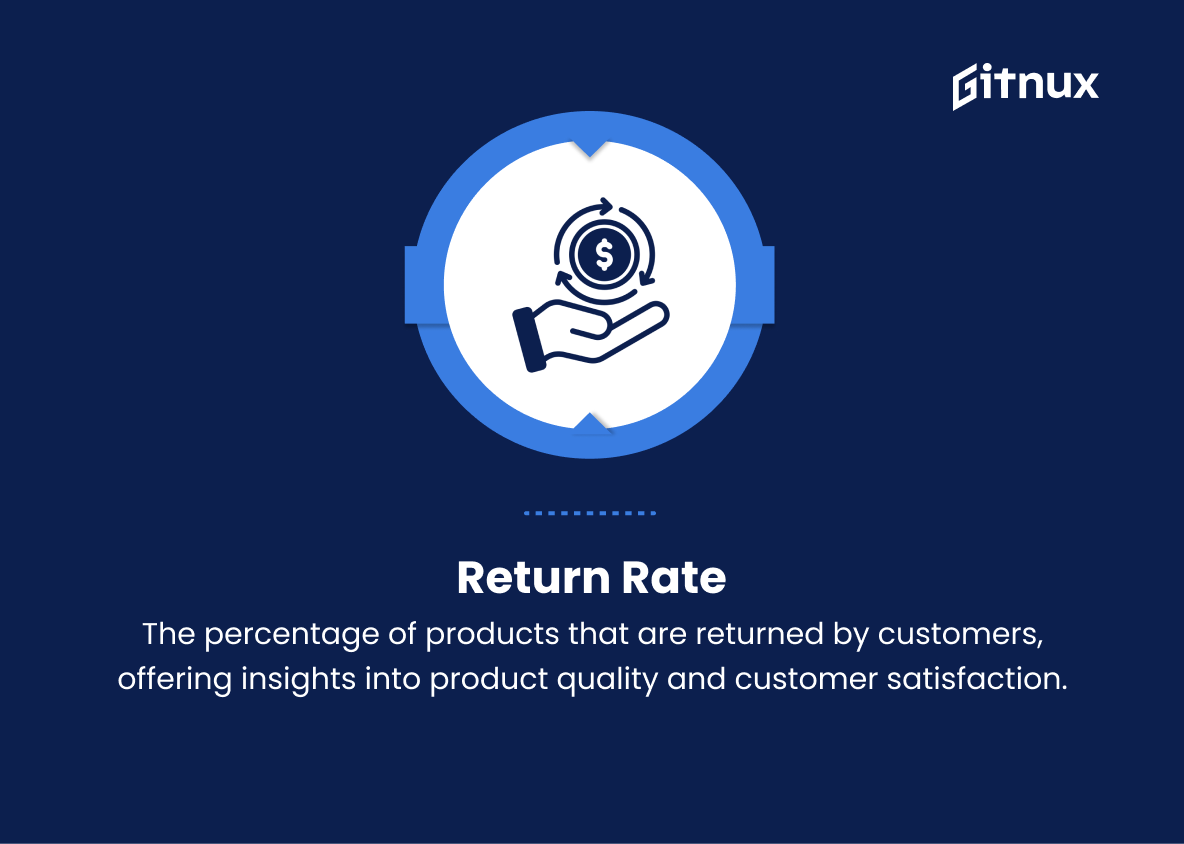
13. Return rate
The percentage of products that are returned by customers, offering insights into product quality and customer satisfaction.
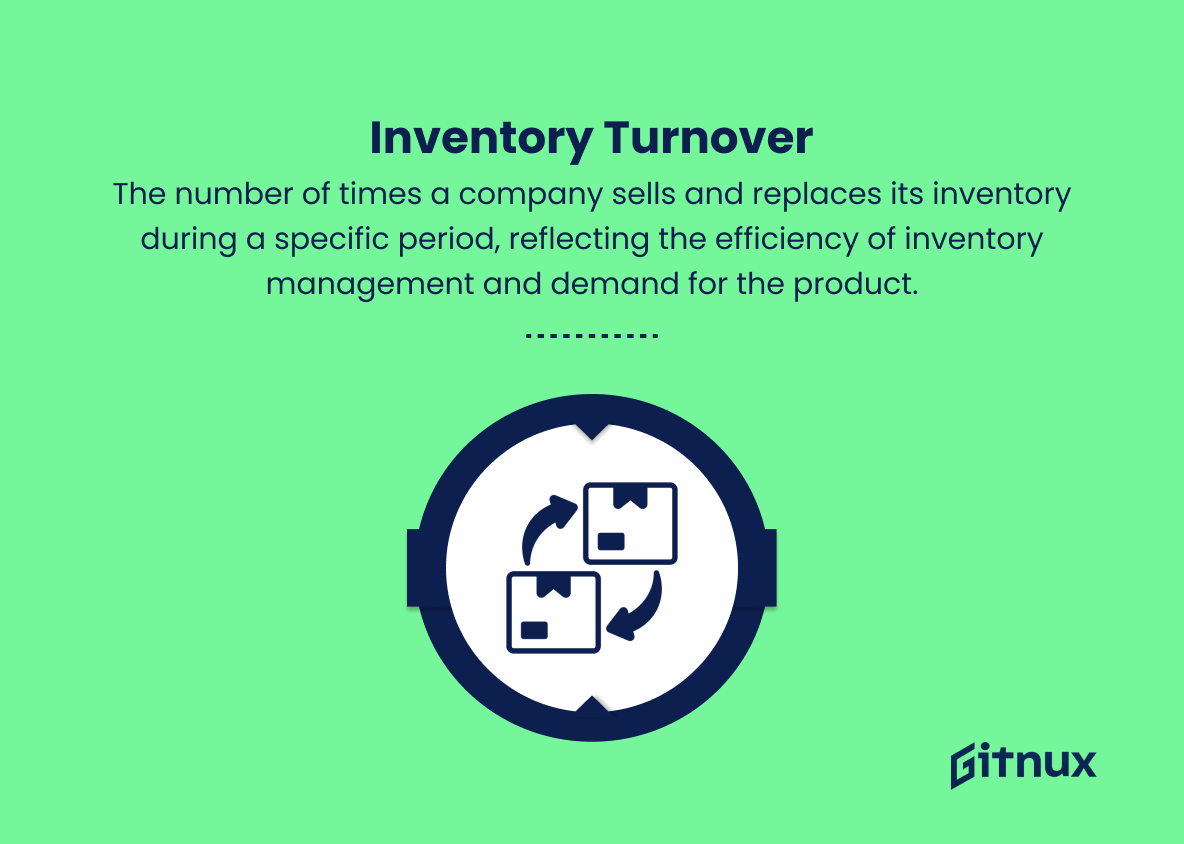
14. Inventory turnover
The number of times a company sells and replaces its inventory during a specific period, reflecting the efficiency of inventory management and demand for the product.
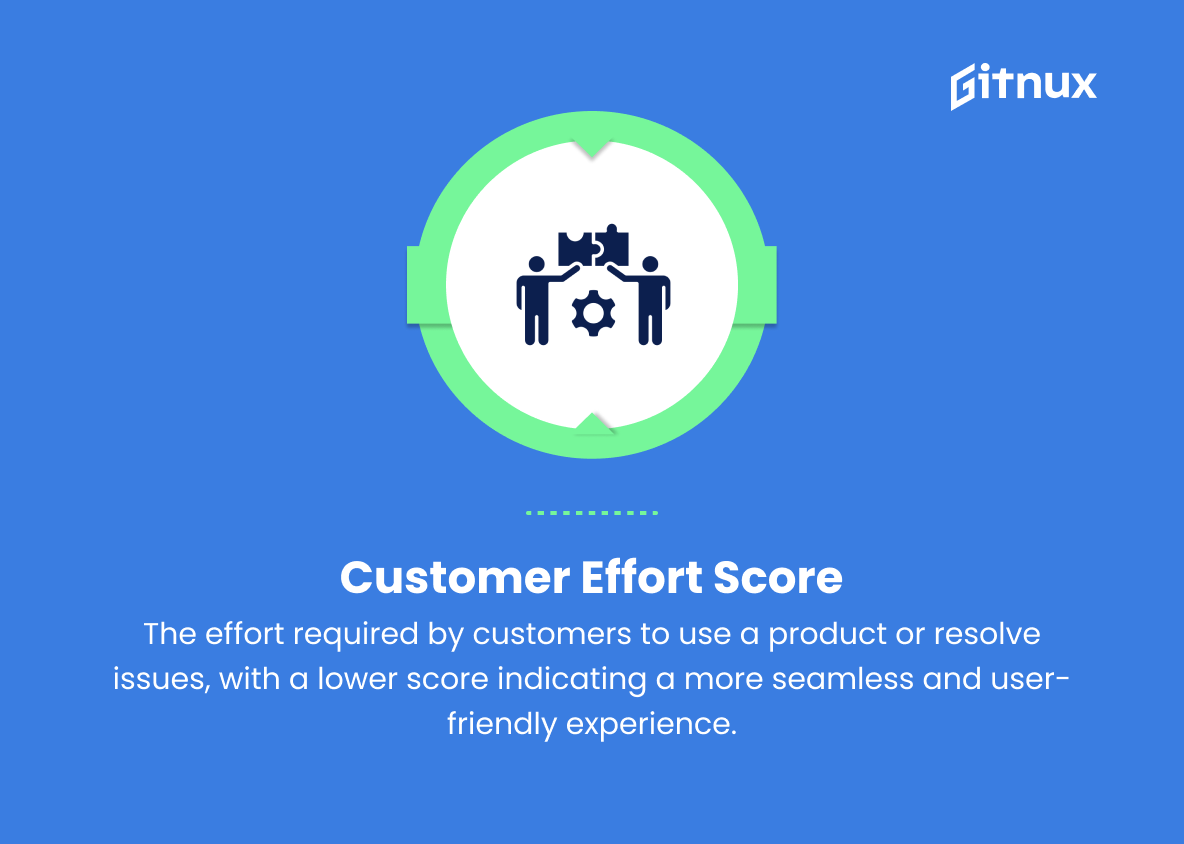
15. Customer effort score (CES)
The effort required by customers to use a product or resolve issues, with a lower score indicating a more seamless and user-friendly experience.
16. Feature usage and adoption rate
The extent to which customers use and adopt new features, providing insight into product development and the value of updates to the target audience.
17. Monthly recurring revenue (MRR)
A measure of a company’s total revenue from subscription-based products, offering insights into the product’s predictability and financial stability.
18. Customer support incidents
The frequency and type of customer inquiries and issues, which can inform product improvements and impact customer satisfaction.
Product Success Metrics Explained
Product success metrics are essential tools to evaluate a product’s performance and impact on the market. Sales revenue highlights the product’s market demand and popularity, while market share indicates competitiveness relative to other similar products. Profit margin reflects the profitability of a product, allowing businesses to gauge the value generated by their investments. Customer acquisition cost (CAC) and customer lifetime value (CLTV) provide insights into the efficiency of marketing efforts and the long-term revenue potential of customers.
Churn rate and net promoter score (NPS) give crucial information on customer satisfaction and loyalty, which can direct enhancements to the product and overall customer experience. Meanwhile, customer satisfaction (CSAT) rates, return on investment (ROI), product usage, and conversion rate demonstrate the product’s effectiveness at meeting customers’ needs and driving sales. Time to market, return rate, and inventory turnover rates allow for an assessment of operational efficiency and competitiveness.
Customer effort score (CES), feature usage and adoption, monthly recurring revenue (MRR), and customer support incidents reveal usability and perceived value of the product, guiding future improvements and customer service strategies. Understanding these metrics allows businesses to identify strengths and weaknesses, make data-driven decisions, and optimize their products for long-term success.
Conclusion
In the rapidly evolving world of product development, understanding and implementing effective Product Success Metrics is critical to staying ahead of the competition. By focusing on the right combination of user engagement, retention, acquisition, and overall revenue, businesses can ensure they are building products that truly resonate with their specific target audience.
Ultimately, analyzing and acting on these key performance indicators will lead to better decision making, continual improvement, and sustained success in the crowded marketplace. Keep a close eye on your Product Success Metrics as they will not only inform your immediate actions but also shape the long-term strategic direction of your product portfolio.
