
In the swiftly evolving world of retail, the battle lines between in-store and online shopping have been distinctly drawn. With the advancement of technology and the rise of e-commerce giants, many consumers have shifted their purchasing habits to the comfort of their couches, simultaneously, the allure of the physical store, where one can interact directly with products, continues to have its own charm. This dramatic transformation has left businesses and consumers alike, scrambling to understand the statistical trends that underpin these changes. This blog post aims to deep dive into the fascinating world of in-store vs online shopping statistics, offering unparalleled insights to help you understand the nuanced consumer behaviors governing the future of retail.
The Latest In Store Vs Online Shopping Statistics Unveiled
In 2020, U.S. consumers spent a staggering $861.12 billion online, an increase of 44.0% year over year.
One cannot help but marvel at the sheer magnitude of the online consumer spending in the U.S. for the year 2020. An astounding figure of $861.12 billion unveils the impressive landscape of digital retail with a staggering 44.0% growth year over year. When juxtaposing the in-store and online shopping statistics, this colossal surge underscores the burgeoning dominance of e-commerce. This data point is impactful, serving as a clear testament to the evolving shopping behaviors of consumers, who are seemingly veering more towards the convenience, range, and flexibility of online shopping. Therefore, this online sales explosion is not just a number but a pivotal turning point in our understanding of current market trends in the ongoing in-store versus online shopping debate.
62% of U.S. shoppers say they prefer to buy from physical stores.
Delving into the heart of an ongoing retail revolution, this statistic throws a curveball, highlighting that 62% of U.S. shoppers still express a penchant for physical store purchases. The statistic underscores the inevitability of physical stores in the expanding universe of retail despite the encroachment of the digital age. Amid a blog post dissecting online versus in-store shopping, it’s a pulsating stat capable of tilting the scales, elucidating that brick-and-mortar stores are far from being edged off the shopping map, and that the tactile experience they offer has an irresistible charm for a significant slice of customers.
However, 80% of shoppers conducted online product research before making a purchase in-store.
Shining a spotlight on the intriguing interplay of in-store and online shopping, the statistic points out a high 80% of shoppers who delve into online research prior to their in-store purchases. It behooves us to note that this trend exemplifies how digital platforms influence bricks-and-mortar retail, highlighting the importance of a strong online presence even for primarily offline retailers. Harnessing knowledge like this not only reshapes our comprehension of modern shopping behaviors, but also provides a savvy blueprint for retailers to smartly integrate their in-store and online strategies. By doing so, they’ll be well placed to meet the demands of digitally-empowered consumers, ultimately driving more in-store traffic and sales.
About 70.9% of all shopping carts are abandoned online, but only 20% in physical stores.
Delving into the intriguing realm of in-store versus online shopping dynamics, the stark contrast between a 70.9% online cart abandonment rate and a modest 20% in-store leaves an indelible mark. It unveils a fascinating narrative on customer behaviors and conversions in different shopping environments. The high abandonment ratio online is symptomatic of the inherent challenges faced by e-commerce businesses, such as lack of immediate gratification, shipping issues, or perhaps, the simple convenience of clicking away. Conversely, the significantly lower rate in physical stores underlines the power of tangibility — having the product within reach — and immediate ownership. This dichotomy serves as a critical roadmap for businesses to strategize, optimize the shopping experience, and ultimately, convert potential interest into confirmed sales.
85% of consumers prefer to shop at physical stores because they like to touch and feel products before they make a purchase.
In delving into the dichotomy of in-store and online shopping, this statistic provides a compelling insight. It illuminates that a hefty 85% of shoppers still delve into brick-and-mortar stores, driven by the tactile experience that online shopping can’t replicate. This noteworthy percentage underscores the tactile allure that physical stores possess – a pull that keeps consumers gravitating back in this digital age. Contrastingly, it challenges the narrative of the “total takeover” by online shopping, illustrating a prevalent consumer craving that might be overlooked in the digital rush. Behaviourally, it unearths an interesting relationship between consumer sensory interaction and purchase decisions, continually shaping the dynamics of the in-store versus online shopping debate.
50% of consumers said they would buy clothes online in 2019, up from 45% in 2016.
In the bustling hubbub of online vs in-store shopping debate, this intriguing statistic serves as a significant milestone. Highlighting an ascending trend from 45% in 2016 to 50% in 2019 of consumers favoring online clothes shopping, it steers us towards the evolving shopping preferences of today’s society. Beyond just numbers, it becomes a spotlight, exposing the crux of transformation in consumer behaviours, as they lean towards the convenience and range of online shopping. In the maze of blog post comparisons between brick-and-mortar and the virtual marketplace, this statistic hence plays a compelling role, painting a bigger picture of the competitive retail landscape, unmasking trends, and leading the conversation towards probable future trajectories.
40% of consumers prefer to purchase electronics in-store, whereas 55% said they prefer to buy them over the internet.
Undoubtedly, the statistic vividly illuminates the shopping inclinations of consumers when procuring electronics. A glance at the numbers immediately reveals a solid preference for online shopping, with 55% of consumers opting for this approach. This tilt towards virtual storefronts could be attributed to factors such as convenience, broader selection, and ease of price comparison.
On the other hand, the 40% who still prefer brick-and-mortar stores for their electronics purchase demonstrates the continued relevance of physical retailers. This demographic could be sworn by the immediate gratification of walking away with a product, the reliability of in-person customer service, or the tactile experience of being able to physically assess a product before purchasing.
Thus, striking a balance between online and in-store offerings could be a strategic stability beam for modern businesses navigating the nuanced landscape of consumer preference. This statistic offers a snapshot into this dynamic playing field for the blog post about In Store Vs Online Shopping Statistics, providing rich insights for retailers aiming to maximize their reach and profitability.
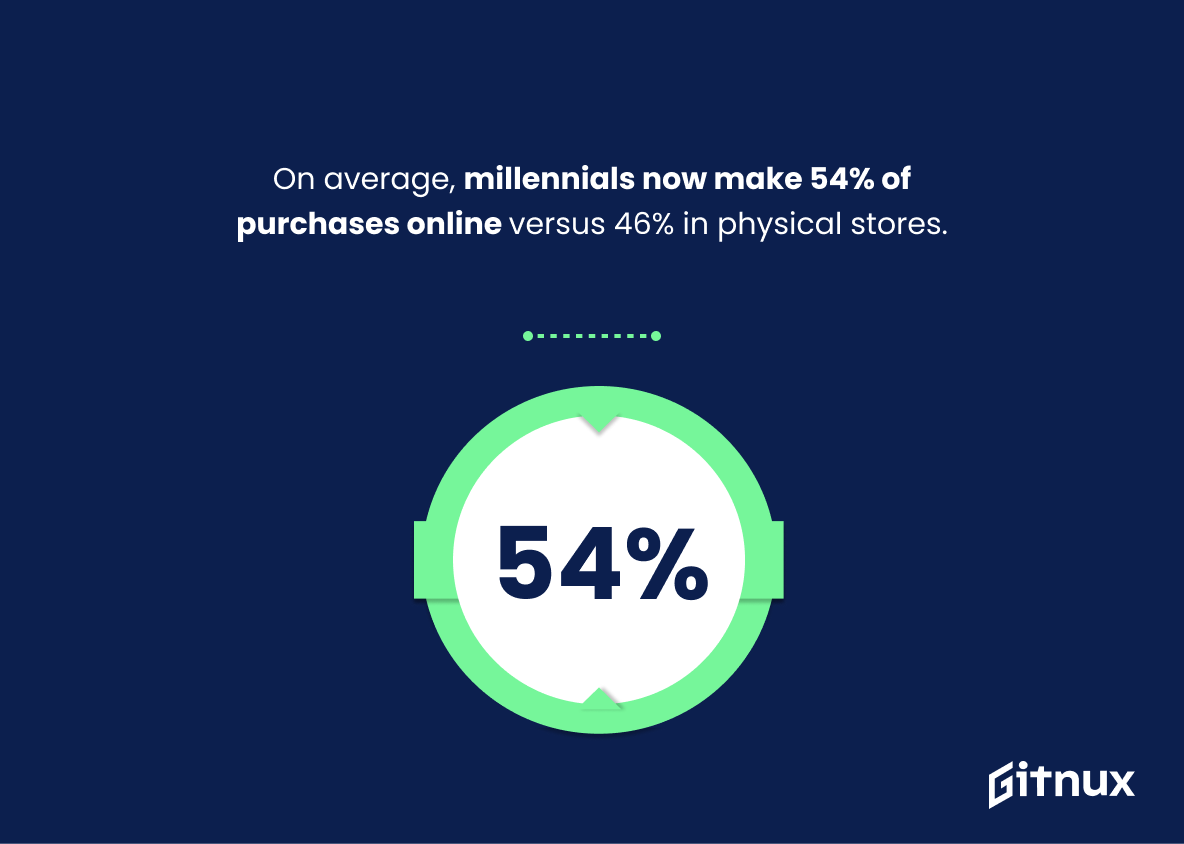
On average, millennials now make 54% of purchases online versus 46% in physical stores.
Delving into the fascinating universe of shopping habits, this intriguing statistic is a valuable guidepost. With millennials being the torchbearers of the digital age, these figures — 54% choosing online platforms and 46% favoring physical stores — holds significance. Within this statistic unfolds a narrative of a generation inclined towards digital platforms, shaping the future of retail. It underscores the growing dominance and influence of online shopping in the retail landscape. Dynamic as this data may seem, it provides essential insights for developing potential marketing strategies, as businesses must cater to this demographic shift towards digital purchasing while still acknowledging the robust segment which cherishes the tangibility and experience of in-store shopping. Evidently, the challenge of balancing both digital and physical store presence has never been more relevant. Be it from the comfort of their couch or the bustle of a busy mall, the modern millennial’s shopping habits are a telltale sign of the retail industry’s evolving dynamics.
Over 50% of product searches start on Amazon, not Google.
Delving into this striking statistic offers a window into the evolving dynamics of global consumer behavior. Revealing that over half of product searches initiate on Amazon, not Google, it underscores the influence e-commerce platforms have over not just online but overall shopping habits. This revelation significantly tilts the scales in the comparison between in-store and online shopping, hinting at the shift in consumer preferences for faster, one-stop shopping experience that online platforms like Amazon offer. It also demonstrates Amazon’s growing prominence as a commercial search engine, challenging the traditional role of Google in product discovery. Distilling this information, it provides valuable insights when discussing or strategizing in-store vs online shopping trends.
69% of consumers believe that they will shop online even more in the future.
Unraveling the threads of this revealing statistic, we delve into the heart of consumer behavior and sentiment, as the numbers reveal an enlightening trend: a sizable 69% fraction of consumers envision an increased reliance on online shopping in the future. Within the discourse of in-store vs. online shopping, this insight fortifies the narrative of the potential and ever-growing dominance of e-commerce. It somewhat signals prospective strategic shifts for retailers, possibly suggesting an amplified focus on bolstering their virtual shopping experiences. Thus, by following the consumers’ gaze into the future, we gain a profound understanding of the fast-approaching horizon of retail, underlining the significant influence and implications of the digital revolution in the shopping industry.
Online is predicted to grow 15% in 2021, while in-store sales are expected to decrease by 2%.
Analyzing the projected growth of online sales in contrast to the expected decline in in-store sales, ingrains a captivating narrative of technology’s accelerating influence on shopping habits. This 15% surge in online transactions underscores the shifting landscape from the traditional brick-and-mortar model to a more digital and convenient paradigm. Conversely, the subtle 2% dip in in-store sales may seem small, but it subtly acknowledges the ebb in favor towards physical stores. Together, these numbers paint a readily dynamic and transformative backdrop to the age-old battle of In-Store Vs Online shopping, embodying the very essence and ethos of this blog post.
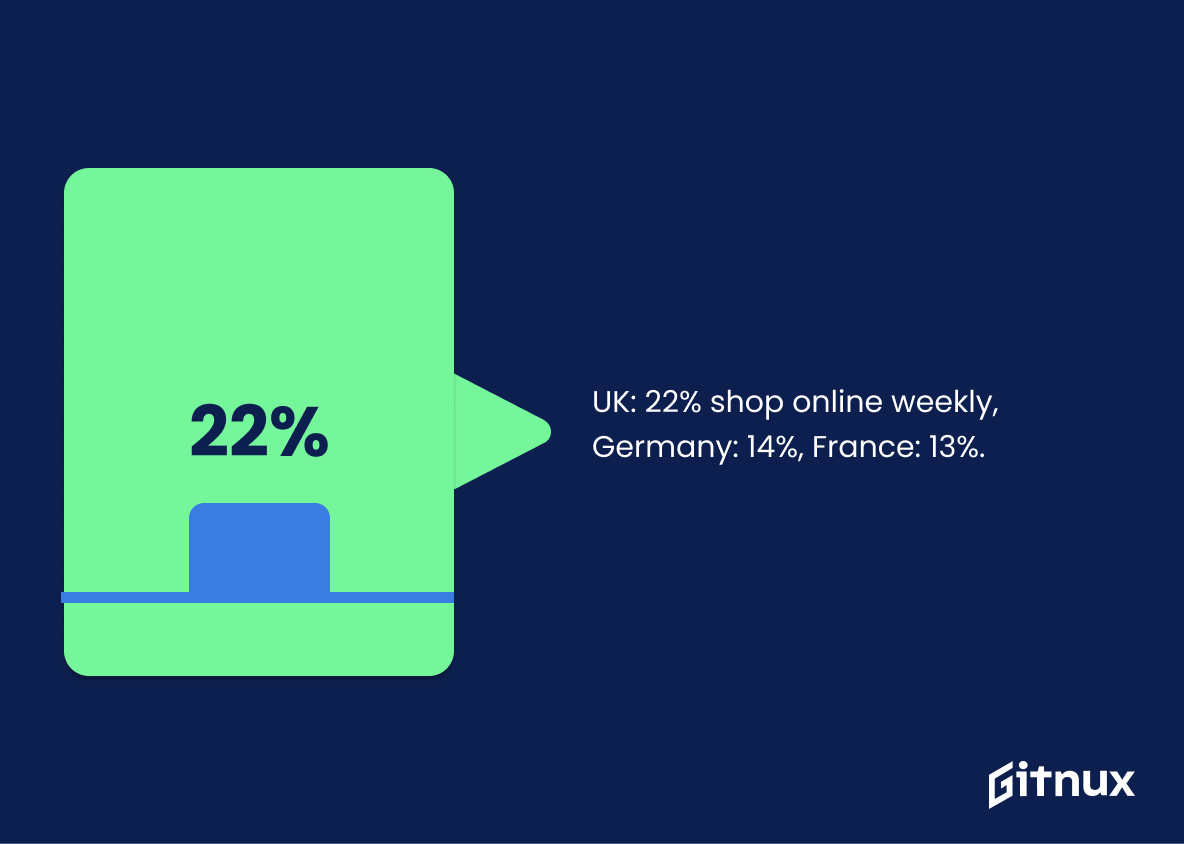
22% of UK consumers shop online weekly, compared with 14% of those in Germany and 13% of those in France.
Delving into these intriguing numbers reveals a trend that UK consumers are more inclined towards weekly online shopping than those in Germany and France. In a blog post focused on dissecting In-Store Vs Online Shopping Statistics, such a comparison becomes critically important. It provides a fascinating look at the differences in shopping habits across these nations, and provides rich analytics that are vital to shaping future marketing strategies or for businesses looking to expanding their e-commerce footprint in these regions. The subtleties in percentages can be a mirror reflecting lifestyle, tech-savviness, level of trust in online platforms, or other cultural tendencies towards online shopping in these countries. In essence, this impactful statistic provides incredible food for thought for both business owners and consumers navigating the digital shopping landscape in the UK, Germany and France.
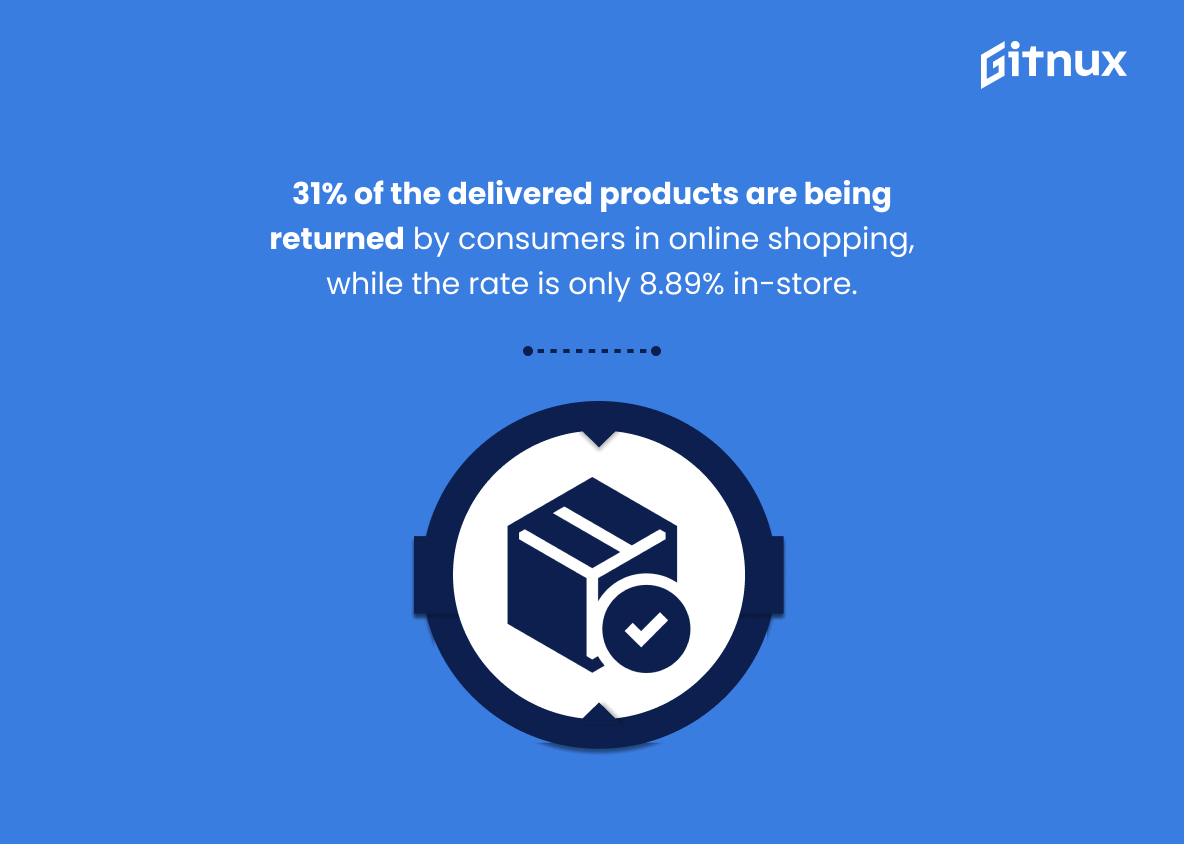
31% of the delivered products are being returned by consumers in online shopping, while the rate is only 8.89% in-store.
This intriguing divergence in figures—31% of returns in online shopping vs. 8.89% in brick-and-mortar stores—casts a compelling light on the challenges that both businesses and consumers face in the realm of digital commerce. For savvy blog readers keen to delve into the intricacies of In-Store vs Online Shopping Statistics, these numbers serve as a catalyst for an engaging discussion on the underlying factors shaping consumer behavior. Notably, they underscore the importance of physical examination in purchasing decisions and the potential pitfalls of online transactions mainly built on product descriptions and images. Commanding nearly a quarter of all online purchases returned, it sends a clear signal to businesses about the urgent need to address e-commerce pain points, enhance virtual shopping experiences, and build refined return systems. On the flip side, the significantly lower return rate among physical stores echoes the tangible advantages of the traditional buying experience, painting a vivid statistical portrait of how today’s consumers continue to value the in-person shopping journey.
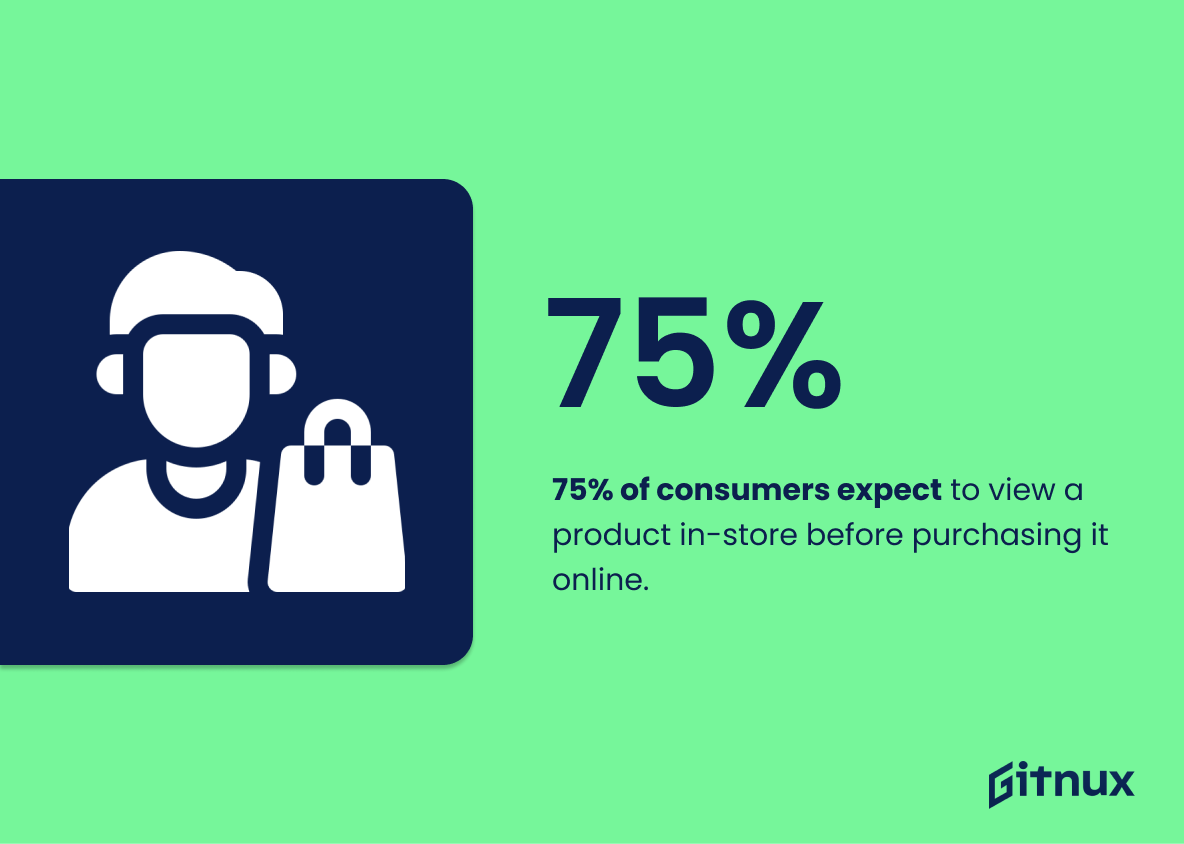
75% of consumers expect to view a product in-store before purchasing it online.
Unraveling this captivating statistic reveals an intriguing narrative: a significant 75% of consumers are more inclined to physically inspect a product in-store before they confidently proceed to purchase it online. Indeed, this intertwines the conventional brick-and-mortar shopping experience with that of the burgeoning eCommerce industry. This curious synthesis of consumer behavior mentioned in a blog post about In Store vs Online Shopping Statistics underlines the significant bridging role physical stores play in influencing online shopping choices. This brings to the fore the value of tactile engagement in boosting consumer trust and assurance – a critical anchor that helps assure consumers of their online purchase decisions. Therefore, both online retailers and physical store owners do well in acknowledging this trend, aptly integrating and dazzling customers by straddling both the physical and virtual retail spaces.
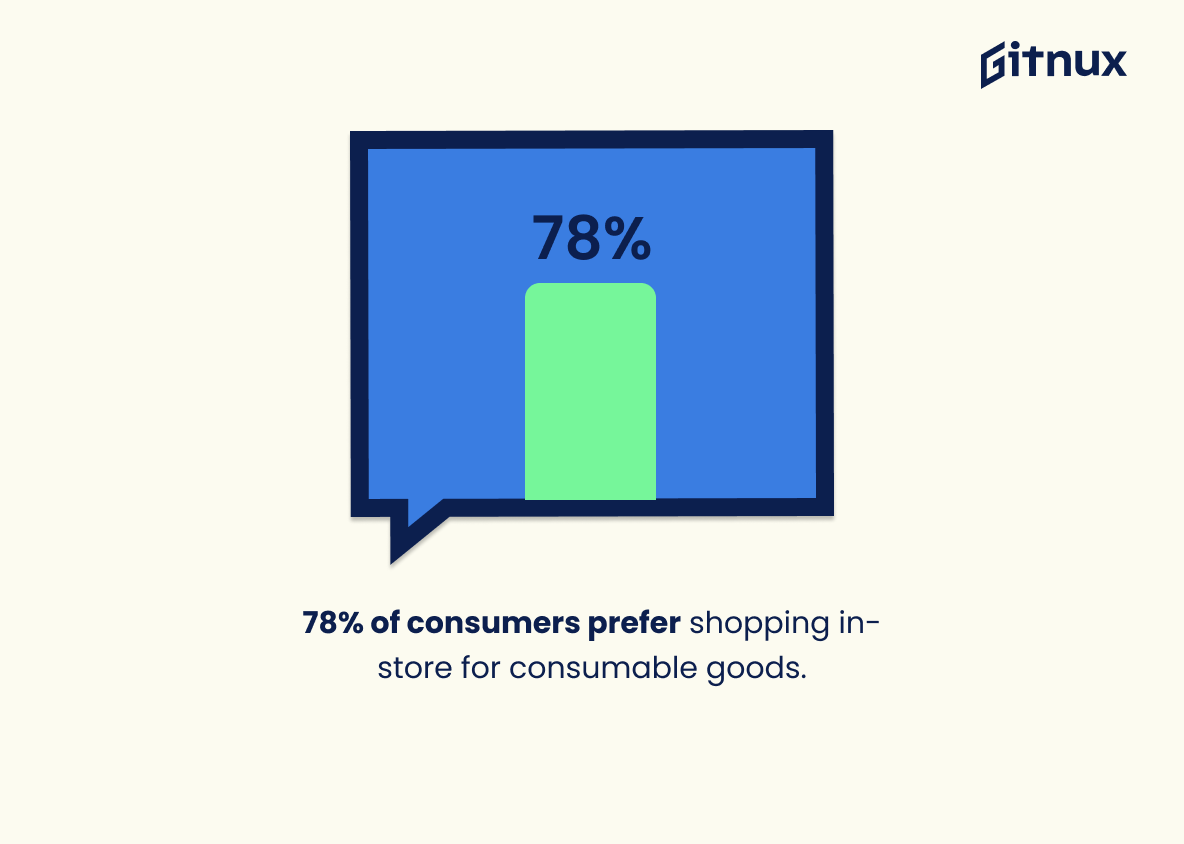
78% of consumers prefer shopping in-store for consumable goods.
Navigating through the bustling aisles of commerce is the shopping preference for an impressive 78% of consumers when it comes to consumable goods. In a world increasingly veering towards the digital realm, this percentage serves as a powerful reminder for retail strategists and e-commerce wizards. It highlights the enduring appeal of in-store shopping in the midst of an online shopping revolution. This figure is not just a number, but a beacon, emphasizing the importance of tactile and sensory interaction with products especially consumables, that’s still desired by the majority. Hence when plotting the future roadmap of retail, between the crossroads of brick-and-mortar versus e-commerce, this statistic cannot be ignored, ensuring the old-fashioned storefront maintains a crucial role in the shopping narrative.
45% of consumers still like to combine both online and physical shopping.
Unveiling the curtain on this intriguing statistic brings to light a fascinating truth – 45% of consumers revel in the union of the physical and online shopping worlds. This fact flavors our discourse around In-store Vs Online Shopping Statistics significantly. It suggests that the shopping landscape is neither black nor white but is graced by shades of grey where digital interfaces dance with brick-and-mortar presence. Far from being a mere number, this 45% forms a significant segment of consumers who seek the sensory experience that physical browsing offers, while simultaneously cherishing the convenience and range provided by the world of e-commerce. Hence, while debating the supremacy of online versus physical stores, it’s essential to appreciate the hybrid model that often finds resonance with a significant chunk of consumers. This statistic calls for businesses to strengthen both their digital and physical storefronts, ensuring a seamless integration of these platforms to enhance the customer shopping experience.
Americans spend an average of roughly $180.95 per online transaction.
In the grand chessboard of in-store vs online shopping, the figure of $180.95 signifies the average amount Americans dispense per online transaction, a crucial pawn in this game. It highlights the financial boldness engulfing the online shopping world, showing that Americans are willing to make substantial digital purchases. In contrast, it offers a reference point to compare whether in-store transactions trend higher or lower. This enlightening breadcrumb offers a glimpse into how major or minor, the individual transactions are that come together to shape the online retail industry’s financial landscape, directly influencing strategies of both e-commerce and brick-and-mortar businesses.
64% of consumers still choose to buy technology products in-store.
Let’s dive deep into why the statistic ‘64% of consumers still opt for in-store purchases of technology products’ carries weight in the context of our blog on ‘In Store Vs Online Shopping Statistics’. Interestingly, this number offers a powerful counter-argument to the prevailing narrative of online shopping dominating every sector. It serves as a vivid reminder that, despite the technological advances and popularity of digital platforms, a substantial proportion of shoppers continue to value the tangible experience of in-store shopping, especially when it comes to tech gadgets. Having the option to touch, test, and compare products real-time gives these consumers a sense of certainty and satisfaction that online shopping platforms may struggle to match. Therefore, this statistic serves as a critical parameter for businesses to comprehend consumer behavior and develop strategies that incorporate both online and in-store shopping experiences.
81% of shoppers expect to make their final purchase in a physical store after finding a product online.
Unraveling such a statistic provides an intriguing perspective for readers delving into the dynamics of in-store and online shopping statistics. With 81% of consumers leaning towards finalizing their purchase in a physical store, it paints a vivid picture of the interplay between digital discovery and tactile purchasing experience. It underscores the importance of maintaining a strong brick-and-mortar presence even in the dot com era while highlighting the role of online platforms as a crucial ‘launchpad’ for consumers’ buying journey. This translates to a trend where cyberspace becomes a marketplace of ideas, discovery, and comparison, whereas the actual commerce transpires in tangible stores. A blog post on in-store versus online shopping statistics would certainly be enriched by this insight, contributing to a nuanced understanding of modern purchasing pathways.
Conclusion
The In-Store vs Online Shopping debate is driven largely by personal preference and is increasingly becoming statistical terrain. A significant portion of shoppers are leaning towards online shopping for convenience, versatility, and breadth of options. However, the tactile experience and immediate gratification offered by in-store shopping still hold substantial sway. As these statistics show, both in-store and online shopping have their strengths, and many consumers have chosen a path that incorporates both types. Businesses can benefit by adopting an omnichannel approach to meet the diverse shopping behaviors and preferences of their customers. The future of retail appears to be not an either-or situation, but rather a blend of both online and physical store shopping experiences.
References
0. – https://www.www.raydiant.com
1. – https://www.digitalmarketinginstitute.com
2. – https://www.www.invespcro.com
3. – https://www.the-future-of-commerce.com
4. – https://www.www.digitalcommerce360.com
5. – https://www.www.oberlo.com
6. – https://www.www.statista.com
7. – https://www.www.cnbc.com
8. – https://www.www.retailtouchpoints.com
9. – https://www.www.bigcommerce.com
10. – https://www.blog.cartstack.com
11. – https://www.www.pewresearch.org
12. – https://www.www.smallbizgenius.net
13. – https://www.www2.deloitte.com
14. – https://www.www.marketingdive.com
