


Welcome to the world of footwear statistics. Whether you are a fashion enthusiast, a sneakerhead, or just someone who loves shoes, this blog post is for you. Here, we will explore the fascinating world of footwear statistics, from the most popular shoe styles to the biggest shoe brands.
We will also look at the global footwear market and the trends that are shaping the industry. So, if you want to know more about the shoes you wear and the industry that produces them, keep reading.
Footwear: The Most Important Statistics
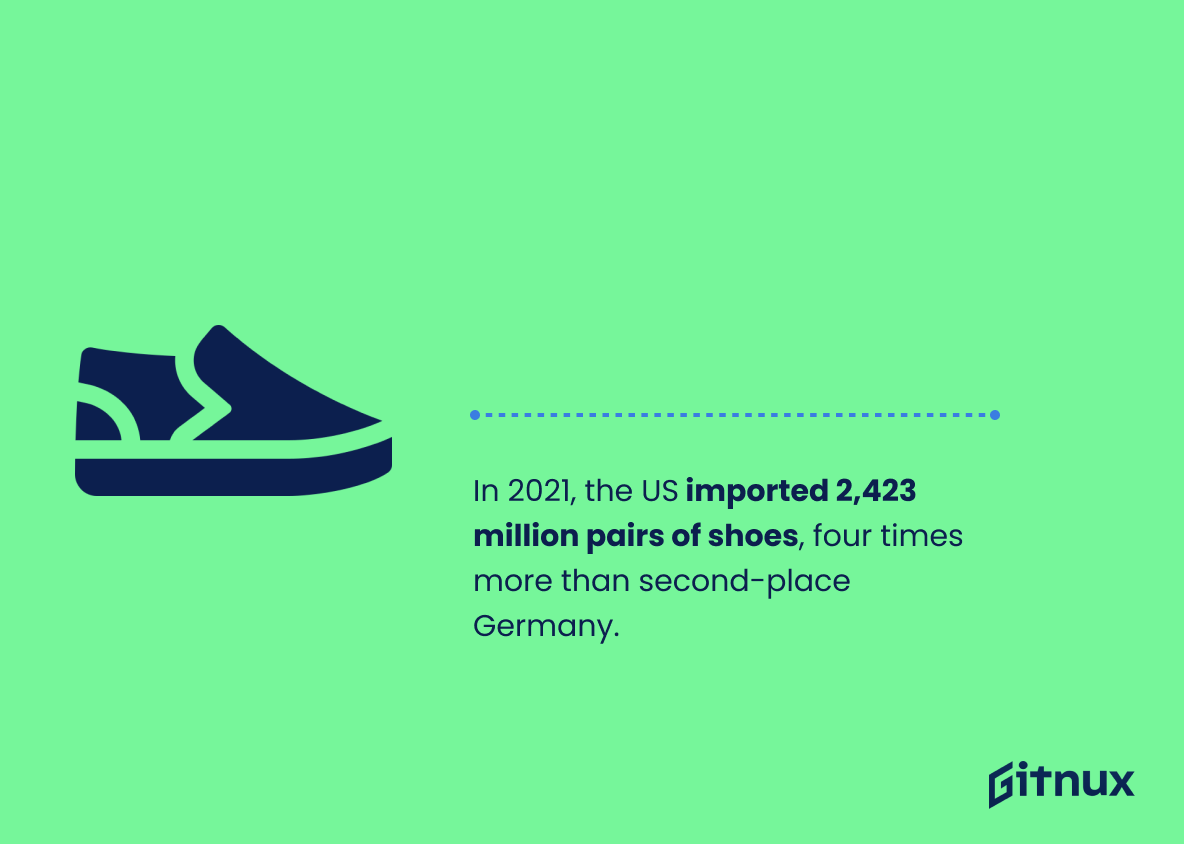
The United States is the largest shoes importer in 2021, with 2423 million pairs of shoes imported, four times more than the second place, Germany.
The export value of leather footwear from India in fiscal year 2021 created 1.5 billion dollars, a significant increase from the relatively stable value level seen in the past two decades.
Footwear Statistics Overview
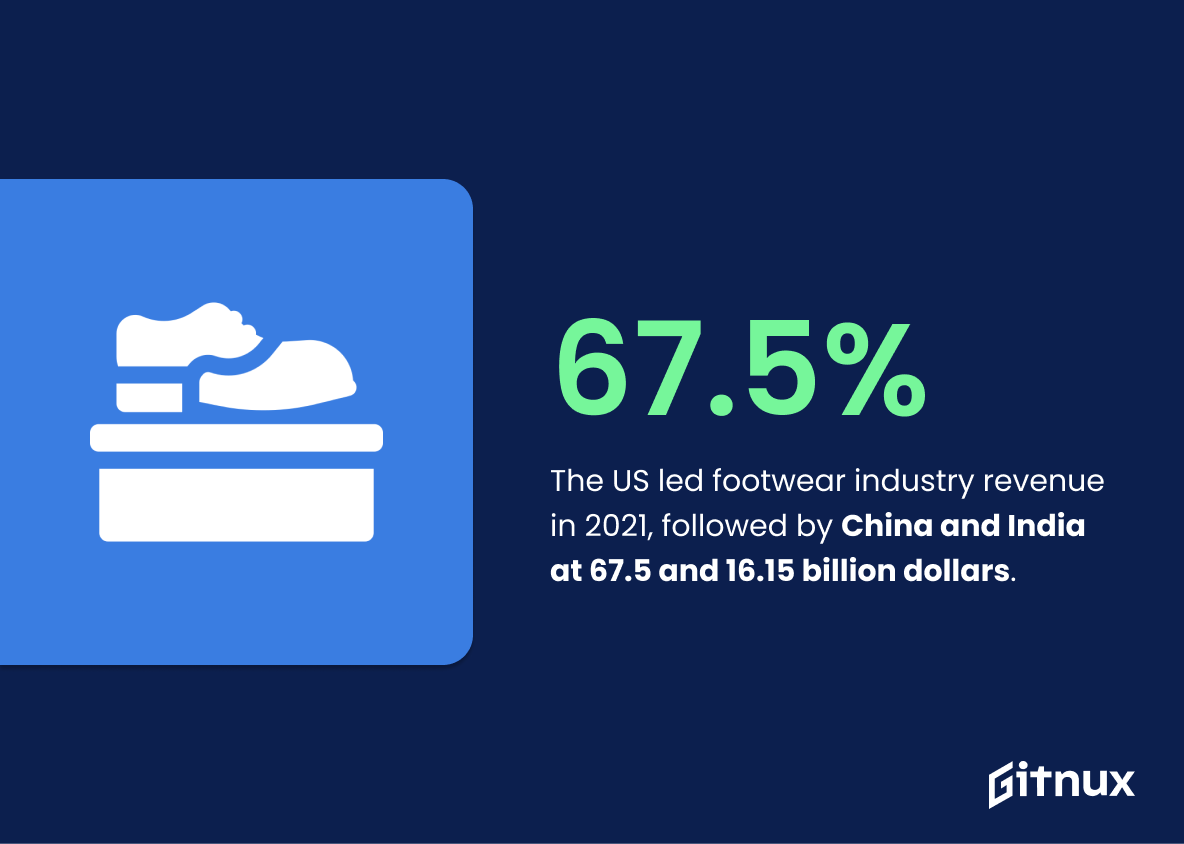
The US generated the highest revenue in the footwear industry in 2021, followed by China and India with 67.5 and 16.15 billion dollars respectively.
Thus, there is a huge dependency of the footwear market on the American market, as well as the significant gap between the revenue generated by the US and China compared to India.
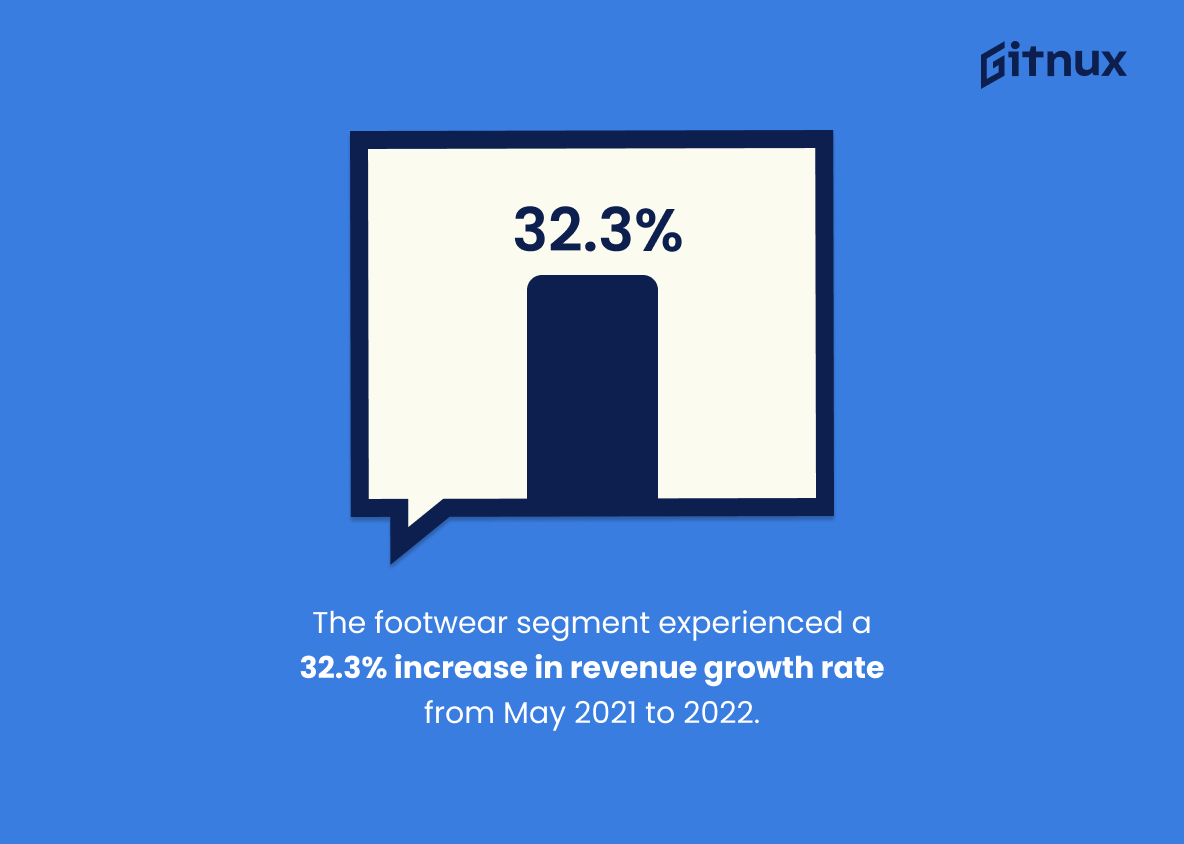
The footwear segment experienced a 32.3% increase in revenue growth rate from May 2021 to 2022.
This shows that the footwear market is growing faster than the apparel market, which indicates that footwear is becoming increasingly popular.
The United States is the largest shoes importer in 2021, with 2423 million pairs of shoes imported, four times more than the second place, Germany.
The United States is the leading importer of shoes, and this has a significant impact on the global footwear industry.
China exported the most shoes in 2021 with 7887 million pairs, far ahead of any other country.
This shows the sheer amount of shoes that China is producing and exporting to the rest of the world, which has significant implications for the global footwear industry, as it shows that China is the dominant player in the market.
China and India are the two largest producers and consumers of footwear, with 4322 million and 2559 million pairs of shoes consumed respectively. This is due to the mirror effect of population and consumption.
Therefore, the countries with the highest populations are also the countries with the highest consumption of footwear.
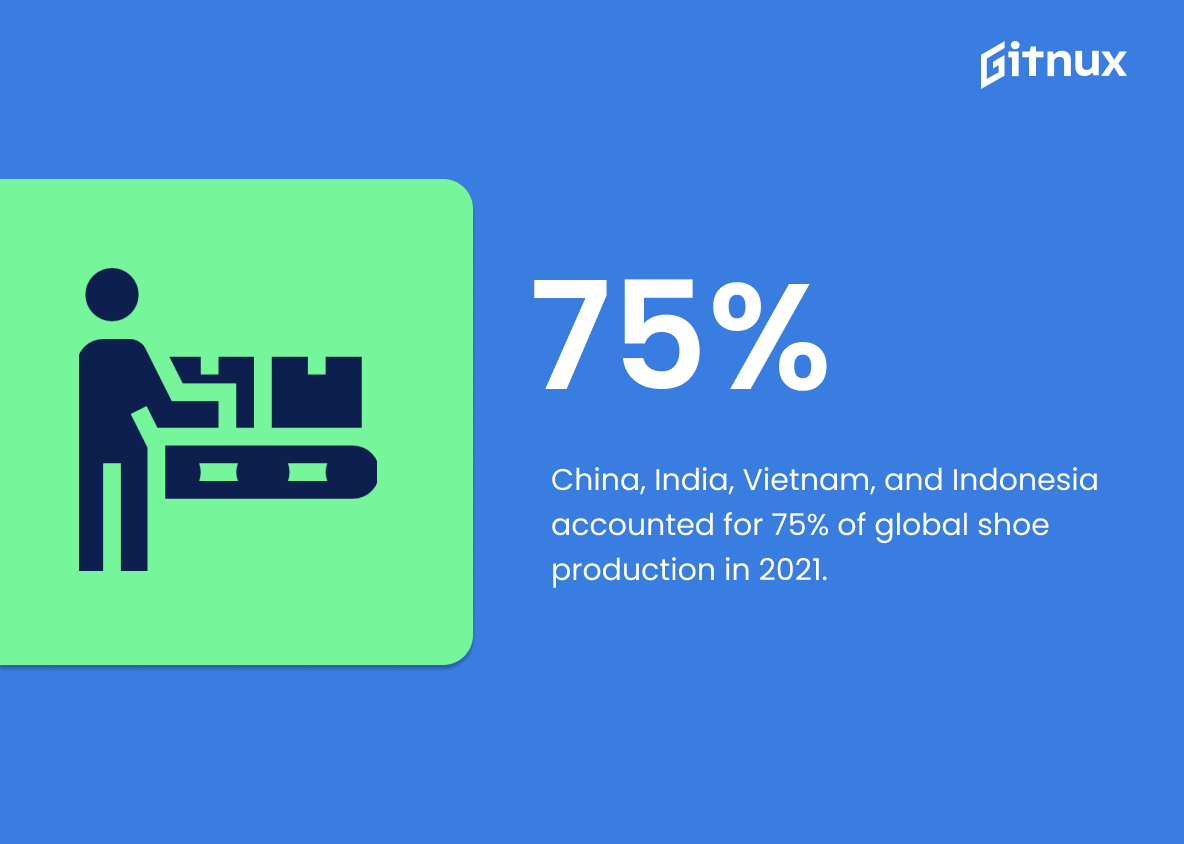
China is the largest producer and exporter of shoes, with India, Vietnam, and Indonesia also playing a major role in the production of footwear. In 2021, these four countries make up 75% of the world’s production.
Nike generated more revenue than Adidas and Puma combined in 2021, with the majority of their income coming from the North American market. This demonstrates Nike’s dominance in the footwear market, and highlights the importance of the North American market for footwear companies.
Skechers earned the most in 2021 with 5941 million euros, while Topsport came in second with 4500 million euros.
The Italian leather footwear industry experienced an income peak of 14.35 billion euros in 2019, but then dropped by two sevenths in 2022. This demonstrates the volatility of the industry, and highlights the importance of monitoring footwear statistics in order to anticipate and prepare for changes in the market.
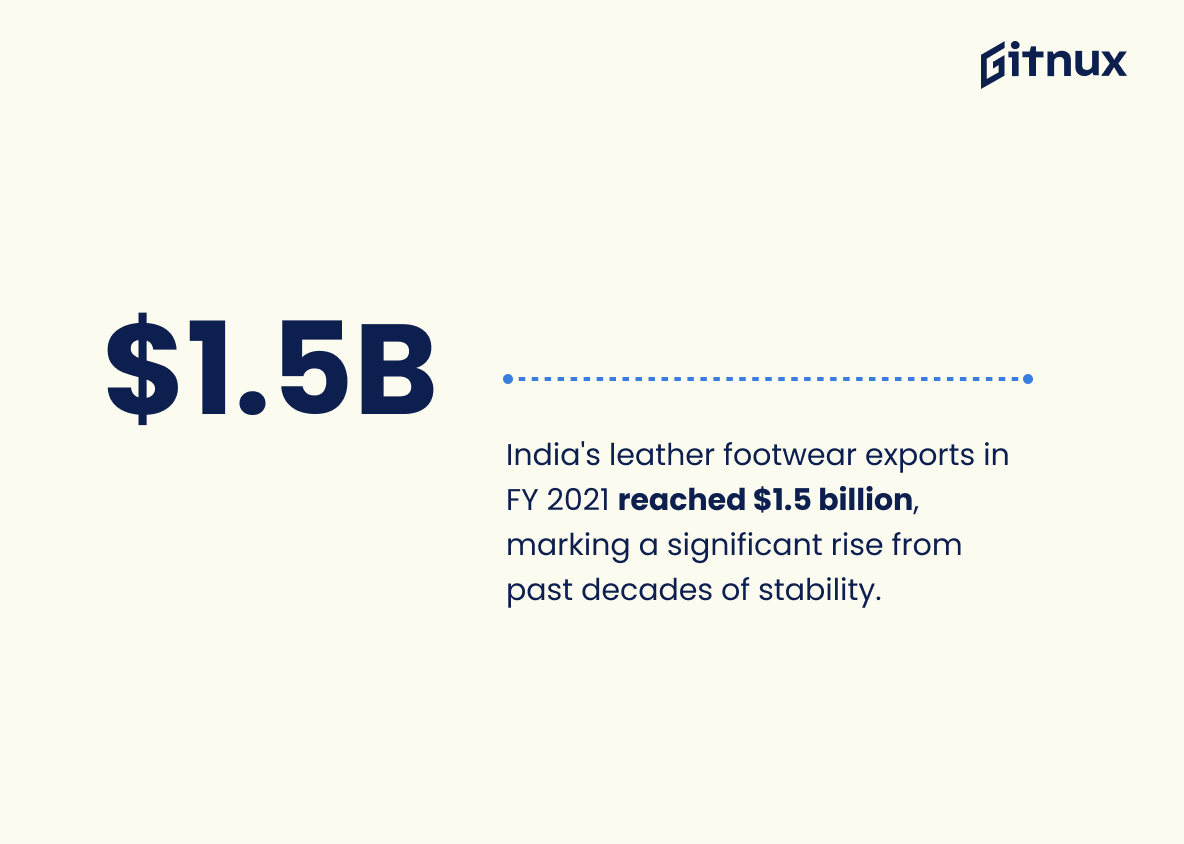
The export value of leather footwear from India in fiscal year 2021 created 1.5 billion dollars, a significant increase from the relatively stable value level seen in the past two decades.
The leather products market in India is continuing to grow and that the export of value added goods is becoming increasingly important. This could be a sign of a larger trend in the industry, and could also indicate that India is becoming a more competitive player in the global footwear market.
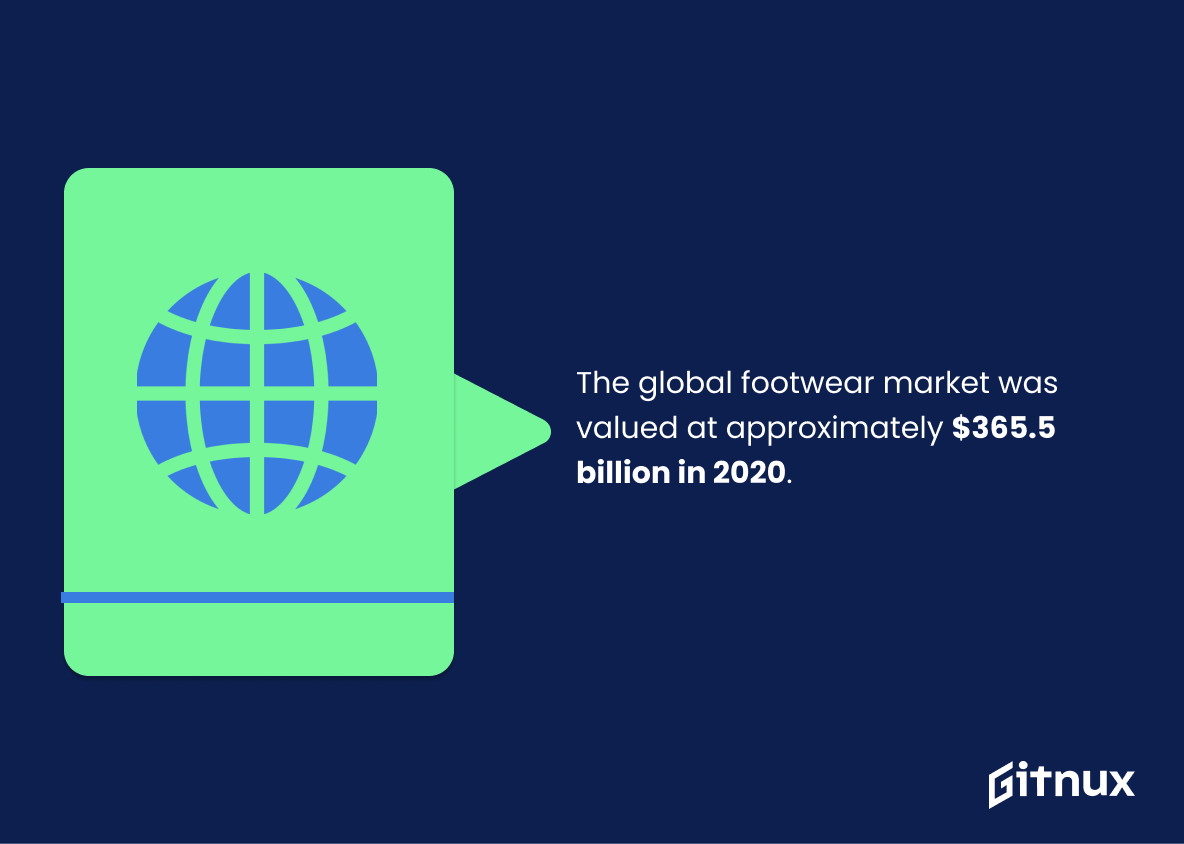
The global footwear market was valued at approximately $365.5 billion in 2020.
This highlights the sheer magnitude of the industry, and the potential for growth and development within it. It also serves as a reminder of the importance of footwear in our lives, and the impact it has on our economy. This statistic is a powerful reminder of the importance of footwear in our lives, and the potential for growth and development within the industry.
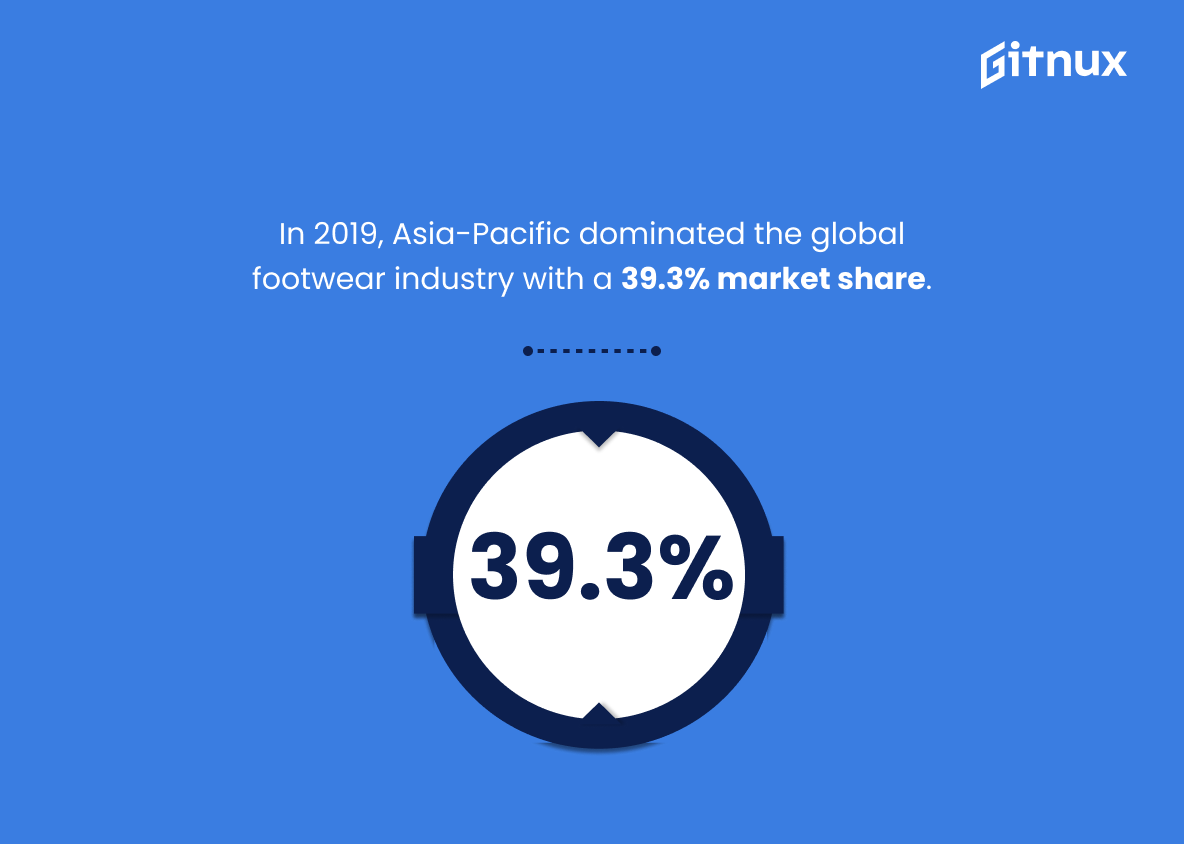
The Asia-Pacific region held the largest market share in the global footwear industry in 2019, accounting for 39.3% of the total market.
This highlights the region’s dominance in the market, with nearly 40% of the total market share. This statistic is a valuable insight for anyone looking to gain a better understanding of the footwear industry and its trends.
In 2020, Nike was the leading footwear company by revenue, generating $37.4 billion.
This highlights the company’s ability to generate a substantial amount of revenue, making them the top choice for many consumers. This statistic is an important indicator of the current state of the footwear industry and provides insight into the trends and preferences of consumers.
The athletic footwear market was valued at $58 billion in 2018 and is projected to grow over $95 billion by 2025.
The market is growing rapidly and is expected to reach a staggering $95 billion by 2025. This is a clear indication that the industry is booming and that there is a great opportunity for businesses to capitalize on this growth. Furthermore, this statistic is a great starting point for anyone looking to gain insight into the current state of the footwear market.
In 2019, more than 24 billion pairs of shoes were produced worldwide.
This speaks to the sheer scale of production and consumption of shoes, and the impact it has on the global economy. It also highlights the importance of footwear in our lives, and how it has become an integral part of our daily lives. This statistic is a powerful reminder of the importance of footwear in our lives, and how it has become an integral part of our daily lives.
In 2019, the United States imported approximately 2.3 billion pairs of shoes.
This speaks to the sheer number of people who are buying shoes, and the amount of money that is being spent on them. It also highlights the importance of the footwear industry in the US economy, and the impact it has on the lives of many people.
Approximately 35% of all shoes sold in the United States in 2019 were made of synthetic materials.
This highlights the increasing popularity of synthetic materials as a viable alternative to traditional materials, and the potential for further growth in the future. It also speaks to the environmental impact of the industry, as synthetic materials are often more sustainable than their natural counterparts. This statistic is an important piece of the puzzle when it comes to understanding the current state of the footwear industry.
Sales of women’s shoes in the United States reached $20.5 billion in 2019.
Women’s shoes are a major part of the footwear industry, and that the demand for them is strong. This statistic is an important piece of information for anyone interested in the footwear industry, as it provides insight into the size and scope of the market.
The average price of a pair of sneakers in the United States in 2020 was around $70.
This provides insight into the average cost of a pair of sneakers, which can be used to compare prices across different brands and styles. Additionally, it can be used to gauge the overall affordability of footwear in the US, and how it has changed over time. This information can be used to inform decisions about what type of footwear to purchase, and how much to budget for it.
The vegan footwear market size was valued at $25.77 billion in 2020.
Vegan footwear is no longer a niche product, but a viable option for consumers looking for stylish and sustainable footwear. This statistic is a clear indication that the vegan footwear market is on the rise, and is likely to continue to grow in the coming years.
In 2019, there were around 2,360 footwear manufacturing establishments in the United States.
The industry is alive and well, with a significant number of establishments dedicated to the production of footwear. This statistic is a testament to the economic impact of the footwear industry in the United States, and it is an important piece of information to consider when discussing the industry’s overall health.
Sports footwear accounted for 41.2% of the global footwear market.
Sports footwear is a major player in the footwear industry, and its influence is far-reaching. This statistic is a valuable insight into the current trends in the footwear industry, and it is an important piece of information for anyone interested in the footwear market.
In 2019, the average American spent approximately $392 on footwear.
Footwear is a significant expense for many people, and that it is an important part of their wardrobe. This statistic is also useful for understanding the size of the footwear market in the United States, and how much money is being spent on footwear each year.
In 2020, approximately 8% of all footwear imports worldwide came from Vietnam.
The country has become a major player in the global footwear market, with a significant portion of the world’s imports coming from Vietnam. This is an impressive feat, and it speaks to the quality and affordability of the footwear produced in Vietnam. It also highlights the potential for further growth in the industry, as more countries look to Vietnam for their footwear needs.
The orthopedic footwear market is expected to reach $12.4 billion by 2030.
The demand for orthopedic footwear is increasing, and that the industry is expected to experience significant growth in the coming years. This is an important point to consider when discussing footwear statistics, as it highlights the potential for businesses to capitalize on this growing trend.
The average household in the United Kingdom spent £134 on footwear in 2020.
Footwear is a significant expense for many households, and that it is a priority for them. This statistic is also a useful benchmark for comparing the spending habits of households in the UK with those in other countries. It can also be used to measure the impact of economic changes on the spending habits of households in the UK.
The global children’s footwear market is expected to grow at a CAGR of 8.7% from 2020 to 2027.
It is likely to experience significant growth in the coming years. This makes it an important piece of information for anyone interested in the footwear industry, as it provides insight into the potential of the market and the opportunities it presents. As such, it is an invaluable resource for a blog post about footwear statistics.
Conclusion
In conclusion, the statistics on footwear demonstrate the importance of footwear in our lives. From the data, we can see that the global footwear industry is growing steadily, with the Asia Pacific region leading the way.
We can also see that the average person owns more than one pair of shoes, and that sneakers are the most popular type of footwear. With the right information and trends, footwear companies can make informed decisions about their product lines and marketing strategies.
References
1 – https://www.statista.com/forecasts/758682/revenue-of-the-footwear-market-worldwide-by-country
2 – https://www.statista.com/statistics/1028460/apparel-and-footwear-year-on-year-revenue-growth-rates-by-segment-worldwide/
3 – https://www.statista.com/statistics/227308/leading-10-global-footwear-importers-by-country/
4 – https://www.statista.com/statistics/227296/leading-10-global-footwear-exporters-by-country/
5 – https://www.statista.com/statistics/227278/leading-10-global-footwear-consumers-by-country/
6 – https://www.statista.com/statistics/227256/leading-10-global-footwear-producers-by-country/
7 – https://www.statista.com/statistics/278834/revenue-nike-adidas-puma-footwear-segment/
8 – https://www.statista.com/statistics/455413/leading-global-shoe-companies-based-on-revenue/
9 – https://www.statista.com/statistics/532026/turnover-leather-footwear-industry-italy/?locale=en
10 – https://www.statista.com/statistics/940809/export-value-of-leather-footwear-india/?locale=en
11 – https://www.globenewswire.com
12 – https://www.statista.com
13 – https://data.census.gov
14 – https://oec.world
15 – https://www.grandviewresearch.com
16 – https://www.worldfootwear.com
17 – https://www.adroitmarketresearch.com
18 – https://industrygrowthinsights.com
