In today’s rapidly evolving digital landscape, organizations are constantly looking for ways to streamline operations, optimize processes, and meet ever-changing customer demands. One highly transformative methodology that has emerged to support this drive for efficiency and innovation is DevOps – a collaborative and integrated approach that connects development and operations teams. As productivity and responsiveness become paramount, it’s imperative that organizations evaluate their DevOps performance, with key performance indicators (KPIs) being a critical tool.
In this blog post, we will delve into the world of DevOps KPIs, exploring their importance, key metrics, and how organizations can leverage these insights to create a sustainable, competitive advantage. By implementing a robust and comprehensive KPI tracking strategy, organizations can ensure that they remain adaptable, agile, and successful in an increasingly complex technology landscape.
DevOps KPIs You Should Know
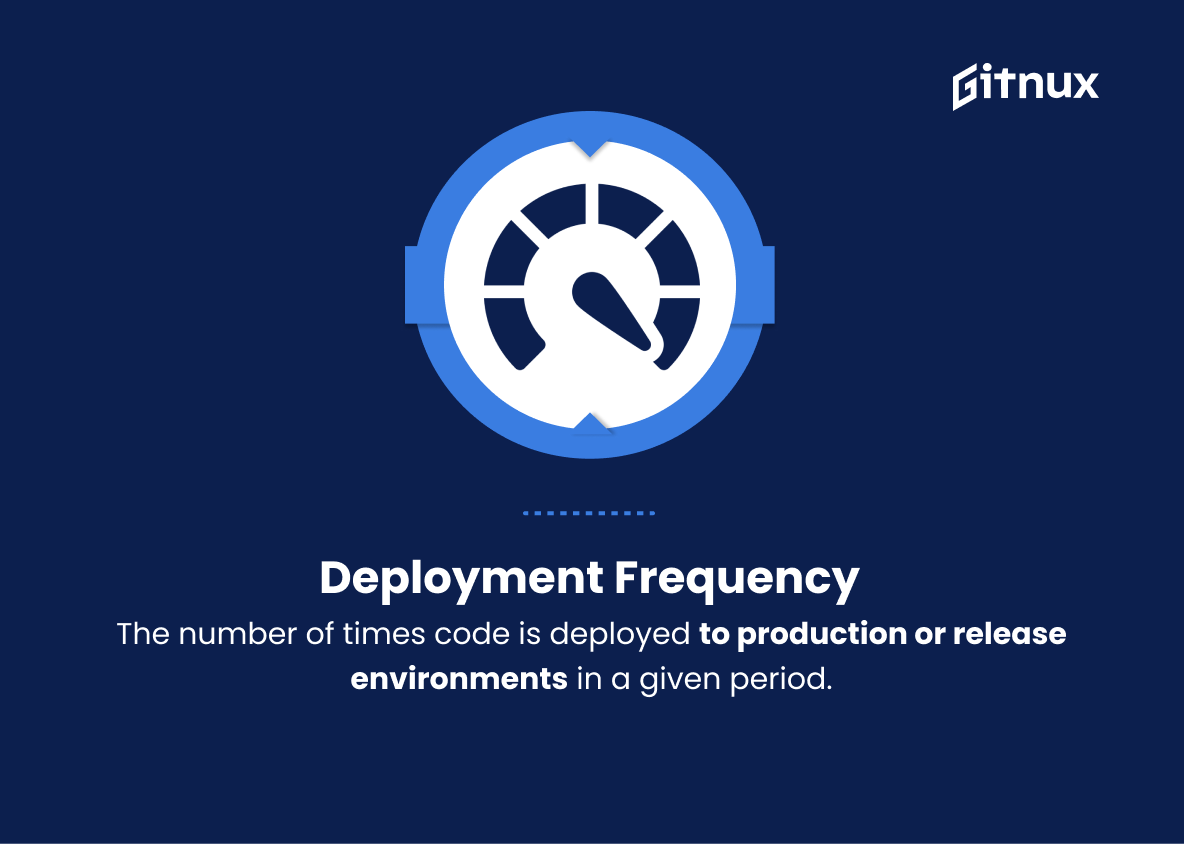
1. Deployment frequency
The number of times code is deployed to production or release environments in a given period. It indicates the overall speed and efficiency of the DevOps process.
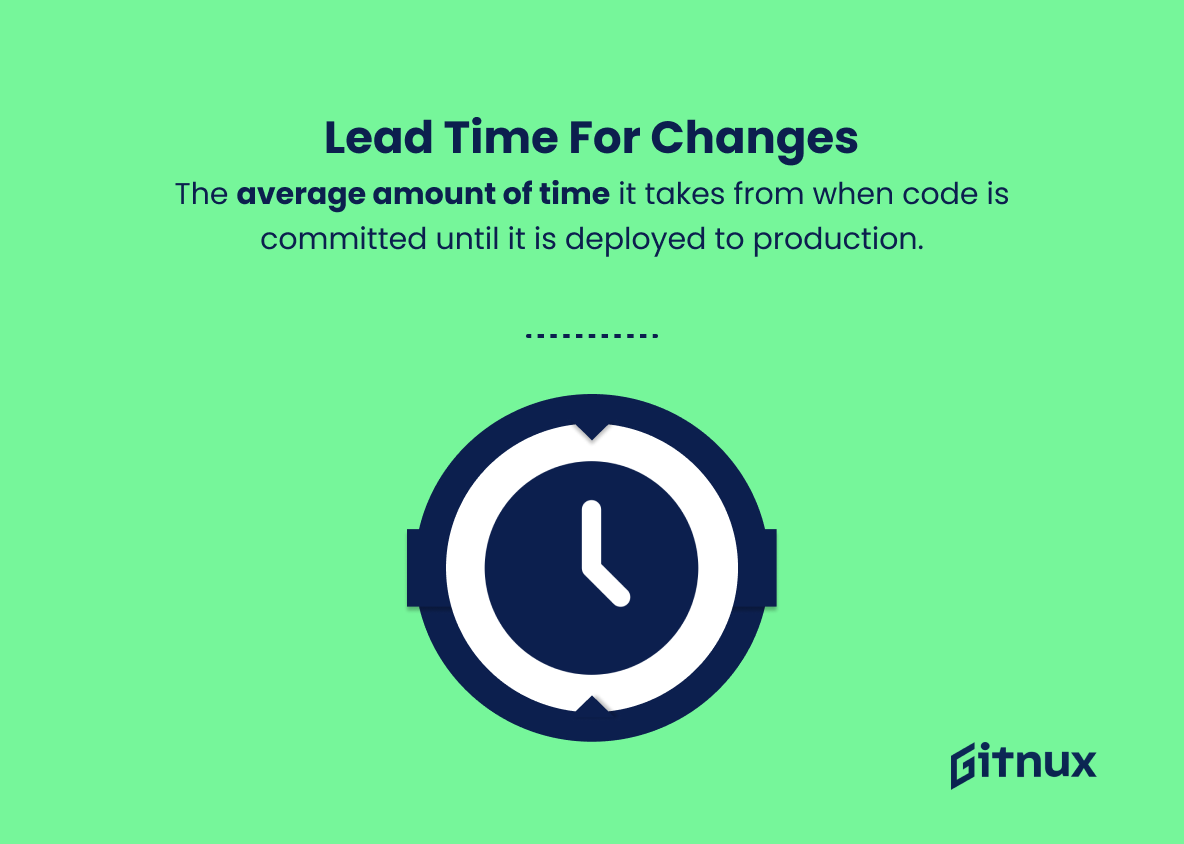
2. Lead time for changes
The average amount of time it takes from when code is committed until it is deployed to production. This KPI measures the speed of the software delivery process.
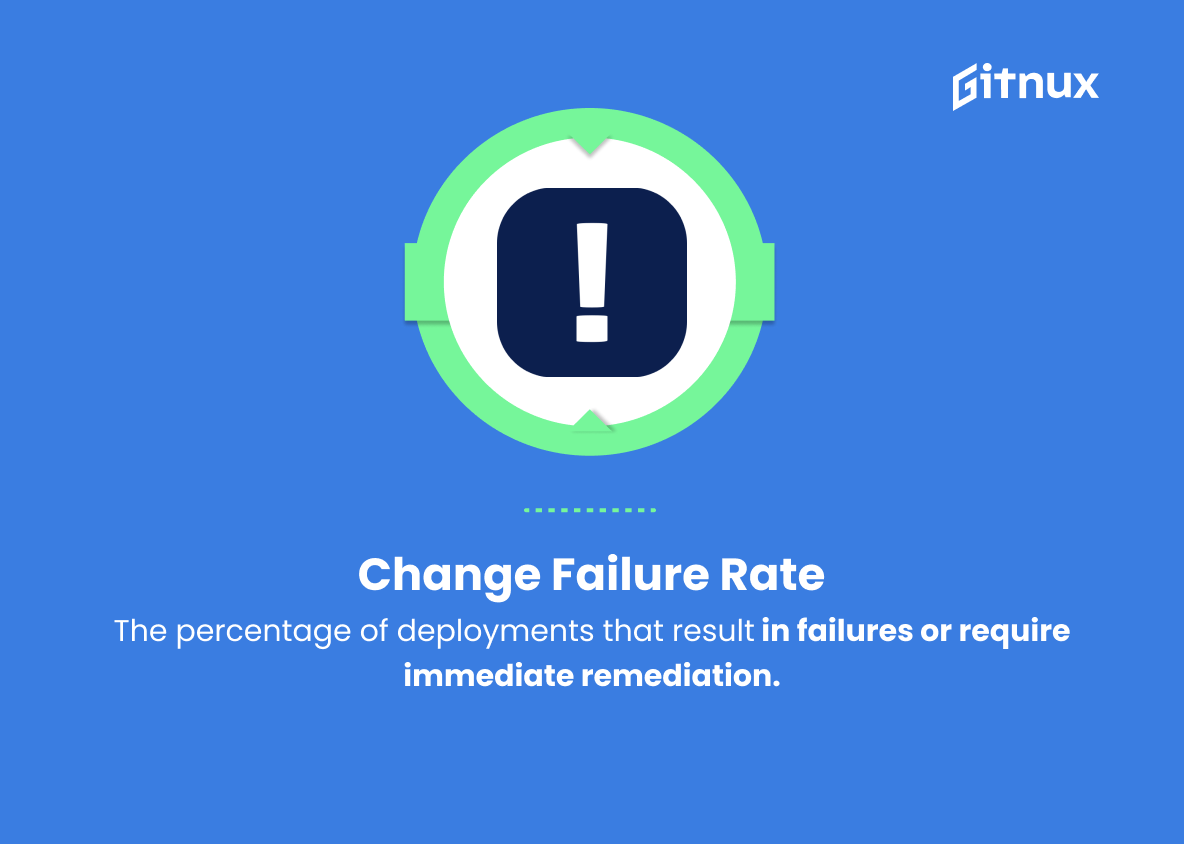
3. Change failure rate
The percentage of deployments that result in failures or require immediate remediation. A low change failure rate indicates a more stable and reliable software delivery pipeline.
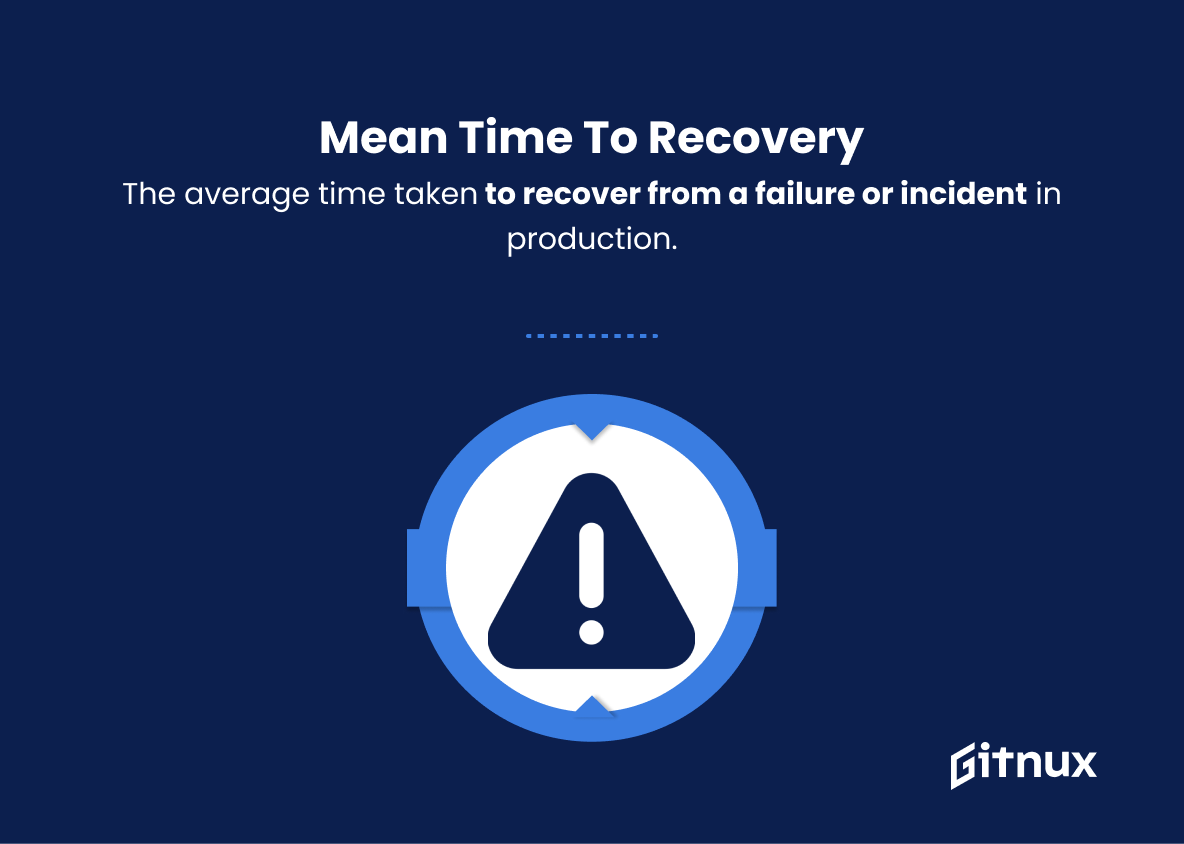
In today’s rapidly evolving digital landscape, businesses are continually seeking ways to streamline their operations, optimize their processes, and meet their ever-changing customer needs.4. Mean time to recovery (MTTR)
The average time taken to recover from a failure or incident in production. A shorter MTTR indicates a more efficient incident response process and a more resilient system.
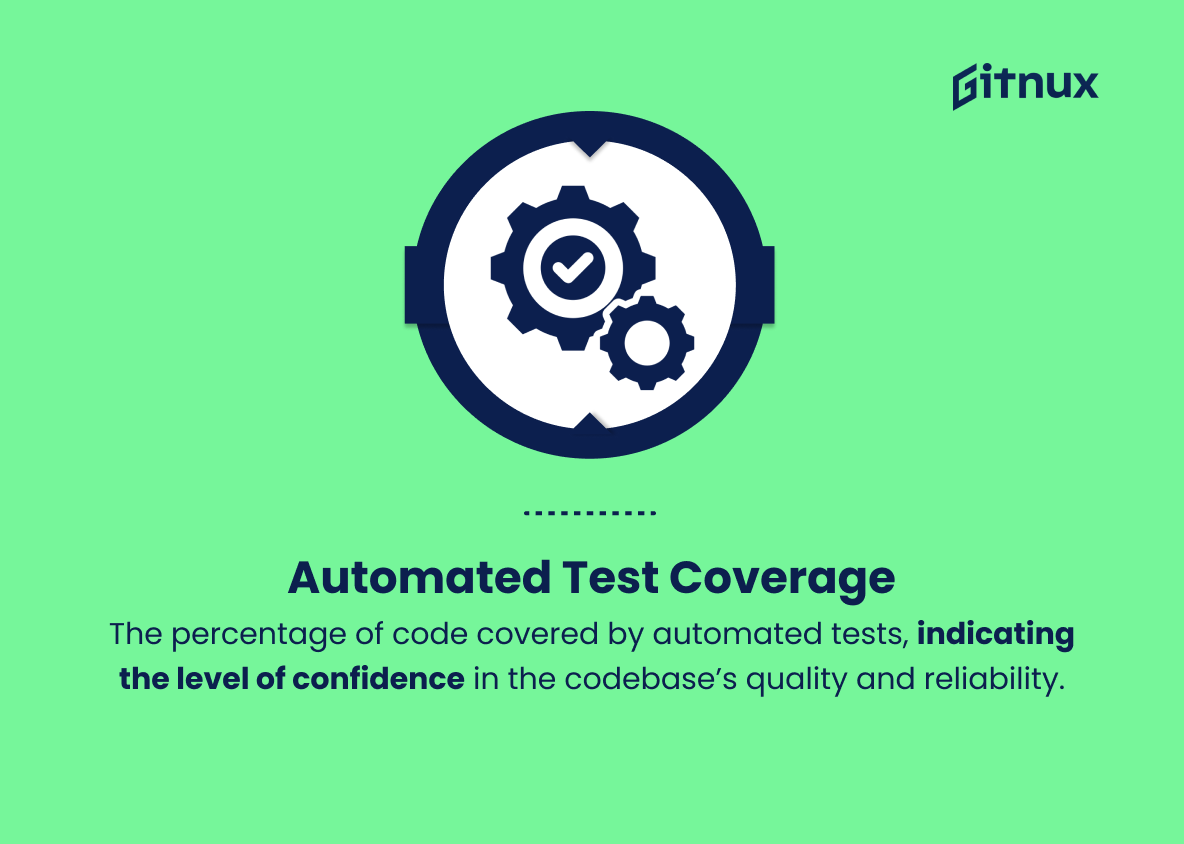
5. Automated test coverage
The percentage of code covered by automated tests, indicating the level of confidence in the codebase’s quality and reliability.
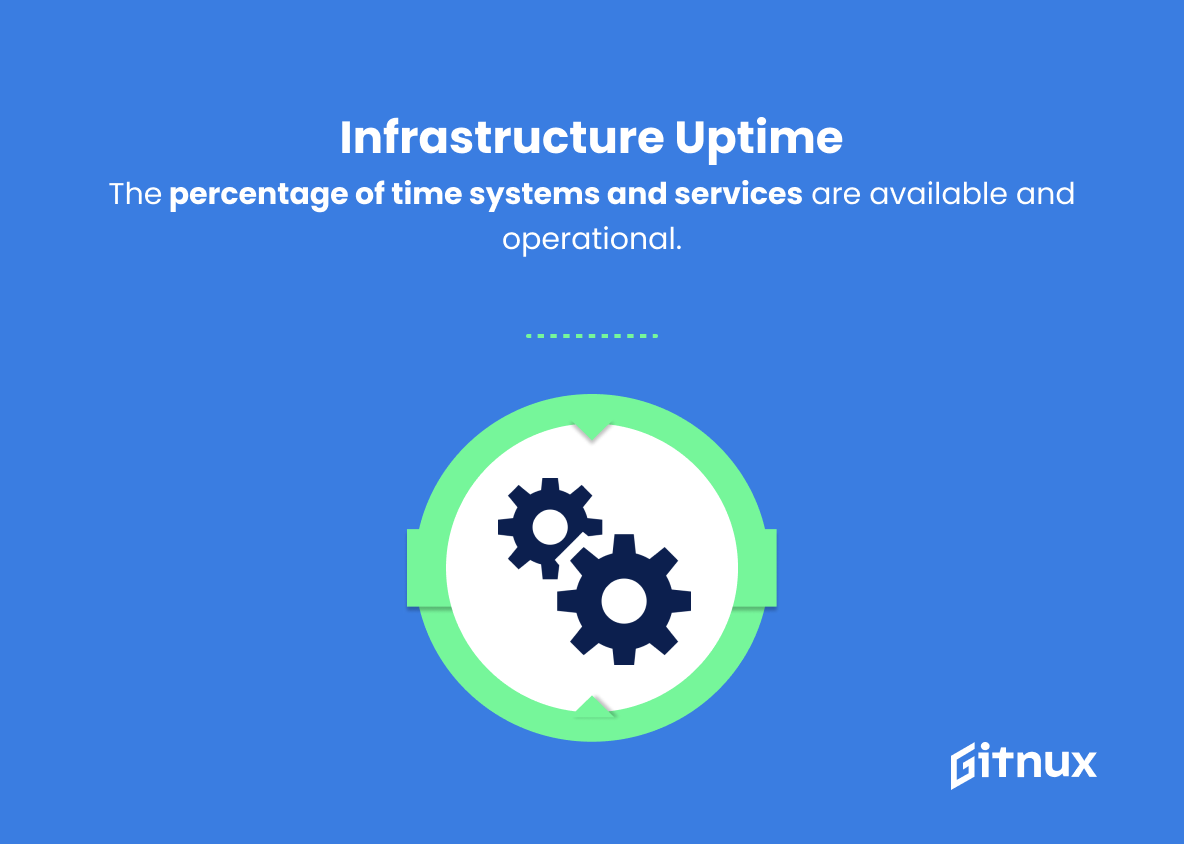
6. Infrastructure uptime
The percentage of time systems and services are available and operational. A higher uptime indicates increased reliability and stability of the infrastructure.
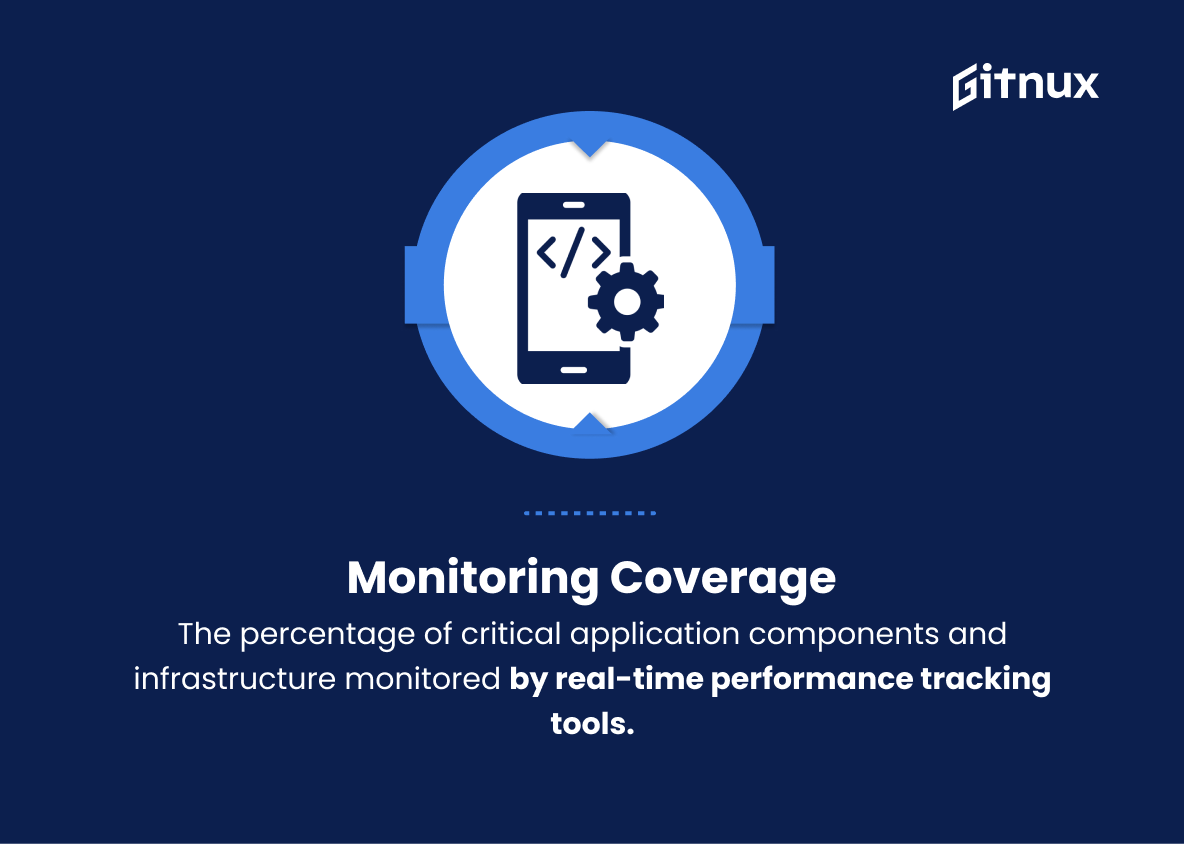
7. Monitoring coverage
The percentage of critical application components and infrastructure monitored by real-time performance tracking tools. An adequate monitoring coverage helps detect and mitigate issues before they impact end-users.
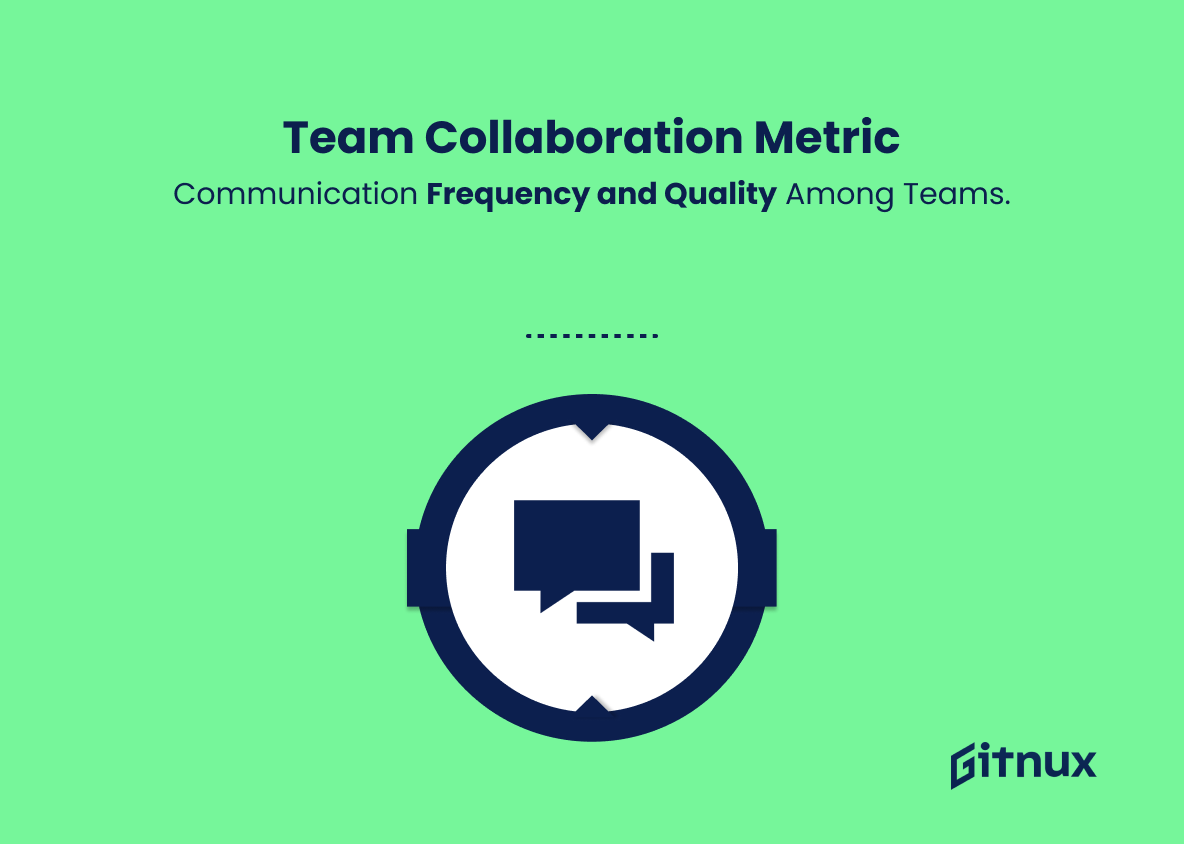
8. Team collaboration metric
The frequency and quality of communication among developers, operations, QA, and other stakeholders, which can be measured by tracking tools usage, meeting minutes, or shared documentation.
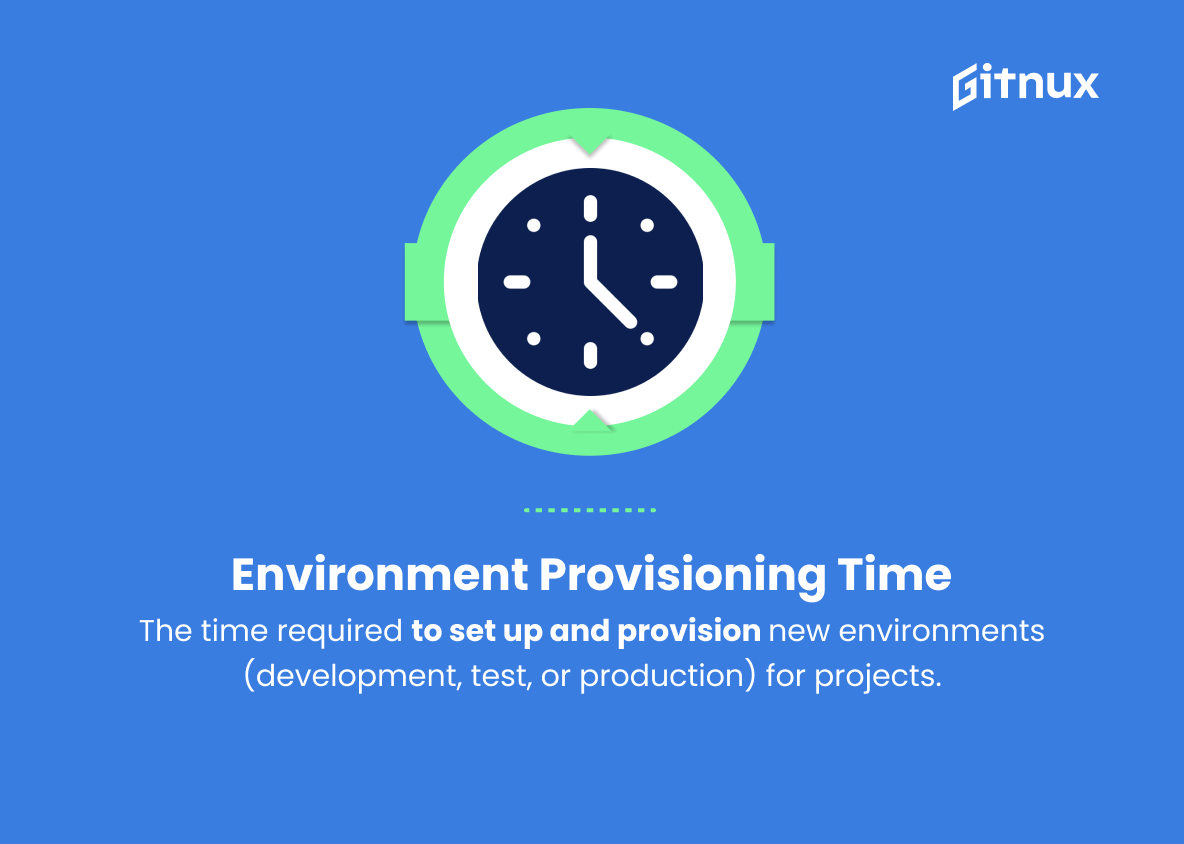
9. Environment provisioning time
The time required to set up and provision new environments (development, test, or production) for projects. Faster provisioning indicates a more streamlined and efficient infrastructure management process.
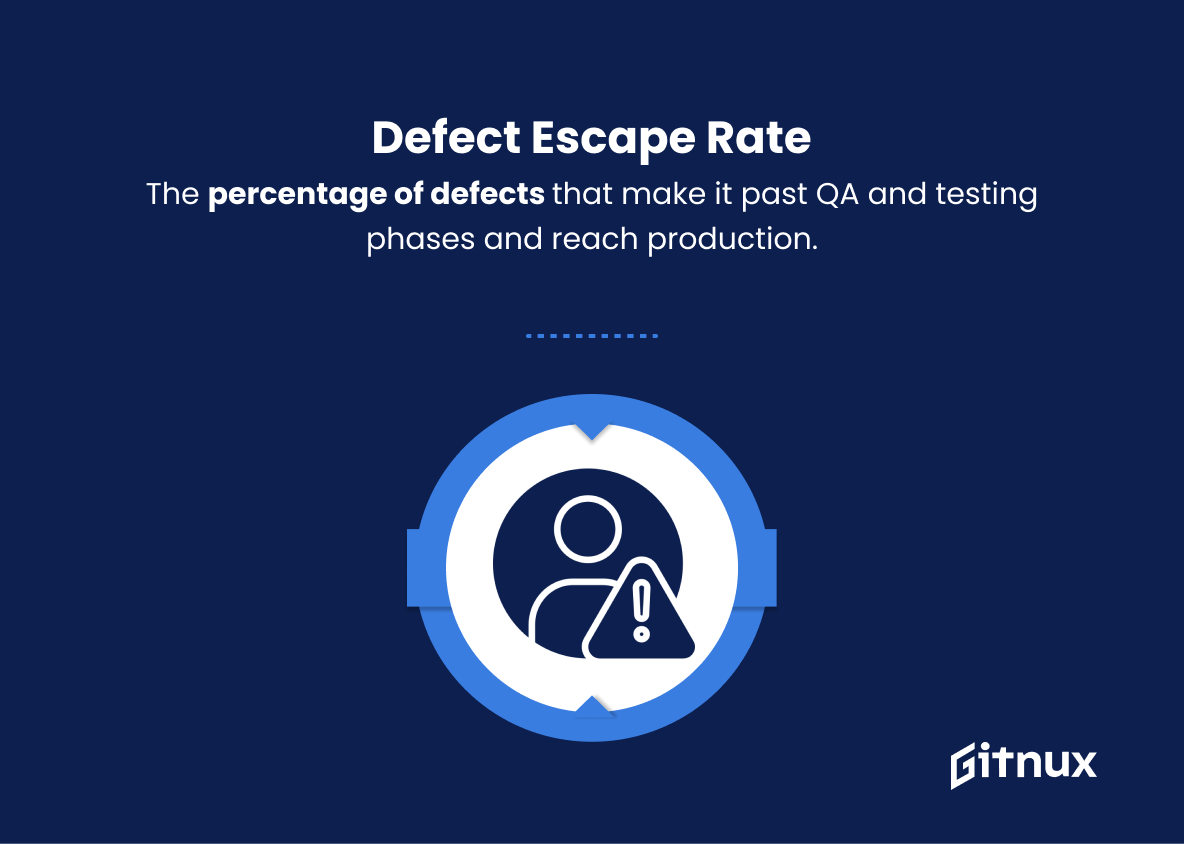
10. Defect escape rate
The percentage of defects that make it past QA and testing phases and reach production. A lower defect escape rate means improved quality of software being delivered.
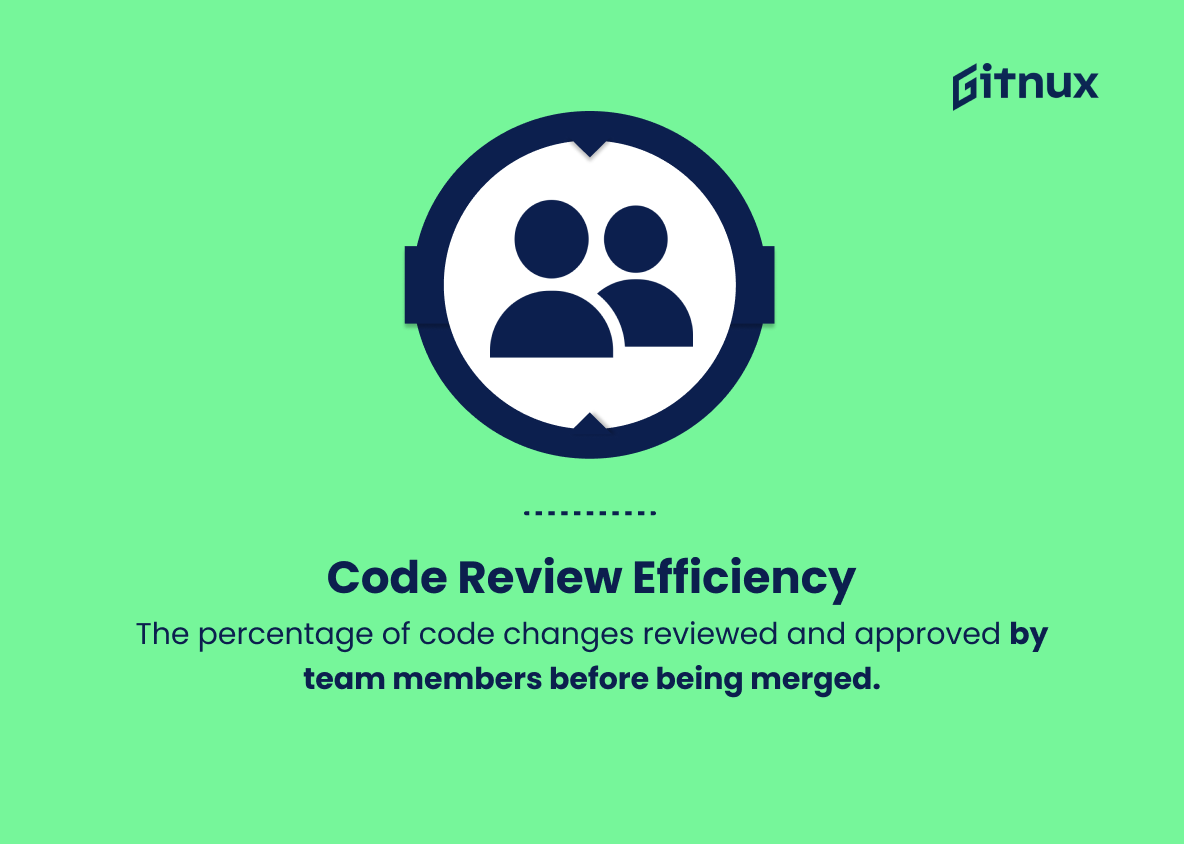
11. Code review efficiency
The percentage of code changes reviewed and approved by team members before being merged. Efficient code reviews contribute to higher code quality and a more unified codebase.
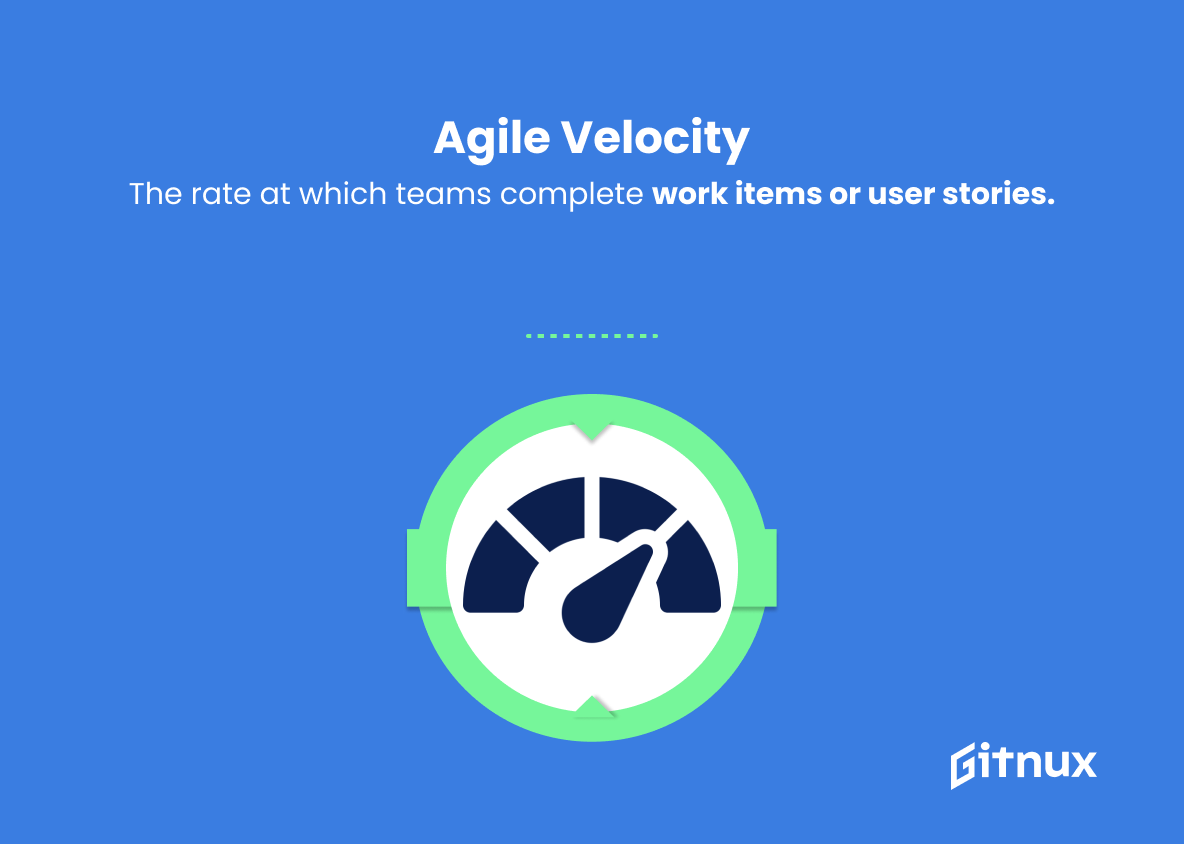
12. Agile velocity
The rate at which teams complete work items or user stories. High agile velocity indicates a team’s ability to quickly deliver features and respond to change.
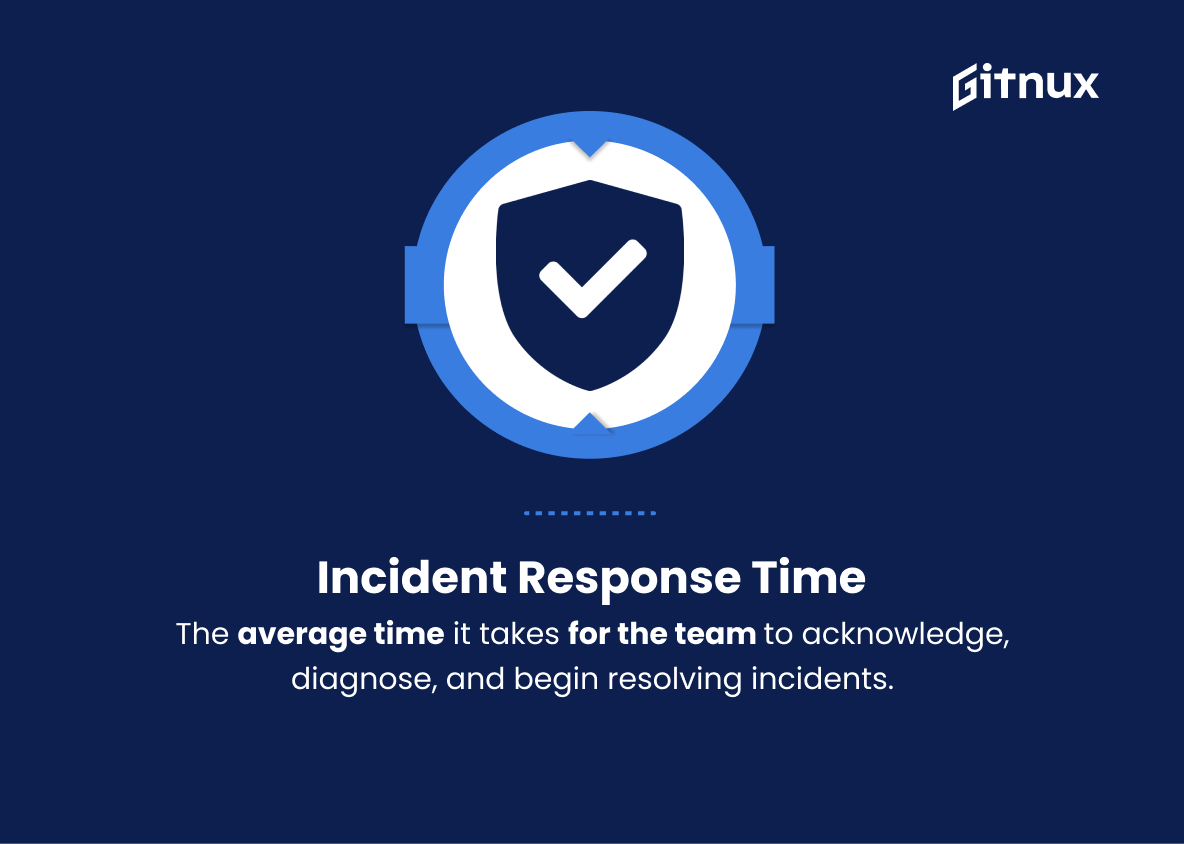
DevOps KPIs play a crucial role in understanding the efficiency and effectiveness of an organization’s software development and delivery process.13. Incident response time
The average time it takes for the team to acknowledge, diagnose, and begin resolving incidents. Faster response times indicate a more effective incident management process.
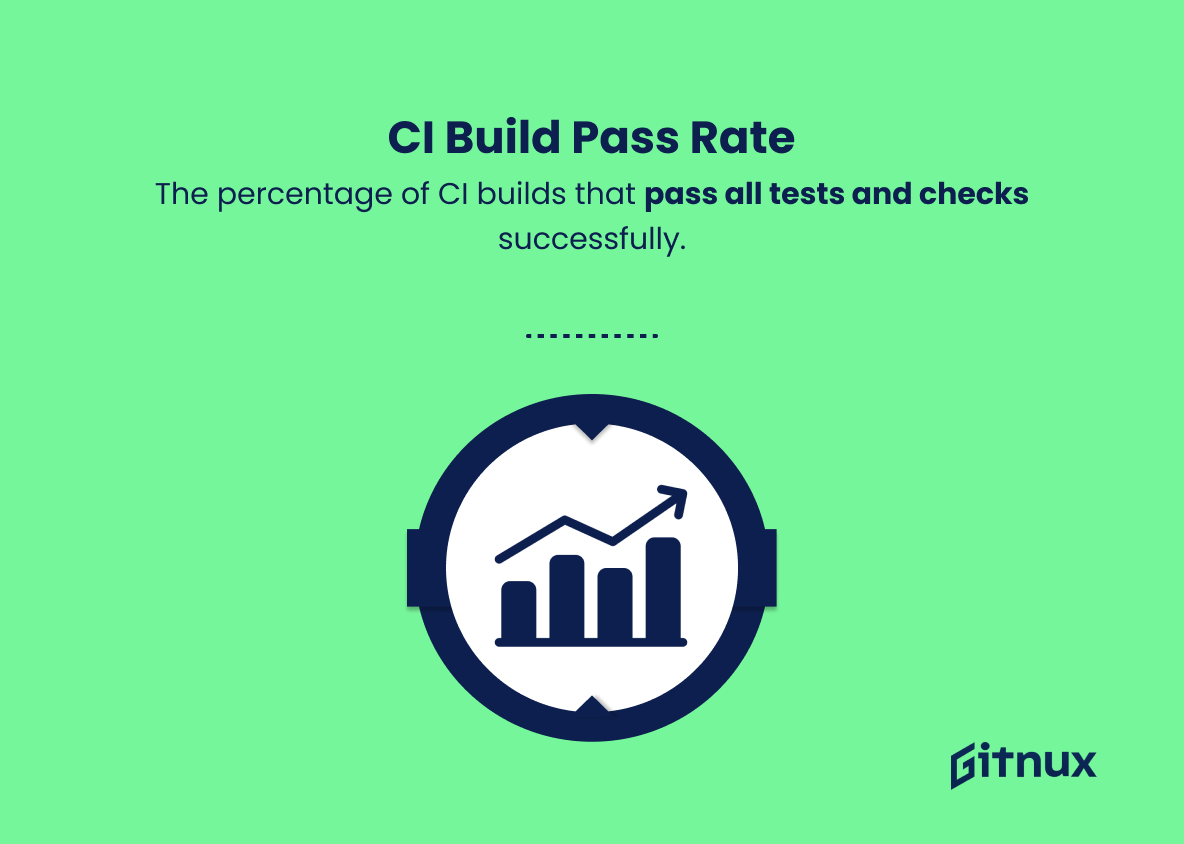
14. Continuous integration (CI) build pass rate
The percentage of CI builds that pass all tests and checks successfully. A higher pass rate demonstrates a more stable and reliable codebase.
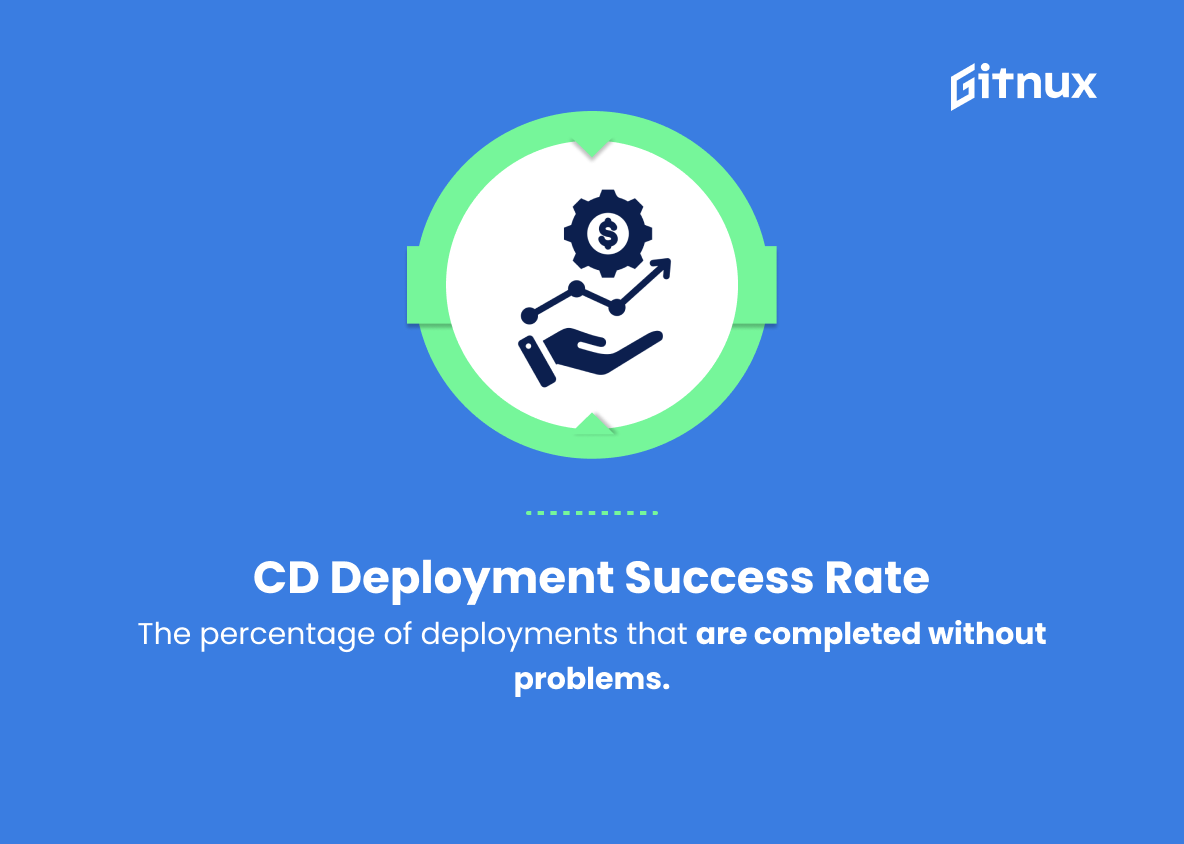
15. Continuous delivery (CD) deployment success rate
The percentage of deployments that are completed without problems. A higher success rate signifies a more reliable and efficient deployment process.
By tracking and optimizing these KPIs, organizations can improve their DevOps processes, increase software quality, and drive overall business success.
DevOps KPIs Explained
DevOps KPIs play a critical role in understanding the efficiency and effectiveness of an organization’s software development and deployment process. By measuring aspects like deployment frequency, change lead time, and change failure rate, teams can gauge the speed and stability of their DevOps pipeline. Other KPIs, such as mean time to recovery, automated test coverage, and infrastructure uptime, help ensure a resilient system by focusing on incident response times and overall reliability.
The importance of monitoring coverage, team collaboration, and environment deployment time should not be overlooked, as these KPIs contribute to proactive problem detection, stakeholder communication, and streamlined infrastructure management processes. Metrics such as defect escape rate, code review efficiency, and agile velocity provide insight into software quality and the ability of teams to respond to changing requirements.
In addition, tracking incident response time, continuous integration build pass rate, and continuous delivery deployment success rate enables organizations to continually refine their incident management and deployment processes. Ultimately, these KPIs enable organizations to make data-driven decisions, optimize their DevOps processes, and drive overall business success.
Conclusion
In summary, DevOps KPIs are critical to measuring the effectiveness, efficiency, and overall success of your organization’s DevOps processes. By continually monitoring, analyzing, and refining these metrics, you pave the way for continuous improvement and a more streamlined workflow.
Emphasize the key areas of deployment frequency, lead time, mean time to recovery, and change failure rate in your KPI tracking to ensure a robust and results-oriented approach. Remember, the ultimate goal of implementing DevOps is to foster a culture of collaboration, agility, and accountability that will ultimately lead your organization to greater innovation and customer satisfaction.
