In today’s rapidly evolving business landscape, organizations must constantly strive to enhance their performance and achieve lasting success. To accomplish this, the concept of continuous improvement plays a crucial role in steering businesses towards operational efficiency and outstanding results. Implementing effective continuous improvement metrics is a powerful way to track progress, identify opportunities, and ensure that your organization remains ahead of the curve.
This blog post will delve into the world of continuous improvement metrics, discussing their importance, types, and the best practices to follow when incorporating them into your business strategy. Stay with us as we guide you through the process of optimizing and advancing your organization by harnessing the potential of these essential performance indicators.
Continuous Improvement Metrics You Should Know
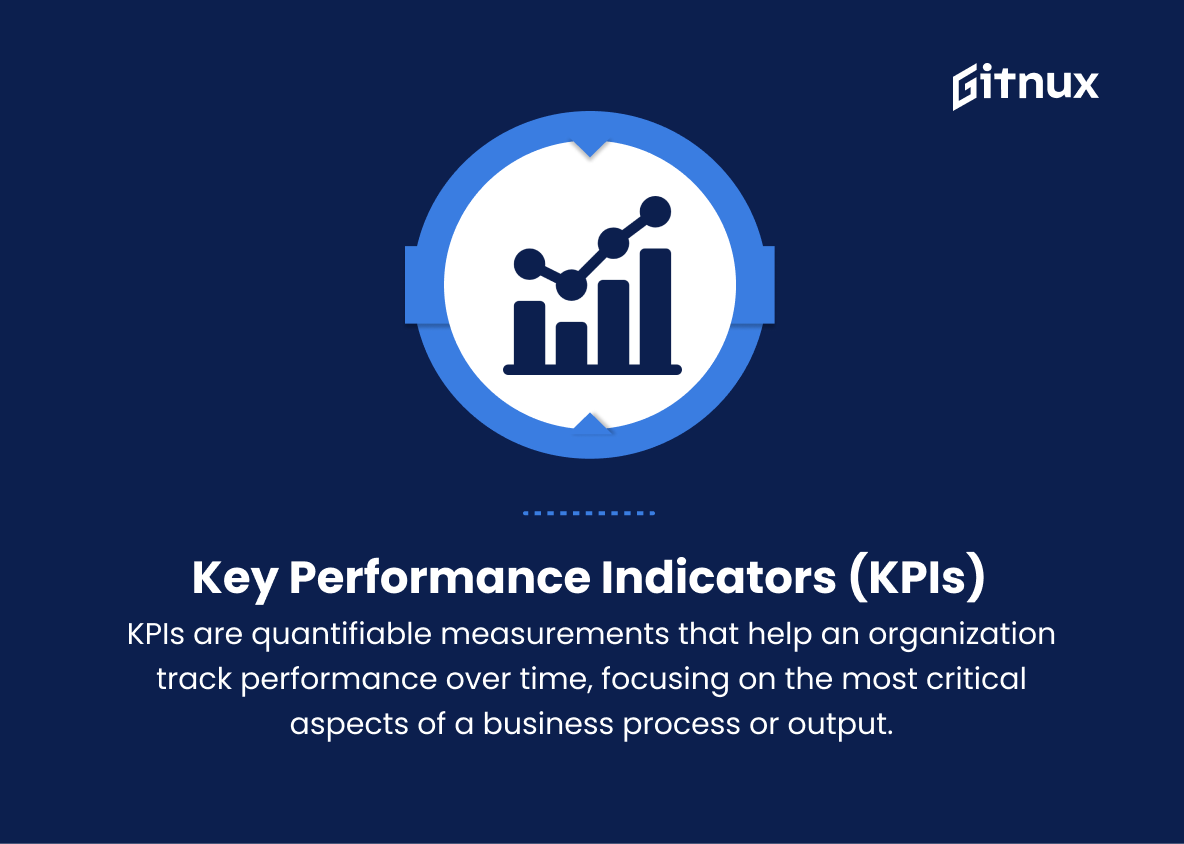
1. Key Performance Indicators (KPIs)
KPIs are quantifiable measurements that help an organization track performance over time, focusing on the most critical aspects of a business process or output. Examples include revenue per employee, customer satisfaction scores, and on-time delivery rates.
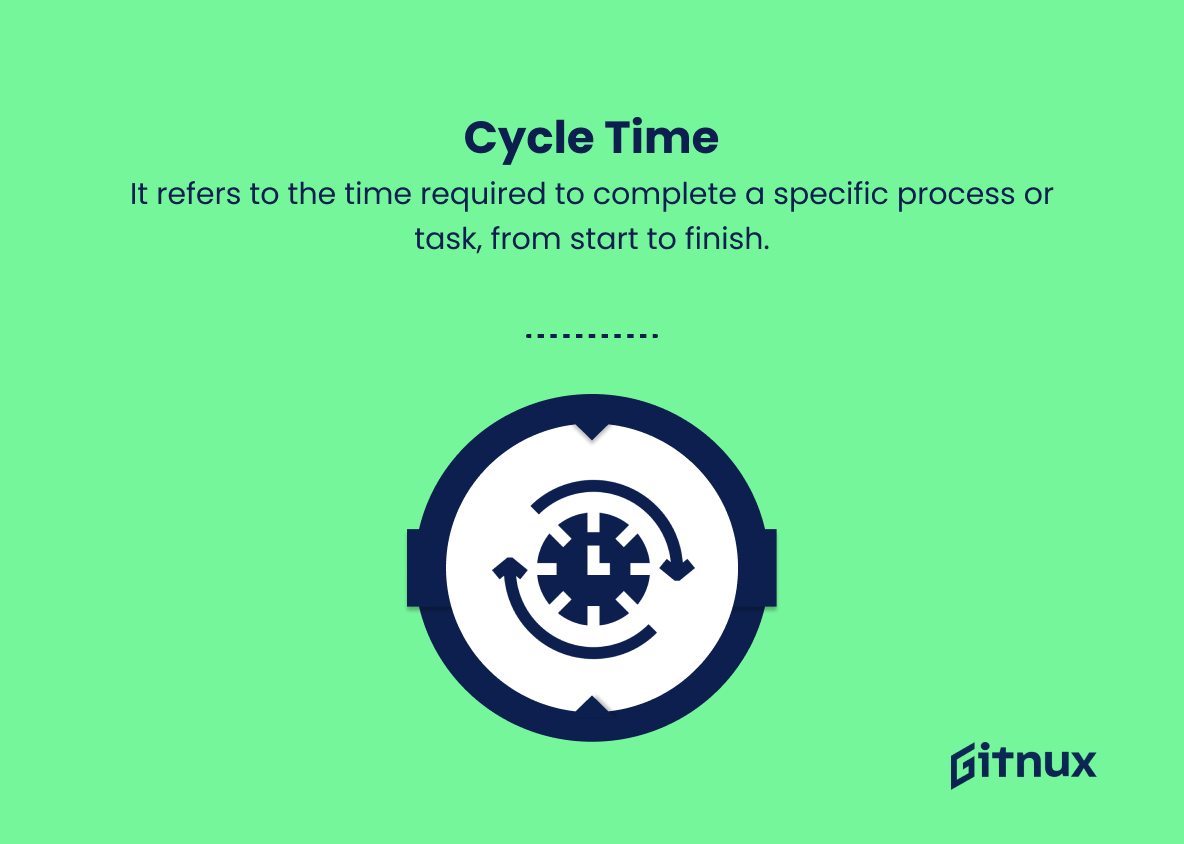
2. Cycle Time
It refers to the time required to complete a specific process or task, from start to finish. Reducing cycle time can improve efficiency, lower costs, and increase customer satisfaction.
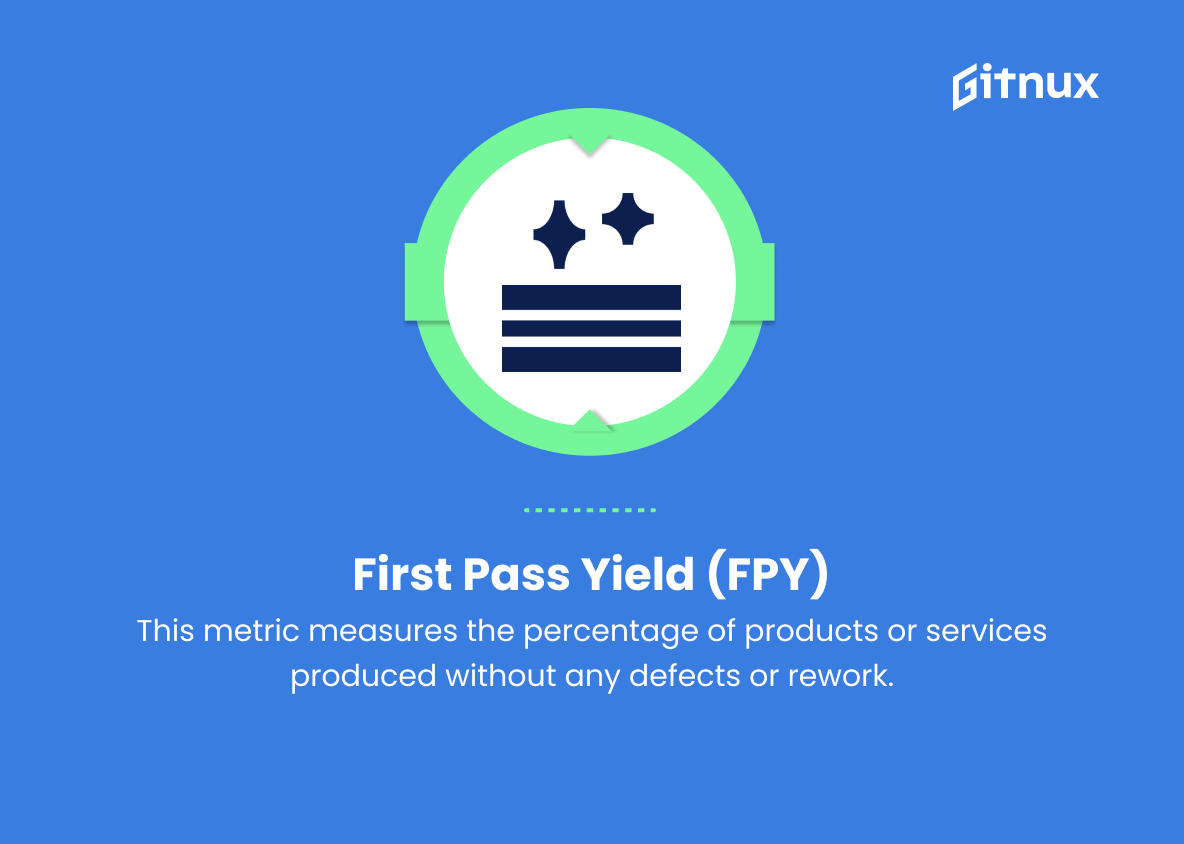
3. First Pass Yield (FPY)
This metric measures the percentage of products or services produced without any defects or rework, indicating the effectiveness of a process in producing quality outputs on the first attempt.
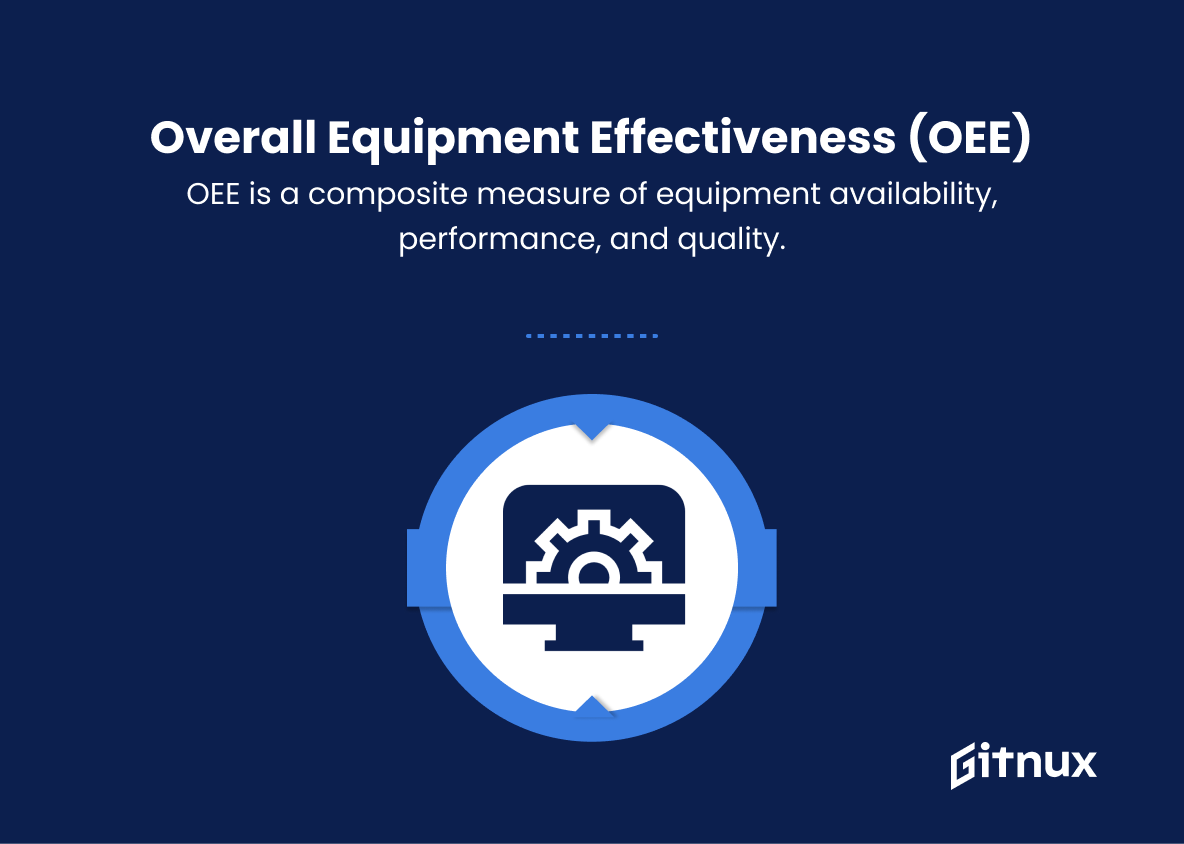
4. Overall Equipment Effectiveness (OEE)
OEE is a composite measure of equipment availability, performance, and quality. It helps identify potential areas of improvement in machine and process efficiency.
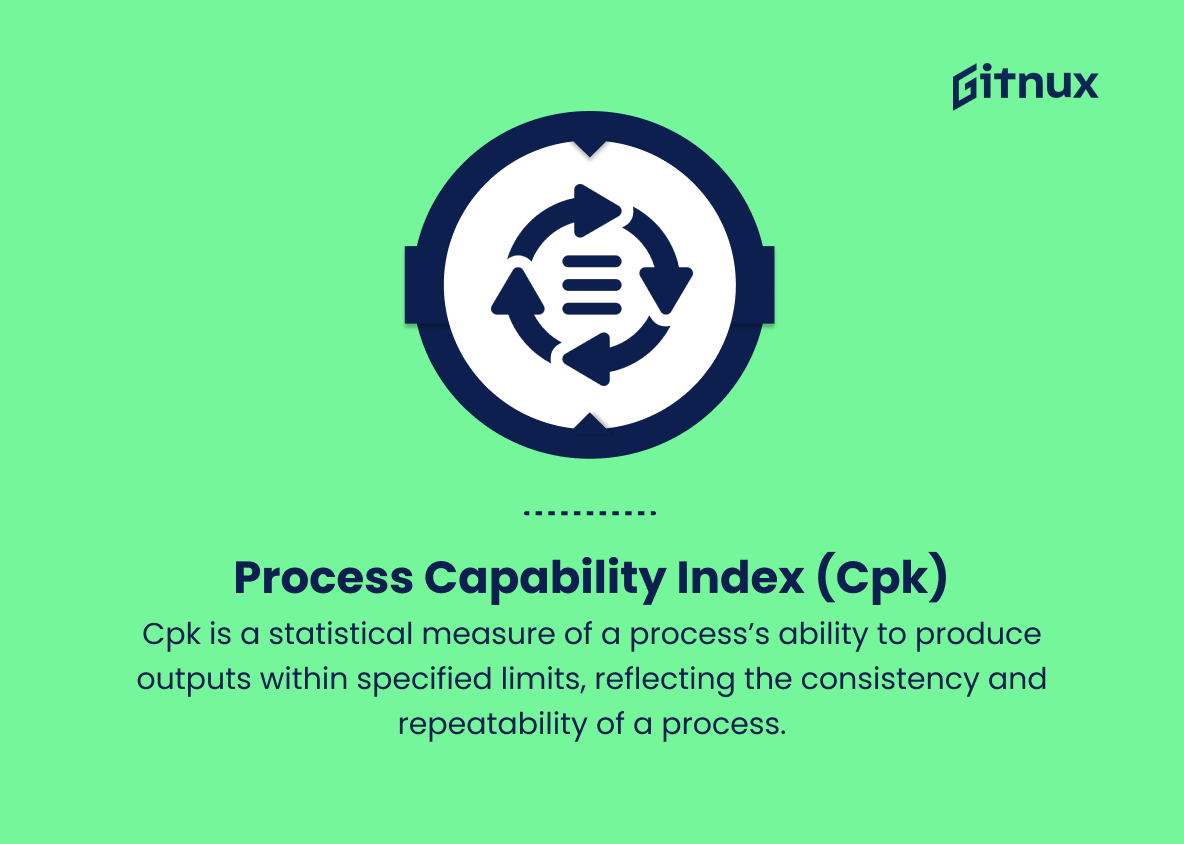
5. Process Capability Index (Cpk)
Cpk is a statistical measure of a process’s ability to produce outputs within specified limits, reflecting the consistency and repeatability of a process.
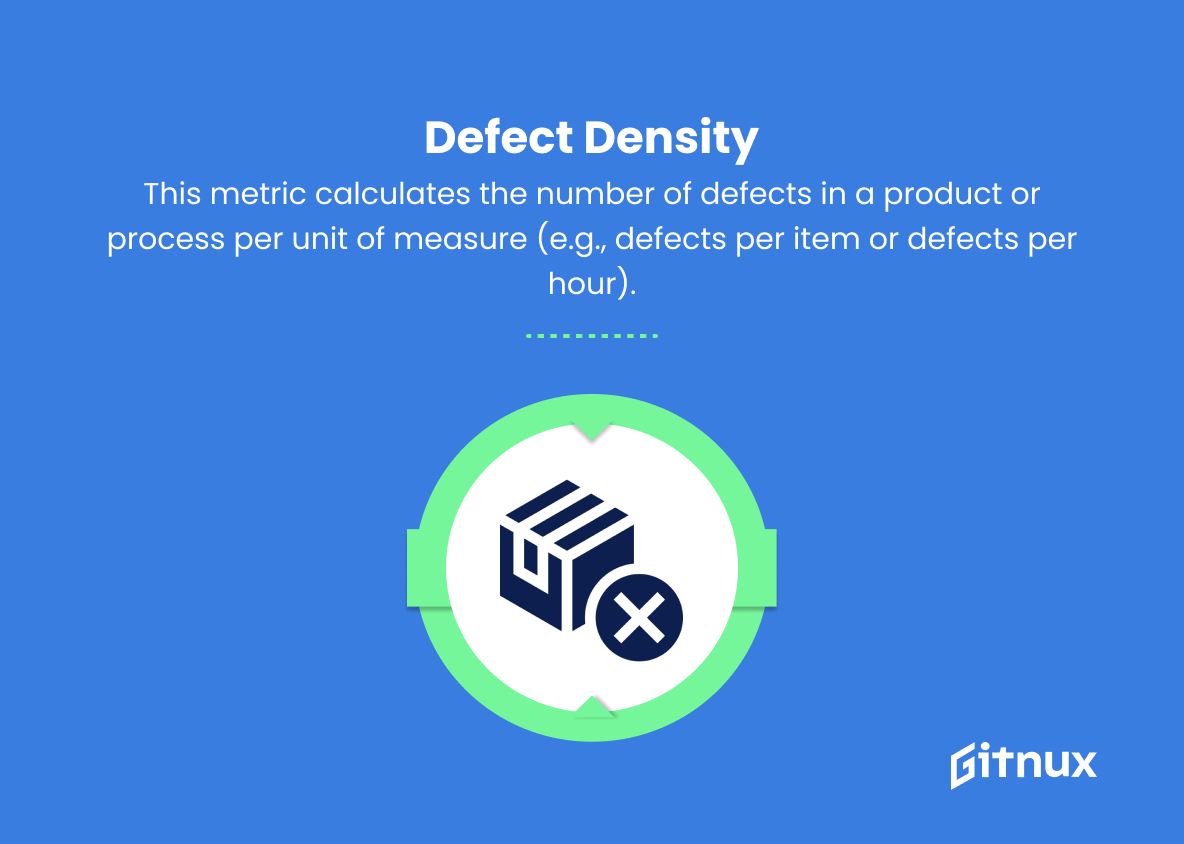
6. Defect Density
This metric calculates the number of defects in a product or process per unit of measure (e.g., defects per item or defects per hour). A lower defect density indicates improved quality.
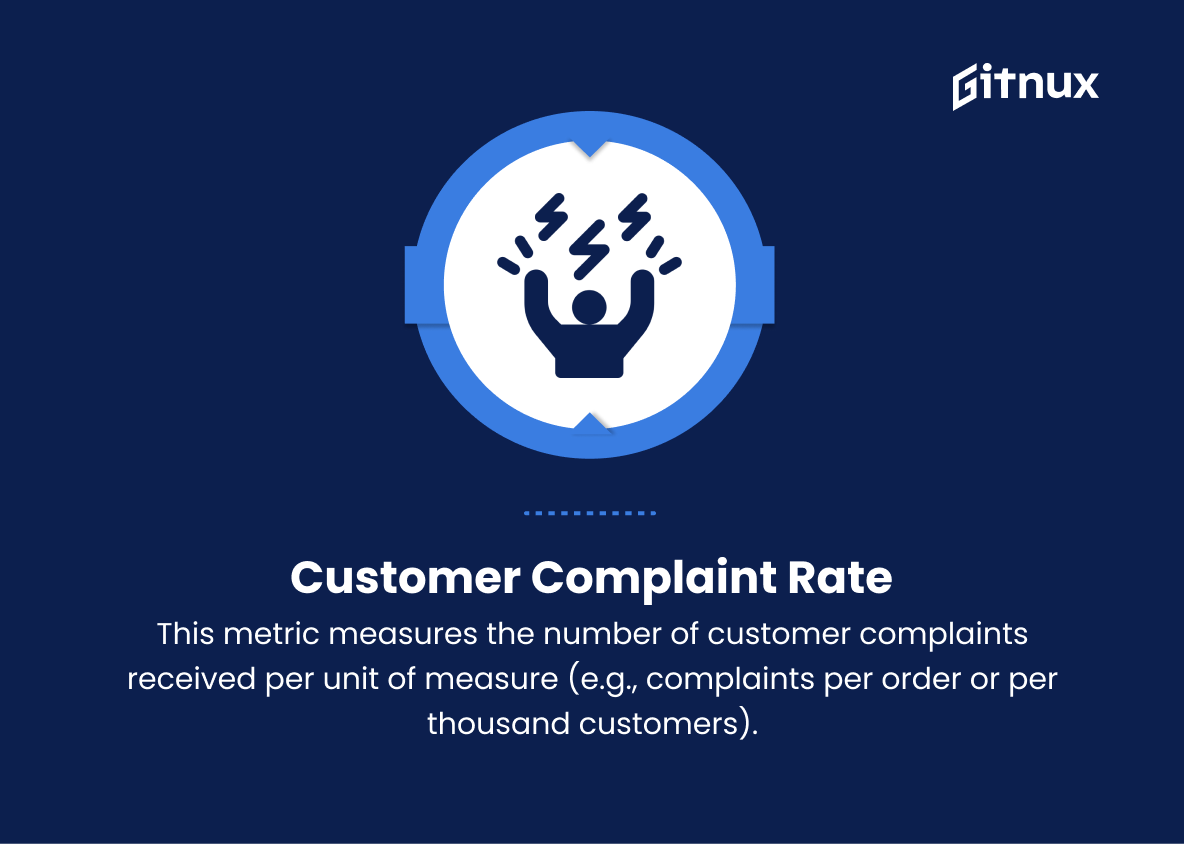
7. Customer Complaint Rate
This metric measures the number of customer complaints received per unit of measure (e.g., complaints per order or per thousand customers). Reducing this rate reflects better customer satisfaction and product or service quality.
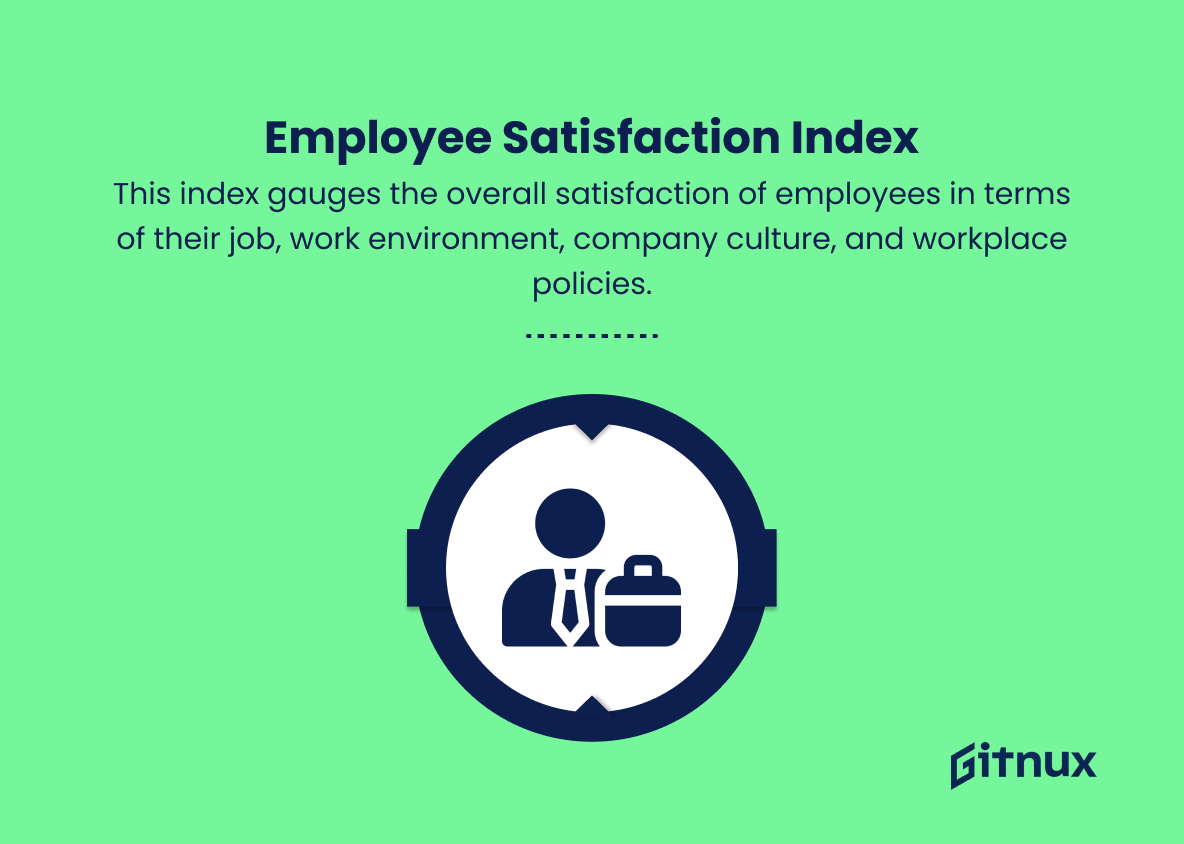
8. Employee Satisfaction Index
This index gauges the overall satisfaction of employees in terms of their job, work environment, company culture, and workplace policies. A higher score indicates better employee engagement, which can contribute to continuous improvement.
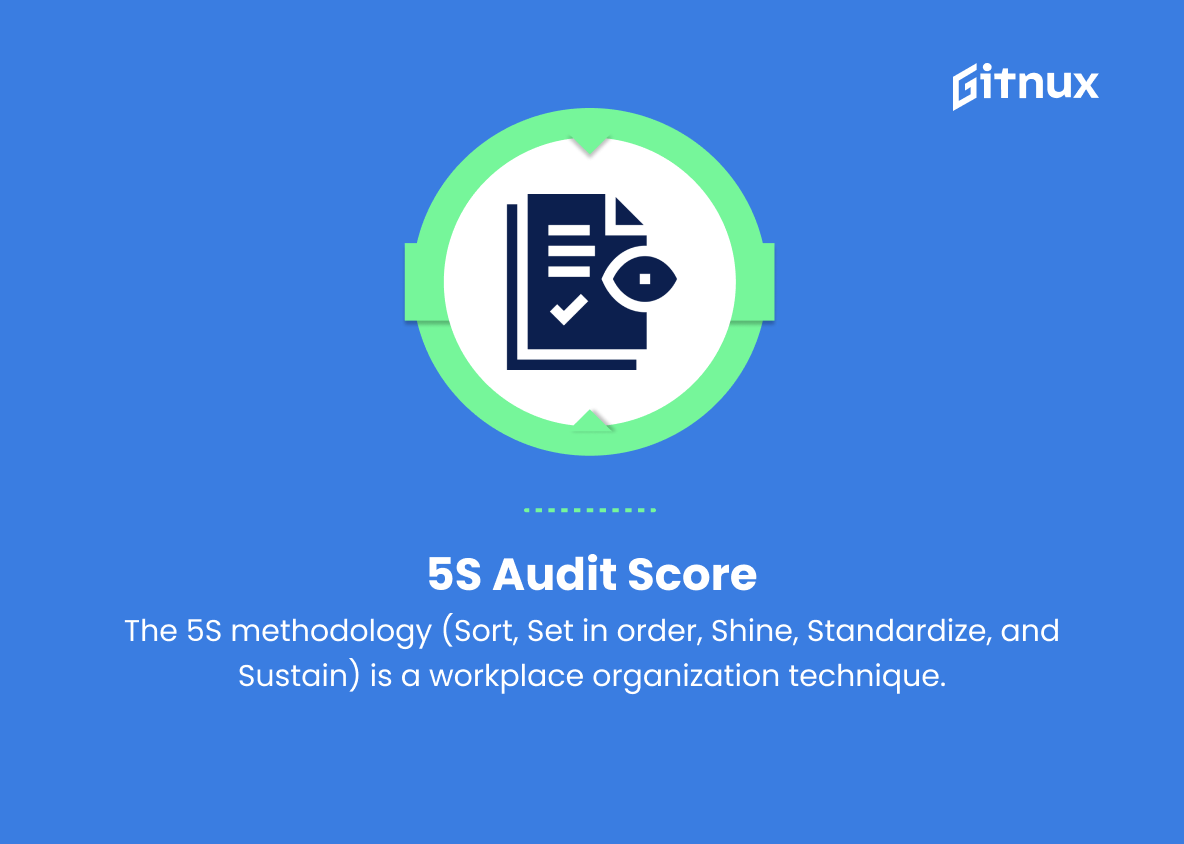
9. 5S Audit Score
The 5S methodology (Sort, Set in order, Shine, Standardize, and Sustain) is a workplace organization technique. 5S audit scores measure the effectiveness of the 5S implementation, reflecting the cleanliness, organization, and efficiency of a workspace.
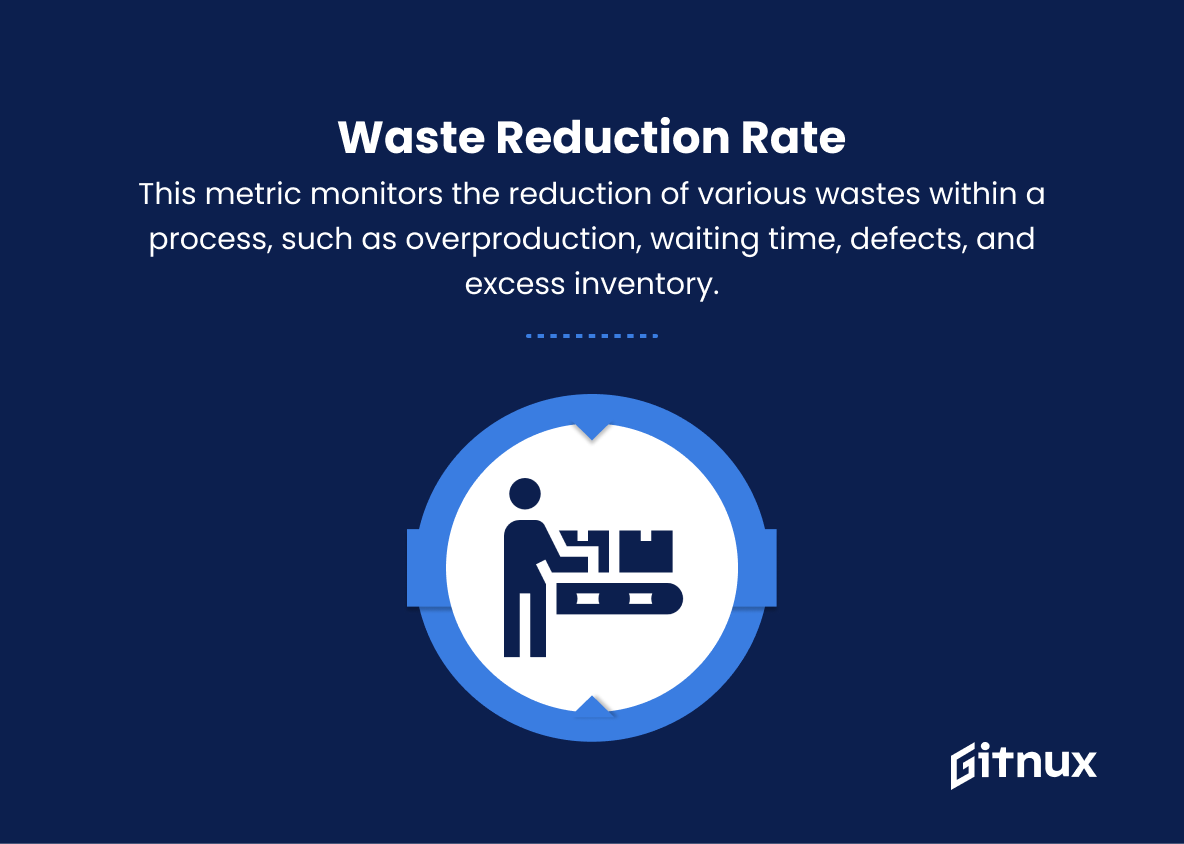
10. Waste Reduction Rate
This metric monitors the reduction of various wastes within a process, such as overproduction, waiting time, defects, and excess inventory. A higher waste reduction rate demonstrates greater efficiency and cost savings.
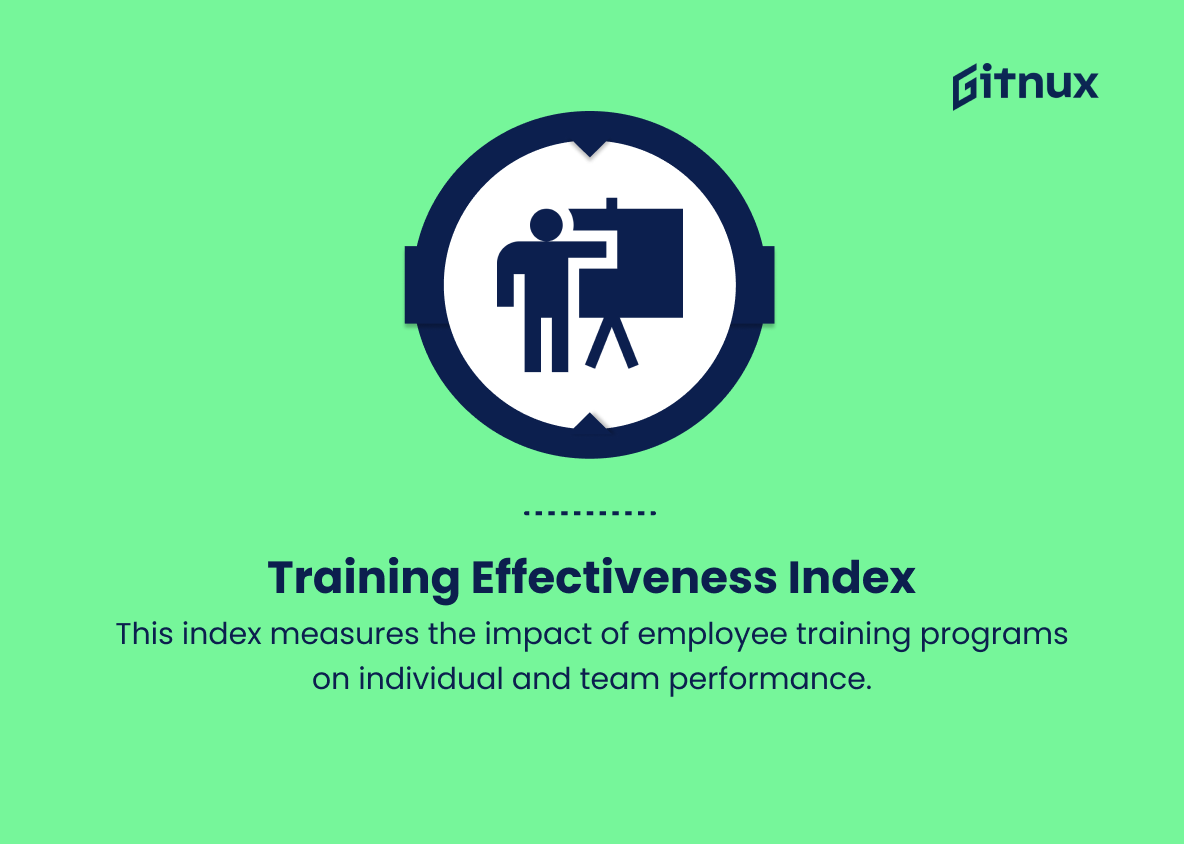
11. Training Effectiveness Index
This index measures the impact of employee training programs on individual and team performance. A higher index score indicates more effective training and better skill development.
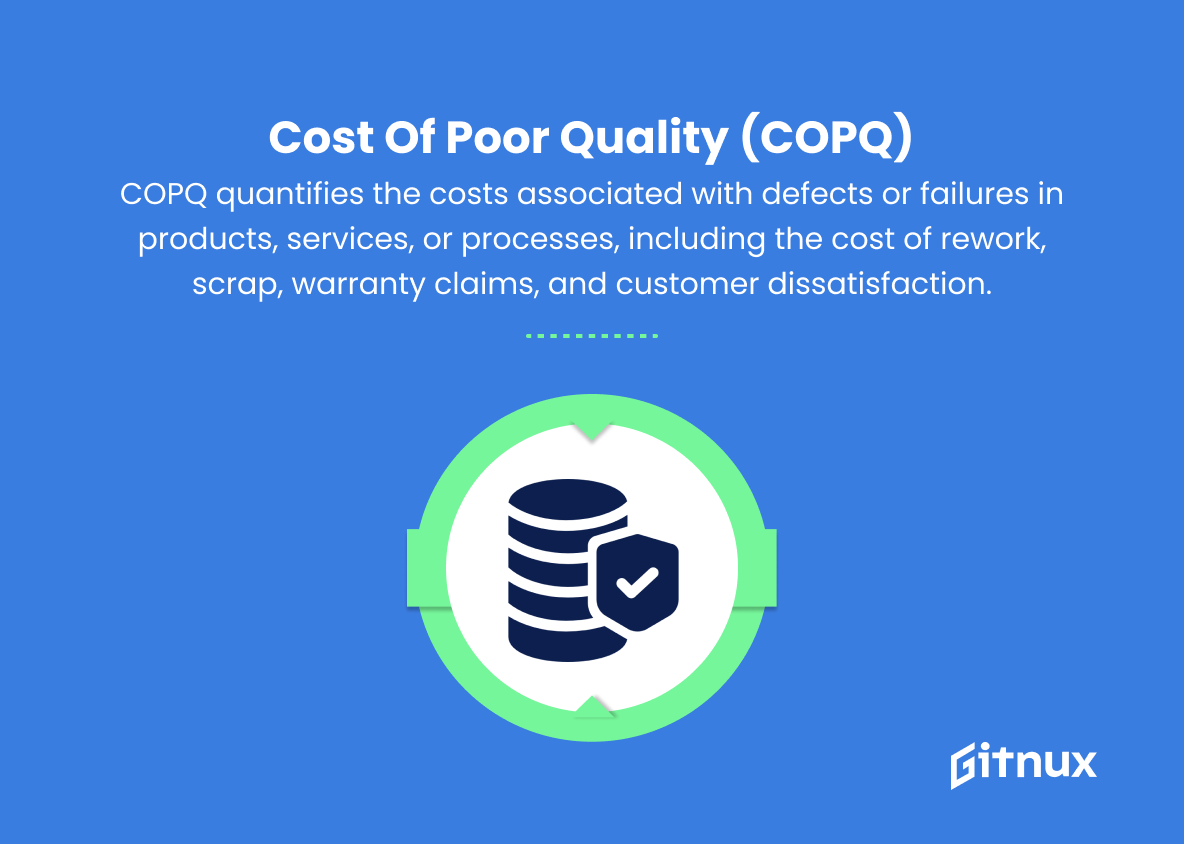
12. Cost of Poor Quality (COPQ)
COPQ quantifies the costs associated with defects or failures in products, services, or processes, including the cost of rework, scrap, warranty claims, and customer dissatisfaction. Reducing COPQ indicates an improvement in quality and cost control.
Continuous Improvement Metrics Explained
Continuous improvement metrics play a crucial role in assessing an organization’s performance, efficiency, and quality over time. By utilizing Key Performance Indicators (KPIs), organizations can focus on the most critical aspects of their business, ensuring productivity and profitability are maintained or improved. Reducing cycle time enables organizations to enhance efficiency and customer satisfaction, while First Pass Yield (FPY) measures the effectiveness of a process in producing quality outputs on the first attempt.
Monitoring Overall Equipment Effectiveness (OEE) can aid in identifying areas for improvement in machinery and processes, whereas the Process Capability Index (Cpk) reflects consistency and repeatability. Defect Density demonstrates improved quality through lower rates, and a reduced Customer Complaint Rate indicates better customer satisfaction.
By measuring Employee Satisfaction Index, organizations can focus on enhancing employee engagement, and the implementation of the 5S methodology can promote an organized and efficient workspace. Waste Reduction Rate is essential for cost savings and enhanced efficiency; Training Effectiveness Index is critical for skill development and improved team performance. Lastly, minimizing the Cost of Poor Quality (COPQ) highlights improvements in quality and more robust cost control measures.
Conclusion
In summary, continuous improvement metrics play an essential role in tracking and evaluating the success of an organization’s efforts to enhance its processes, increase efficiency, and deliver value to customers. Implementing and understanding these key performance indicators empower businesses to make data-driven decisions, optimize resource allocation, and drive meaningful change.
By focusing on quality, productivity, flexibility, and customer satisfaction, organizations can establish a culture of continuous improvement where innovation and growth are deeply ingrained. Ultimately, adopting these metrics paves the way for enhanced competitiveness and long-term success in an ever-evolving business landscape.
