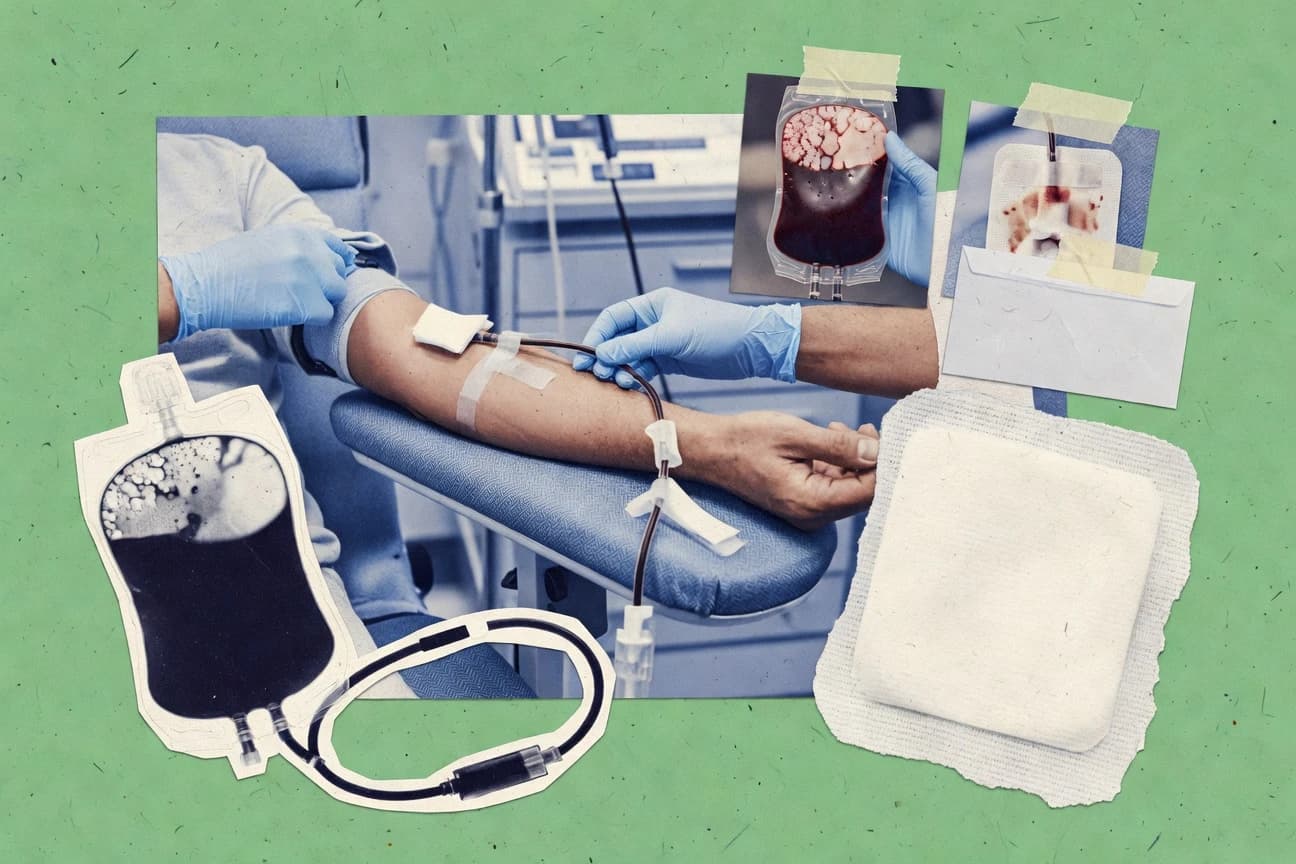

Hospitals in the US require roughly 38,000 units of blood every day. Global demand for blood grows by 10 to 15 percent each year.
Key Takeaways
- Every 2 seconds, someone in the US needs blood, requiring 38,000 units daily
- In the US, 37% of the population is eligible to donate but only 3% do so yearly
- Globally, 118.5 million blood donations were collected in 2020, with 40% from high-income countries despite them having only 16% of the world's population
- Globally, 99% of unsafe blood occurs in low-income countries due to supply gaps
- Globally, blood donation campaigns increase supply by 15-25%
- One unit of blood can save up to 3 lives when separated into components
Blood donations remain vital, but many communities still fall short of the levels they need.
Related reading
01 · Category
Blood Supply and Demand30 stats
01
Every 2 seconds, someone in the US needs blood, requiring 38,000 units daily
02
US hospitals use 5,500 units of red blood cells daily on average
03
Globally, demand for blood grows 10-15% yearly due to aging populations and surgeries
04
In UK, winter demand surges 20% for O negative blood
05
US platelet supply has shelf life of 5 days, needing 4,500 daily donations
06
Canada faces summer shortages with 20% drop in donations
07
Australia requires 10,000 donations weekly to meet demand
08
India has 1 million unit shortage annually
09
In US, Type O blood comprises 39% supply but 44% demand
10
Global plasma demand for fractionation is 50 million liters/year
11
UK uses 1.3 million red cell units yearly
12
Sickle cell patients require 100-170 units/year each, driving demand
13
Trauma cases use 20% of blood supply globally
14
In France, demand for plasma derivatives rose 5% in 2022
15
Germany shortages occur in 15% of hospitals quarterly
16
South Africa has chronic shortages of 20% for rare types
17
China demand exceeds supply by 10% for platelets
18
US cancer patients need 40% of platelets supplied
19
Australia neonatal demand uses 5% of red cells
20
Globally, elective surgeries consume 40% of blood resources
21
UK O negative demand met by 7% donor pool
22
Canada transplants require 1,500 units/year
23
In Brazil, maternal hemorrhage demands 25% of blood
24
Italy faces 5-10% summer shortages
25
US inventory drops 25% during holidays
26
Global need for cryoprecipitate is rising 8% yearly for hemophilia
27
In Australia, platelets demand up 15% post-COVID
28
UK heart surgery uses average 4 units per case
29
India trauma accounts for 30% demand
30
US childbirth complications need 500,000 units yearly
Interpretation
Blood Supply and Demand Interpretation
The world's constant need for blood is a grimly efficient clockwork, where every tick marks a new patient depending on a supply that is perpetually racing against time, shelf life, and our own collective forgetfulness.
02 · Category
Donor Demographics30 stats
01
In the US, 37% of the population is eligible to donate but only 3% do so yearly
02
US females comprise 52% of donors, donating 45% of total units due to lower volume per donation
03
In America, 8% of donors are 16-18 years old, the fastest growing group
04
African Americans make up 7% of US blood donors despite 13% population share
05
US donors aged 19-24 represent 20% of first-time donors
06
Women aged 45-64 are 25% of repeat donors in the US
07
Hispanic/Latino donors are 9% in US, underrepresenting 19% population
08
In UK, 25-44 age group donates 40% of blood
09
UK females are 51% of donors
10
Asian ethnic group in UK is 5% of donors vs 9% population
11
In Canada, 45% of donors are aged 40-59
12
Canadian women donate 48% of units
13
Youth 17-24 make up 15% of new Canadian donors
14
In Australia, males 25-44 are 30% of donors
15
Australian females 51%, but men donate more platelets
16
Indigenous Australians are 1.5% of donors vs 3.2% population
17
In India, 70% of donors are replacements, mostly males aged 18-35
18
Brazilian donors are 55% male, average age 32 years
19
In France, 60% of donors are repeat, aged 30-50 predominantly
20
German donors average age 42, with 53% female
21
Italian donors 52% female, 28% under 30
22
In South Africa, 65% donors male, urban dwellers mainly
23
Chinese donors 58% male, rising youth participation to 25%
24
In US, first-time donors are 40%, mostly young adults 18-24
25
UK Black donors 3% vs 4% population
26
Globally, repeat donors (>3/year) are only 1.5% but provide 20% supply
27
In Australia, 20% donors over 60
28
US Asian donors 4% vs 6% population
29
Canada Indigenous donors 1% vs 5% population
30
In US, whole blood donors average 2.2 donations/year
Interpretation
Donor Demographics Interpretation
The lifeblood of our communities depends on a surprisingly narrow stream of habitual altruists, while vast reservoirs of potential remain untapped across every age, gender, and ethnicity, revealing a universal story of generous minorities shouldering a critical majority of the burden.
03 · Category
Global Statistics30 stats
01
Globally, 118.5 million blood donations were collected in 2020, with 40% from high-income countries despite them having only 16% of the world's population
02
In low-income countries, only 31% of blood donations come from voluntary unpaid donors compared to 100% in 62 high-income countries
03
The World Health Organization estimates that blood transfusions save over 118 million lives annually through donations worldwide
04
In 2018, Europe collected 31.6 million blood donations, averaging 38 donations per 1,000 people
05
Africa collects only 5.2 million blood units annually, which is 0.6% of the global total despite 17% of the world population
06
Southeast Asia accounts for 13% of global blood donations with 15.4 million units collected yearly
07
High-income countries donate 45% of the world's blood supply but represent just 16% of global population
08
Globally, women account for 52% of blood donors in voluntary systems but donate less frequently due to deferrals
09
In 2022, over 13 million units of blood were discarded worldwide due to expiry, representing 10-20% waste in some regions
10
The global blood market was valued at USD 35.3 billion in 2023, projected to reach USD 51.7 billion by 2030
11
In the United States, 6.8 million people donated blood in 2022, yielding 13.6 million units
12
Canada collected 1.7 million blood donations in 2022-2023 from 543,000 donors
13
In Australia, 1.2 million donations were made in 2022, sufficient for 500,000 transfusions
14
UK collected 1.6 million donations in 2022/23, meeting 100% of hospital demand
15
India collects about 12 million units annually against a need of 14.6 million
16
Brazil performed 3.4 million donations in 2022, with a rate of 16.5 per 1,000 inhabitants
17
Japan has a donation rate of 27.7 per 1,000 people, collecting 5.2 million units yearly
18
South Africa collects 0.7 million units per year, far below the WHO recommended 1% of population
19
In China, 15 million units were collected in 2022, up 5% from previous year
20
Germany collects 6.5 million donations annually from 5.5 million donors
21
France has 1.7 million regular donors providing 2.8 million donations yearly
22
Italy collects 1.8 million units per year with voluntary unpaid system covering 100%
23
Russia collects 1.4 million donations annually
24
Mexico needs 1.5 million units but collects only 1.1 million
25
Egypt collects 1.2 million units yearly from family replacement donors mainly
26
Nigeria has a donation rate of 5 per 1,000, collecting 0.5 million units
27
Pakistan collects 1.5 million units against 7.8 million needed
28
In 2023, global plasma collection reached 55 million kg, led by US at 70%
29
WHO reports 1.53 million pediatric transfusions globally require safe blood annually
30
Low- and middle-income countries perform 75% of transfusions but have weaker systems
Interpretation
Global Statistics Interpretation
The statistics reveal a starkly unequal global landscape where high-income countries, with a mere 16% of the world's population, act as the generous but overrepresented blood bank of the world, while low-income nations, home to most people who need transfusions, are left scraping by with underfunded and insufficient systems.
More related reading
04 · Category
Safety and Testing27 stats
01
Globally, 99% of unsafe blood occurs in low-income countries due to supply gaps
02
All US donations screened for 9 infectious diseases including HIV, HBV, HCV
03
WHO recommends nucleic acid testing (NAT) reducing HIV window to 5-10 days, adopted in 70% high-income countries
04
UK post-donation bacterial testing for platelets reduced contamination to 1:10,000
05
In Canada, 99.99% of donations test negative for HIV
06
Australia rapid HIV tests detect 99.9% cases within 3 months
07
Global adverse reactions occur in 0.2-1% of transfusions, mostly non-serious
08
US hemovigilance reports 1 fatality per 100,000 units transfused
09
All blood screened for syphilis, risk reduced to 1:1 million
10
In Europe, bacterial contamination in platelets <1:2,500 after culture methods
11
India NAT testing covers 70% donations, reducing TT-HCV by 90%
12
Brazilian universal HIV NAT since 2009, residual risk 1:5 million
13
France pathogen reduction technology (PRT) for platelets in 50% centers
14
Germany screens for HEV, reducing risk to 1:10,000
15
South Africa HIV prevalence in donors 0.4%, down from 2% via counseling
16
China HBV occult infection testing detects 1:1,000 cases
17
US lookback for HIV+ donors notifies 1,500 recipients yearly
18
UK transfusion-related acute lung injury (TRALI) incidence 1:5,000
19
Australia IgA deficiency screening prevents anaphylaxis in 1:500 donors
20
Global iron deficiency affects 40% female donors after 3+ donations/year
21
Canada West Nile Virus NAT seasonal, zero transmissions since 2005
22
Italy CMV seroprevalence 60% in donors, leukoreduction standard
23
US variant Creutzfeldt-Jakob disease risk <1:10 million via donor deferrals
24
WHO bacterial vigilance shows culture-negative platelets safer by 50%
25
In Brazil, dengue deferral prevents 99% arbovirus transmissions
26
UK ABO incompatibility errors <1:100,000 due to electronic verification
27
Global deferral for malaria affects 1-2% donors in endemic areas
Interpretation
Safety and Testing Interpretation
The statistics reveal a stark global inequality where high-income nations have turned blood donation into a marvel of medical engineering, meticulously eliminating risks down to the decimal point, while low-income countries still struggle with the fundamental safety of their supply, proving that the greatest threat to a patient isn't in their veins but in the vast gaps between healthcare systems.
05 · Category
Trends and Future Projections28 stats
01
Globally, blood donation campaigns increase supply by 15-25%
02
US donations declined 20% post-COVID due to fear, recovering 10% by 2023
03
Mobile drives account for 70% of collections in low-income countries, rising
04
Apheresis donations up 30% globally for plasma/platelets since 2015
05
UK app-based appointments increased first-time donors 25%
06
Canada virtual eligibility quizzes boosted deferral compliance 40%
07
Australia same-day platelets doubled since 2020
08
India digital registries aim to cover 100% by 2025
09
US gamification in apps raised youth donations 15%
10
Global female donor participation projected to rise 10% by 2030 with education
11
Europe drone deliveries for rural areas piloted, reducing time 50%
12
Brazil school campaigns increased teen donors 35%
13
France PRT adoption to 100% by 2025 for pathogen safety
14
Germany AI predicts shortages with 90% accuracy
15
South Africa workplace drives up 20% post-pandemic
16
China national app registered 50 million potential donors 2023
17
US text reminders increase return rates 18%
18
UK ethnic minority recruitment up 12% via targeted ads
19
Australia home collection kits for plasma trialed
20
Global synthetic blood research funded USD 1B, viable by 2030
21
Canada double-red cell collections up 25%
22
Italy voluntary donations reached 100% in 2022, sustained
23
US post-2023 shortage, incentives debated for donors
24
WHO Global Database on Blood Safety updated annually, 180 countries reporting
25
Europe plasma self-sufficiency goal 100% by 2025, currently 68%
26
India aims 2% population donation rate by 2030 from 1%
27
Brazil Hemovigilance network expanded to 100% states
28
Global lab-grown blood trials phase 2, reducing donor need 20%
Interpretation
Trends and Future Projections Interpretation
This torrent of global statistics paints a clear portrait: humanity's drive for innovation is winning the strategic battle to secure its own lifeblood, proving that while altruism provides the noble spark, it is clever logistics, smart technology, and relentless pragmatism that will keep the vital channels flowing.
06 · Category
Usage and Impact29 stats
01
One unit of blood can save up to 3 lives when separated into components
02
Blood transfusions prevent 1.5 million maternal deaths yearly worldwide
03
In US, 70% of blood used for cancer and blood disorder patients
04
Trauma patients receiving massive transfusion have 50% higher survival with balanced ratios
05
UK sickle cell disease patients receive 8,000 units monthly
06
Plasma-derived therapies treat 300 rare diseases affecting 1 in 2,000 people
07
In Canada, 50% of platelets go to cancer chemotherapy patients
08
Australia surgeries use 55% of red blood cells
09
India thalassemia patients need 2 million units yearly
10
US heart bypass surgeries average 3-5 units per procedure
11
Globally, anemia affects 1.92 billion, many treated via transfusion
12
Brazil obstetrics accounts for 15% transfusion demand
13
France hemophilia A patients use 70 IU/kg factor VIII weekly
14
Germany orthopedics consumes 20% blood supply
15
South Africa HIV patients receive 30% of platelets for opportunistic infections
16
China liver transplants use 20-40 units average
17
US premature infants receive 3-5 transfusions lifetime
18
UK burns patients need 1 unit/% body surface area
19
Regular donation reduces donor heart disease risk by 30-50%
20
Australia Jehovah's Witnesses transfusions alternative reduced mortality 20%
21
Global pediatric surgery transfusion rates 10-20%
22
In Italy, oncology uses 25% red cells
23
Patient Blood Management reduces usage by 20-40% in hospitals
24
US car crash victims use 25% of annual supply
25
Canada stem cell transplants need 10-20 units support
26
One platelet donation equals 6-8 whole blood for chemo patients
27
In Brazil, dengue hemorrhagic fever cases drove 40% demand spike 2023
28
UK elective hip replacements average 1.5 units
29
Plasma immunoglobulins treat 120,000 US patients yearly for immunodeficiency
Interpretation
Usage and Impact Interpretation
From cardiac surgeries to chemotherapy, from car crashes to childbirth, the startling truth is that a single human decision to donate blood creates an exponential cascade of life-saving potential, stitching together the most vulnerable moments of our shared existence into a tapestry of survival.
Reference
Cite This Report
This report is designed to be cited. We maintain stable URLs and versioned verification dates. Copy the format appropriate for your publication below.
APA
Elena Vasquez. (2026, February 13). Blood Donation Statistics. Gitnux. https://gitnux.org/blood-donation-statistics
MLA
Elena Vasquez. "Blood Donation Statistics." Gitnux, 13 Feb 2026, https://gitnux.org/blood-donation-statistics.
Chicago
Elena Vasquez. 2026. "Blood Donation Statistics." Gitnux. https://gitnux.org/blood-donation-statistics.
Sources & references
70 datasets cited across this report · attribution is report-level