
Veterans have made significant contributions to the United States, and their service should be honored. Unfortunately, veterans face unique challenges when it comes to finding employment after leaving active duty military service. This blog post will explore some of the statistics related to veterans in the workforce, including unemployment rates for different age groups and genders as well as veteran-owned businesses and wages earned by those who served our country. We’ll also look at underemployment among veterans and homelessness within this population group. By understanding these numbers better, we can work together towards creating a more equitable job market for all Americans – especially those who have sacrificed so much on behalf of our nation’s security.
This statistic is a stark reminder of the reality that many veterans face when transitioning back into civilian life. It highlights the need for more resources and support for veterans in the workforce, as well as the need for employers to be more open to hiring veterans. It is a call to action for all of us to do our part in helping veterans find meaningful employment.
In 2020, the unemployment rate for veterans was 6.5%.
This statistic is a telling indication of the state of veterans in the workforce. It shows that, despite the many resources available to veterans, they are still facing a higher rate of unemployment than the general population. This statistic is a reminder that there is still much work to be done in order to ensure that veterans are able to find meaningful employment.
Veterans In The Workforce Statistics Overview
In 2019, 47.0% of all veterans were age 65 or older.
This statistic is a stark reminder of the aging veteran population, and the need to ensure that veterans of all ages have access to the resources they need to succeed in the workforce. It highlights the importance of providing veterans with the necessary support and training to help them transition into civilian life and find meaningful employment.
In 2020, about 18.3% of all veterans were women.
This statistic is a powerful reminder of the growing presence of female veterans in the workforce. It highlights the importance of recognizing and supporting the unique needs of female veterans, who often face unique challenges in the workplace. By understanding the changing demographics of the veteran population, employers can better tailor their recruitment and retention strategies to ensure that all veterans have the opportunity to succeed.
In 2020, the employment-population ratio for veterans ages 18 to 24 was 52.6%, compared to 57.7% for nonveterans in the same age group.
This statistic is a powerful indicator of the impact of military service on the employment prospects of young veterans. It highlights the fact that veterans in this age group are facing a greater challenge in finding employment than their non-veteran peers. This is an important point to consider when discussing the overall employment situation for veterans in the workforce.
In 2020, about 298,000 of the 7.7 million employed veterans worked in management, professional, and related occupations.
This statistic is a testament to the fact that veterans are highly capable of succeeding in management, professional, and related occupations. It shows that veterans are not only capable of finding employment, but also of thriving in the workforce. This statistic is a powerful reminder that veterans are an invaluable asset to the workforce and should be given the opportunity to succeed.
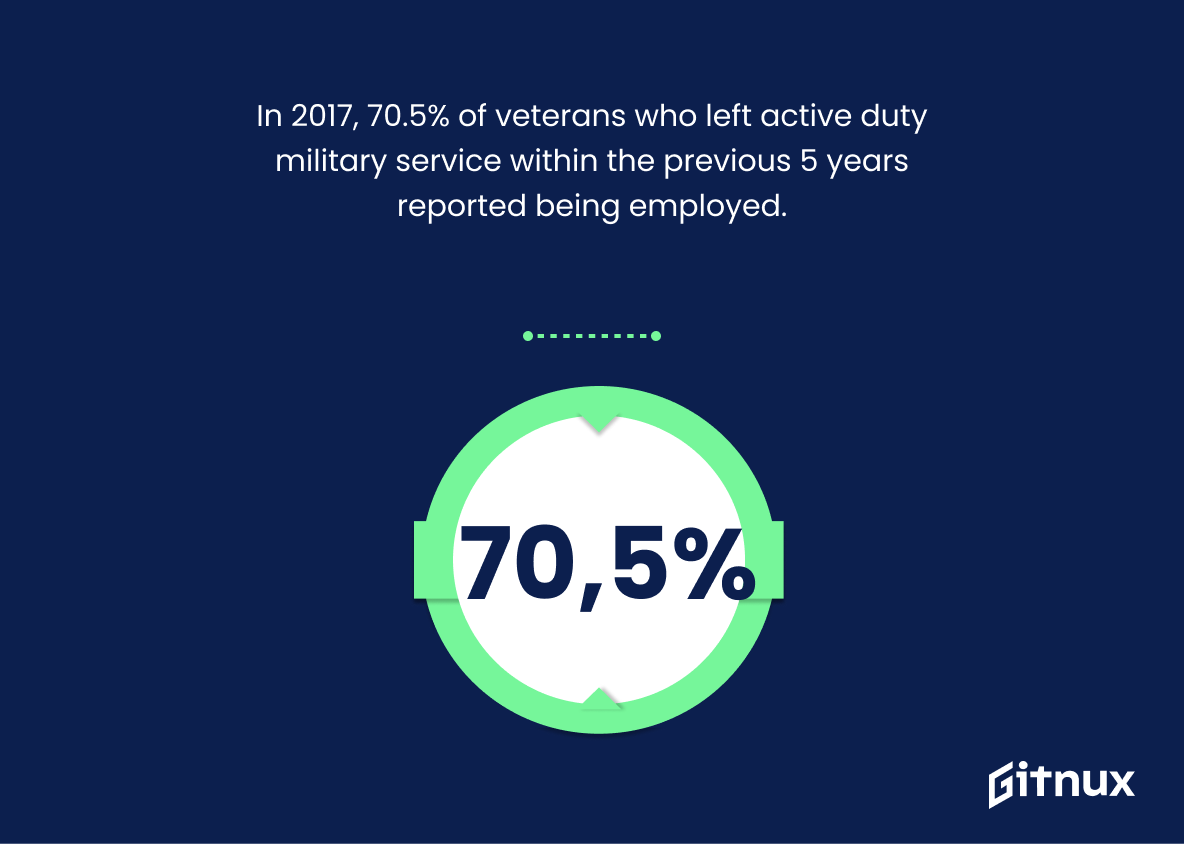
In 2017, 70.5% of veterans who left active duty military service within the previous 5 years reported being employed.
This statistic is a testament to the hard work and dedication of veterans in the workforce. It shows that veterans are not only capable of finding employment, but that they are also successful in doing so. This statistic is a powerful reminder of the value that veterans bring to the workforce and the importance of providing them with the resources and support they need to succeed.
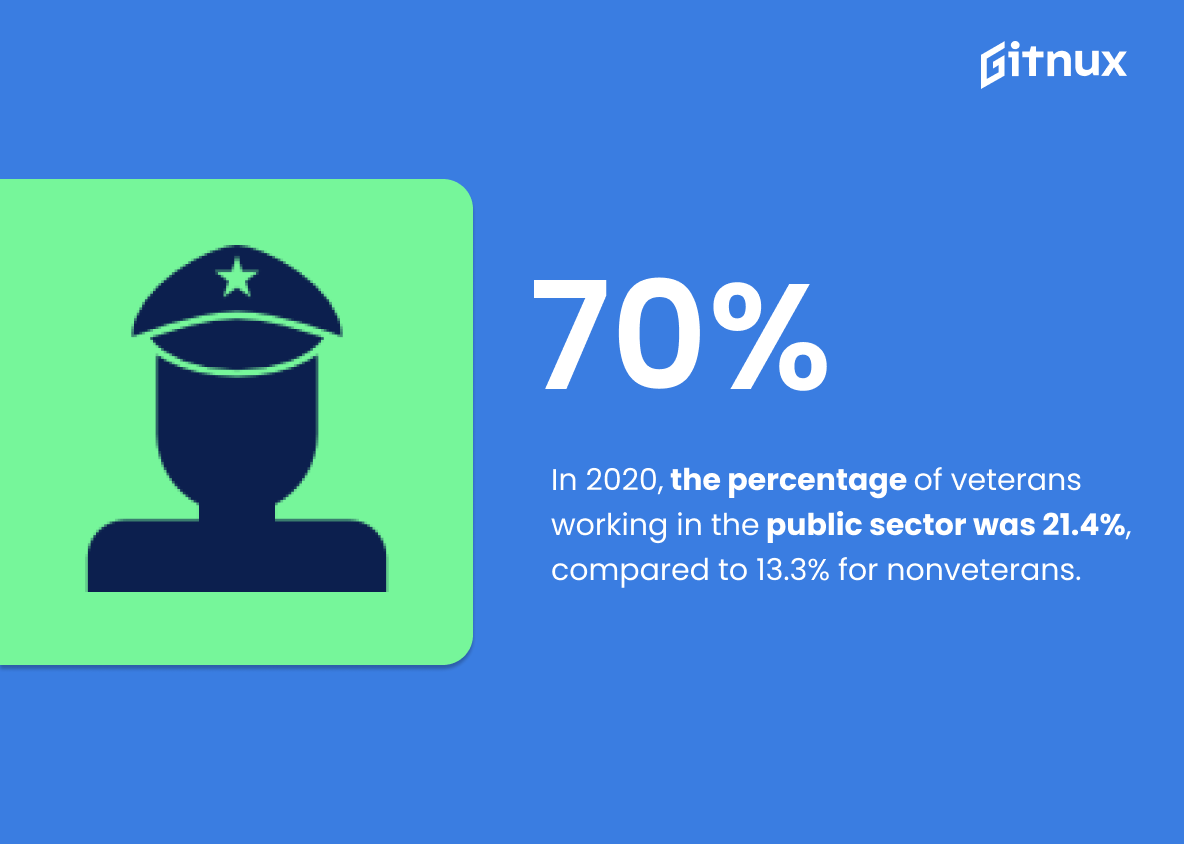
In 2020, the percentage of veterans working in the public sector was 21.4%, compared to 13.3% for nonveterans.
This statistic is a powerful indicator of the impact veterans have in the public sector. It demonstrates that veterans are more likely to be employed in the public sector than nonveterans, and that they are making a significant contribution to the workforce. This statistic is important to consider when discussing veterans in the workforce, as it highlights the value veterans bring to the public sector.
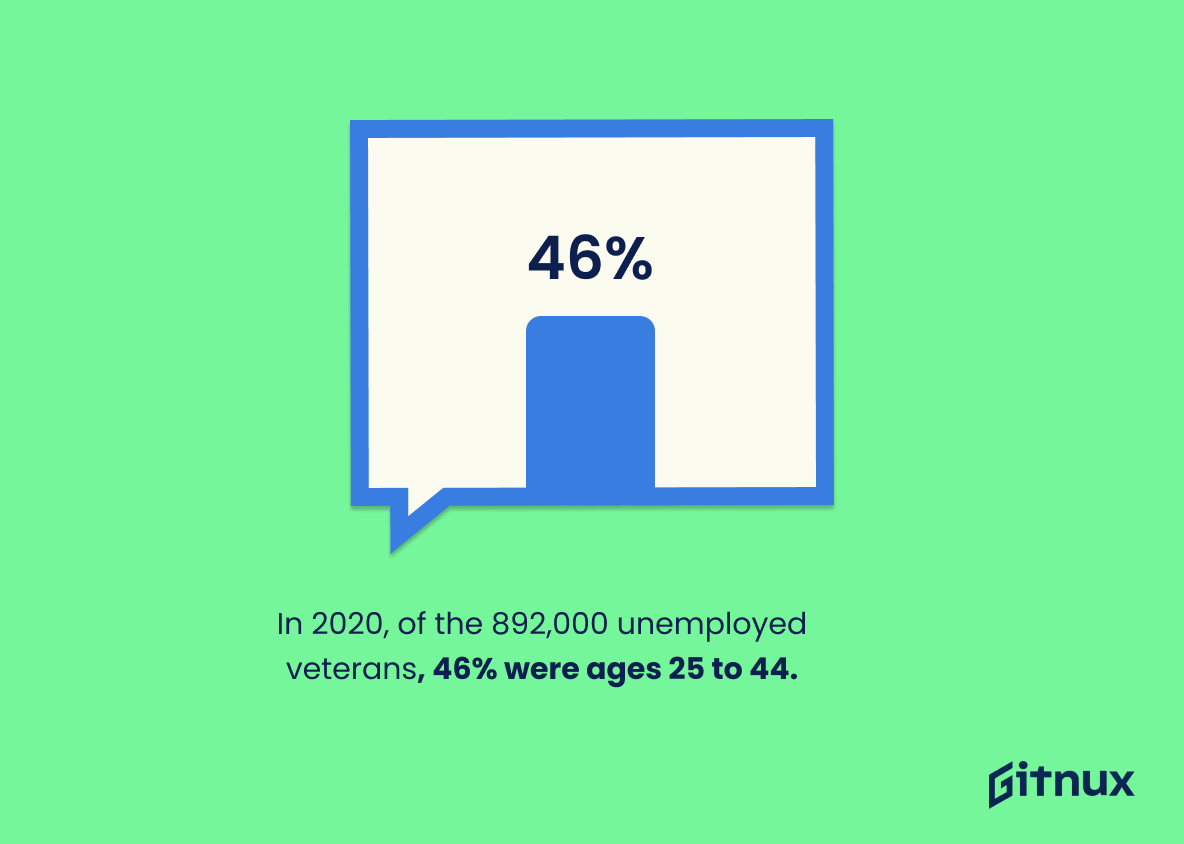
In 2020, of the 892,000 unemployed veterans, 46% were ages 25 to 44.
This statistic is a telling indication of the struggles that veterans face when transitioning from military to civilian life. It highlights the fact that a significant portion of veterans are unable to find employment, despite their experience and qualifications. This statistic is a reminder of the need for more resources and support for veterans in the workforce.
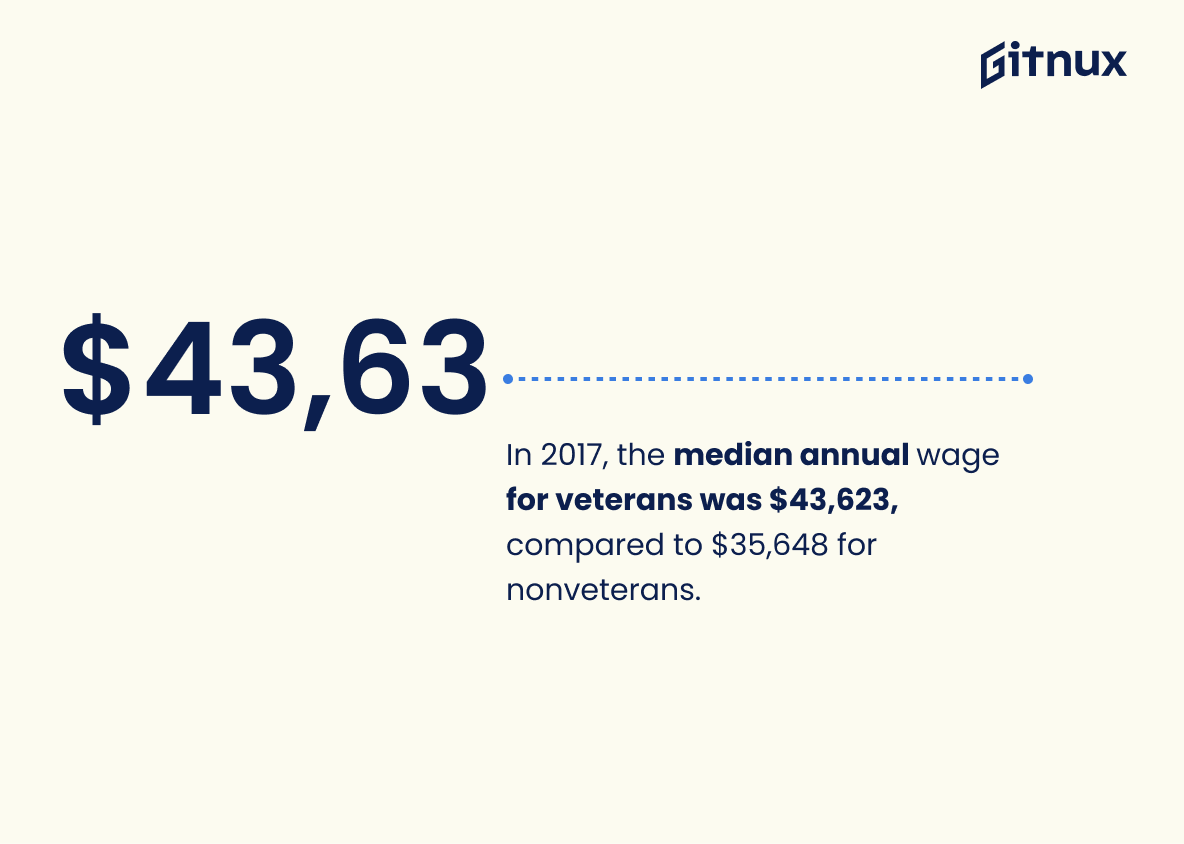
In 2017, the median annual wage for veterans was $43,623, compared to $35,648 for nonveterans.
This statistic is a powerful indicator of the value veterans bring to the workforce. It shows that veterans are not only more likely to be employed, but they are also earning more than their nonveteran counterparts. This is a testament to the dedication and hard work of veterans, and it is a reminder of the importance of recognizing and supporting veterans in the workforce.
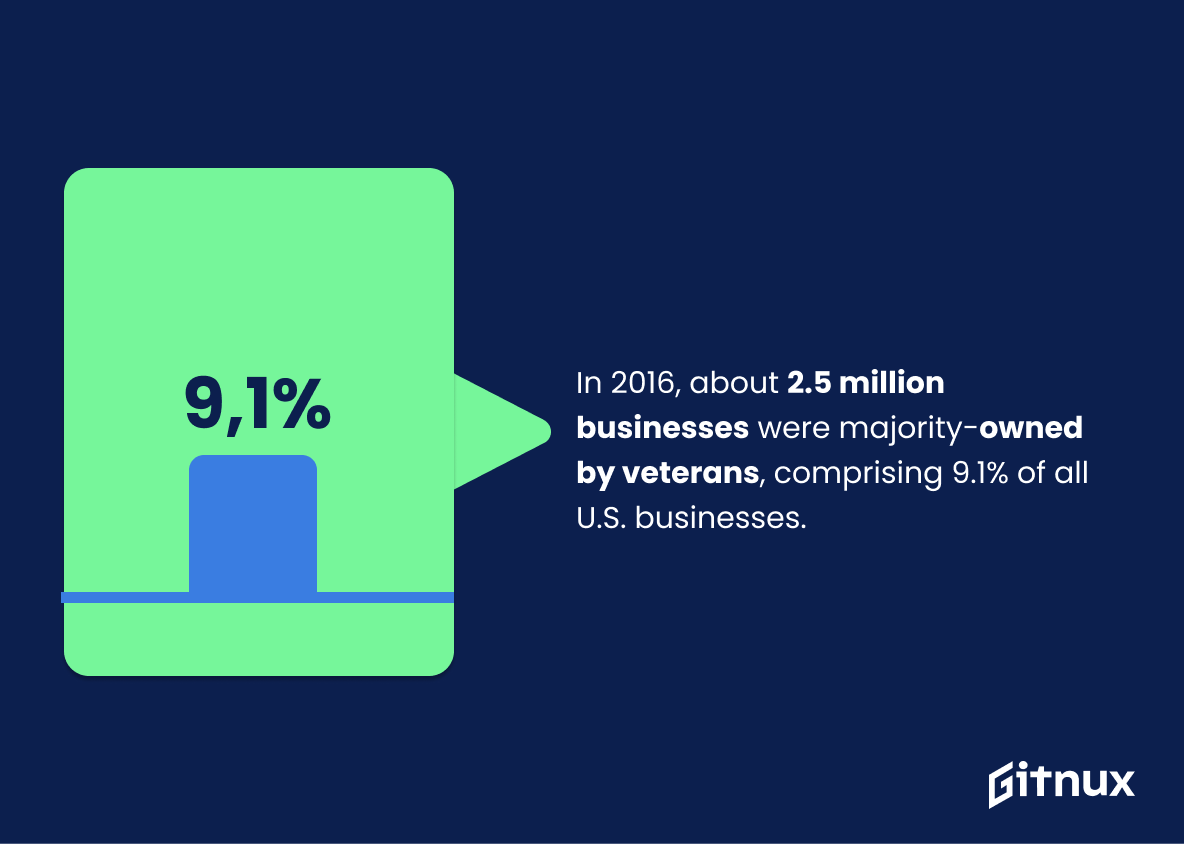
In 2016, about 2.5 million businesses were majority-owned by veterans, comprising 9.1% of all U.S. businesses.
This statistic is a testament to the success of veterans in the business world. It shows that veterans are not only capable of finding employment, but also of creating their own businesses and becoming entrepreneurs. This statistic is a powerful reminder of the potential of veterans in the workforce and the impact they can have on the economy.
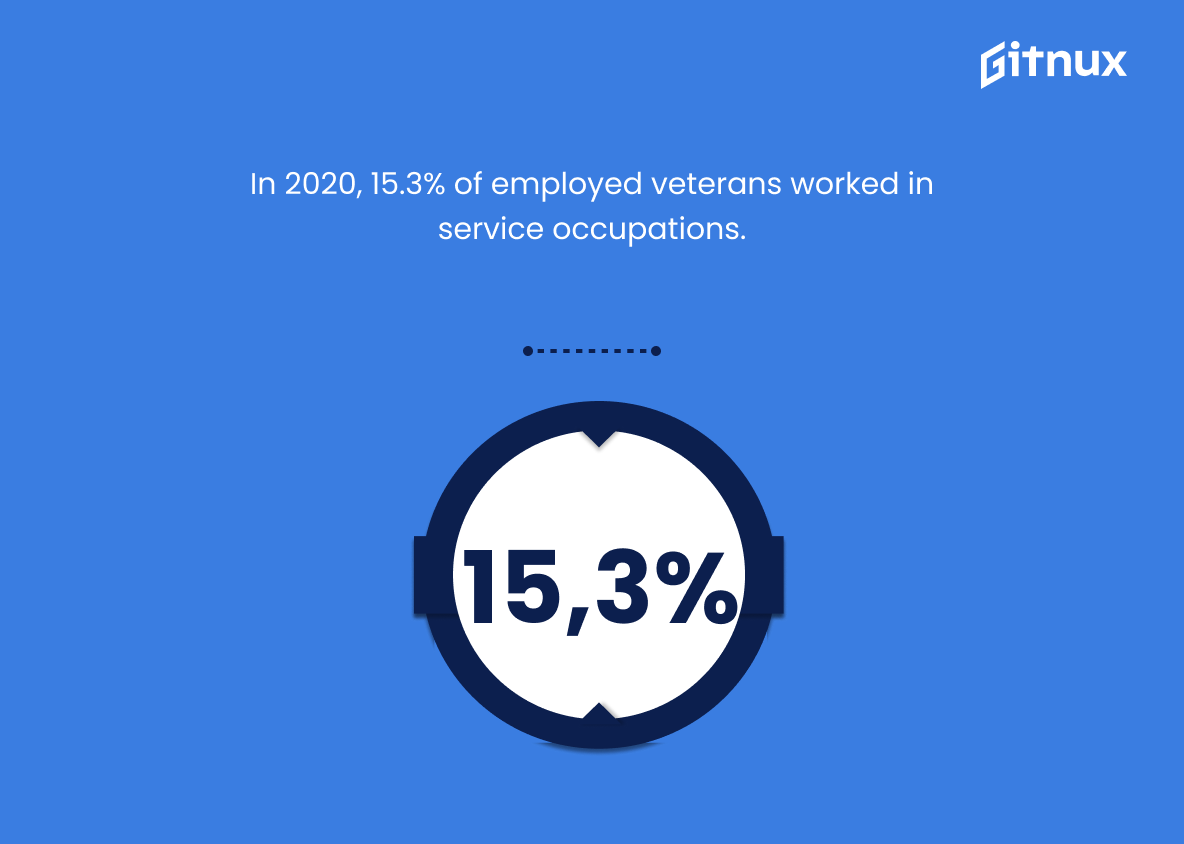
In 2020, 15.3% of employed veterans worked in service occupations.
This statistic is a powerful reminder of the important role veterans play in service occupations. It highlights the dedication and commitment of veterans to serve their country and community, even after their military service has ended. It also serves as a reminder of the need to ensure that veterans have access to the resources and support they need to succeed in the civilian workforce.
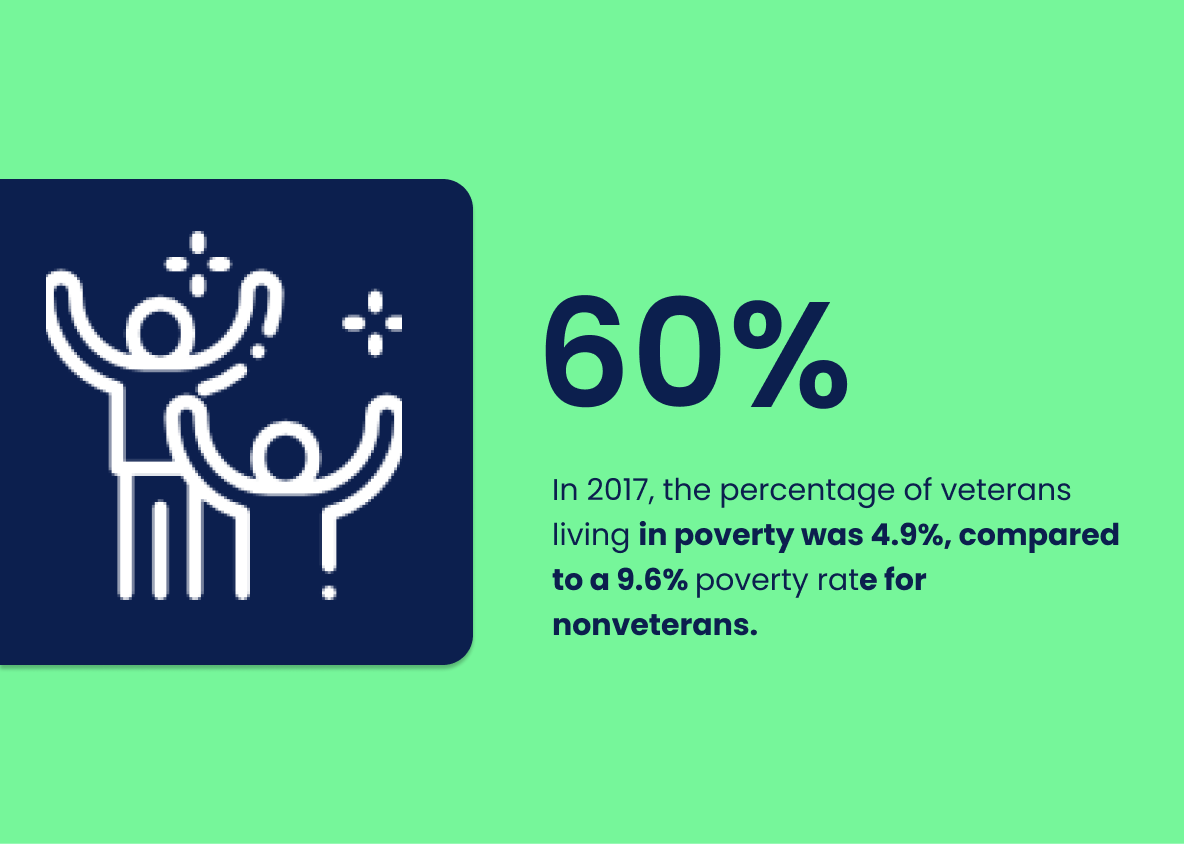
In 2017, the percentage of veterans living in poverty was 4.9%, compared to a 9.6% poverty rate for nonveterans.
This statistic is a powerful reminder of the sacrifices veterans have made for our country. It highlights the fact that veterans are less likely to be living in poverty than nonveterans, despite the challenges they face in transitioning to civilian life. This statistic is an important reminder of the need to support veterans in the workforce and ensure they have access to the resources they need to succeed.
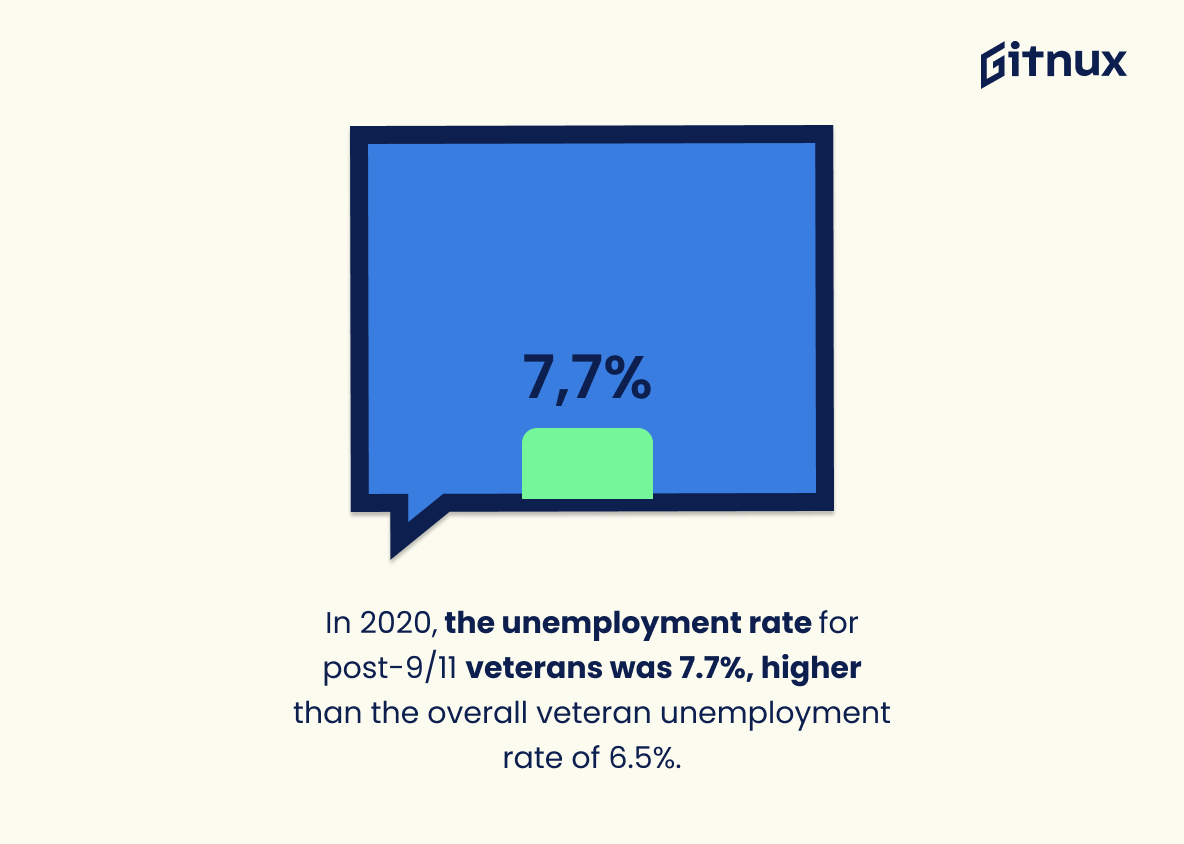
In 2020, the unemployment rate for post-9/11 veterans was 7.7%, higher than the overall veteran unemployment rate of 6.5%.
This statistic serves as a stark reminder that post-9/11 veterans are facing a unique set of challenges when it comes to finding employment. It highlights the need for more resources and support for veterans who have served our country, and it emphasizes the importance of understanding the unique needs of this population.
Conclusion
The statistics presented in this blog post demonstrate the current state of veterans in the workforce. Despite a decrease in overall veteran unemployment, there are still 284,000 unemployed veterans and 46% of them are between 25-44 years old. Additionally, 18.3% of all veterans were women and 29.2% had service-related disabilities while 47% were 65 or older as of 2019.
Veterans have higher employment rates than nonveterans with 70.5%, 78.5%, and 93% employed within 5 years after leaving active duty military service (2017), since September 2001 (2018) respectively; however they experience underemployment at a rate of 46%. The median annual wage for veterans was $43,623 compared to $35,648 for nonveterans (2017). Furthermore 15.3 % worked in services occupations while 21 .4 % worked public sector jobs compared to 13 .3 % for nonveteran workers(2020). Finally 2 .5 million businesses were majority owned by Veterans comprising 9 .1 percent Uf US businesses but 43 ,000 experienced homelessness that same year.( 2020 )
References
0. – https://www.vaforvets.va.gov
1. – https://www.va.gov
2. – https://www.dol.gov
3. – https://www.edlabor.house.gov
4. – https://www.census.gov
5. – https://www.bls.gov
6. – https://www.vaforvets.va.gov
WifiTalents, cited April 2024: Veterans In The Workforce
