

Obesity is a growing problem in the United States, and it is becoming increasingly clear that socioeconomic status is a major factor in determining who is most likely to suffer from obesity. In this blog post, we will take a look at the current obesity statistics in the US, and how they are affected by socioeconomic status.
We will also discuss the potential causes of this correlation, and what can be done to reduce the prevalence of obesity in the US. Finally, we will discuss the implications of these findings for public health policy and initiatives.
Socioeconomic Status And Obesity: The Most Important Statistics
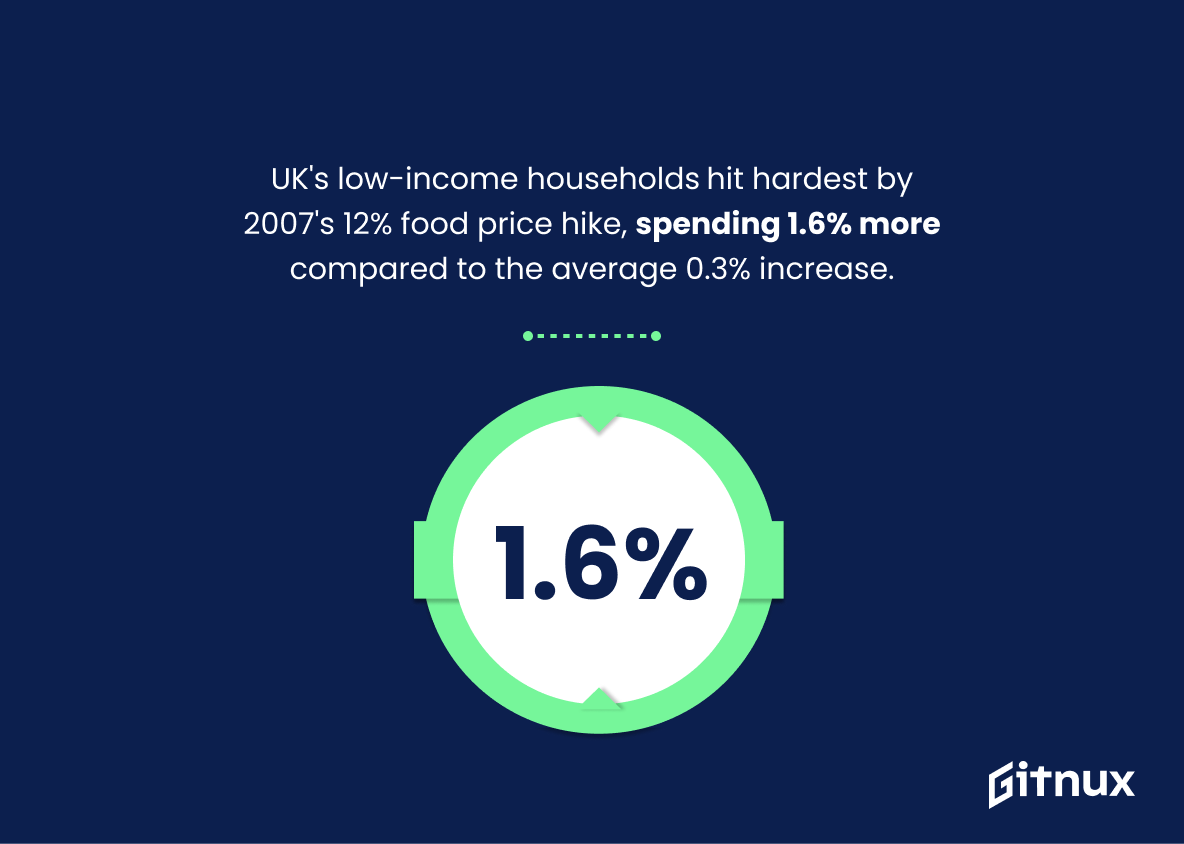
Low-income households in the UK were disproportionately affected by a 12% food price increase in 2007, spending 1.6% more on food than the average 0.3% increase.
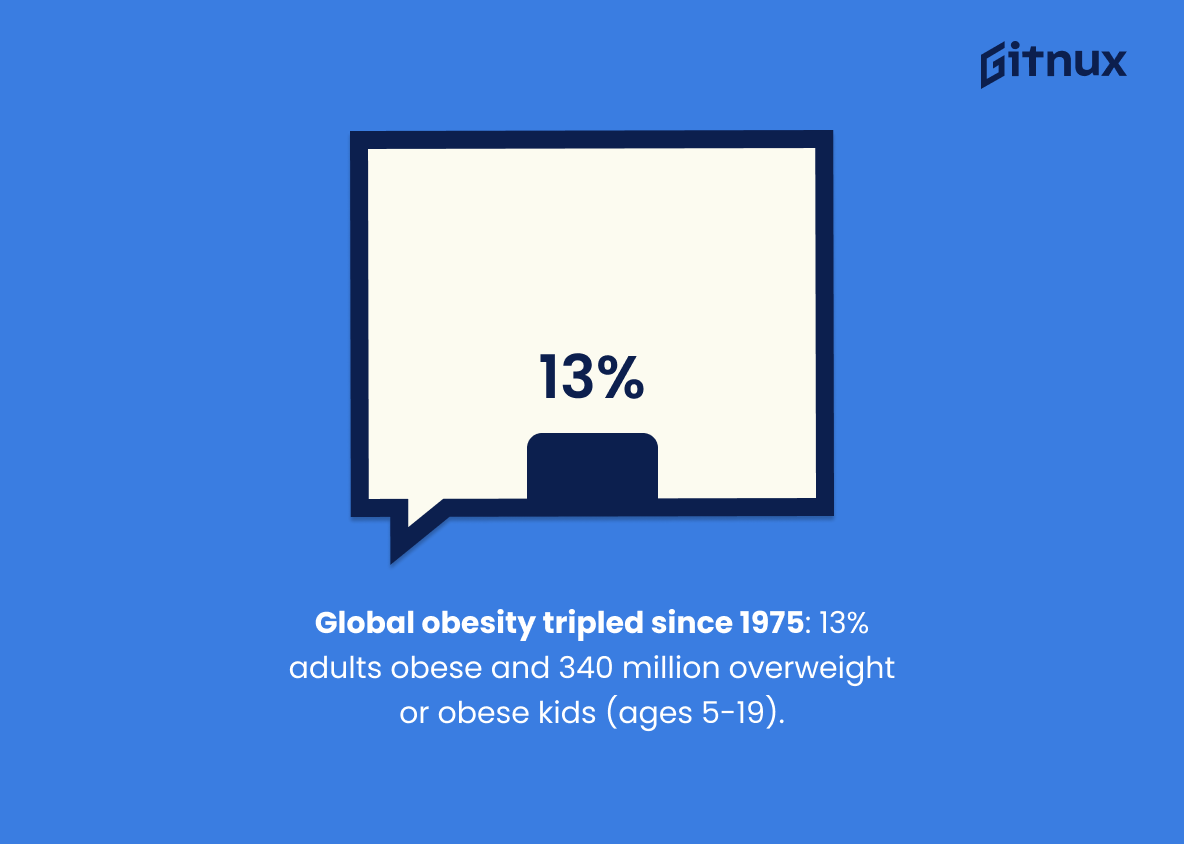
The global rate of obesity has nearly tripled since 1975, with 13% of people 18 and older being obese and 39% overweight, and 340 million overweight or obese kids and teenagers between the ages of 5 and 19.
Socioeconomic Status And Obesity Statistics Overview
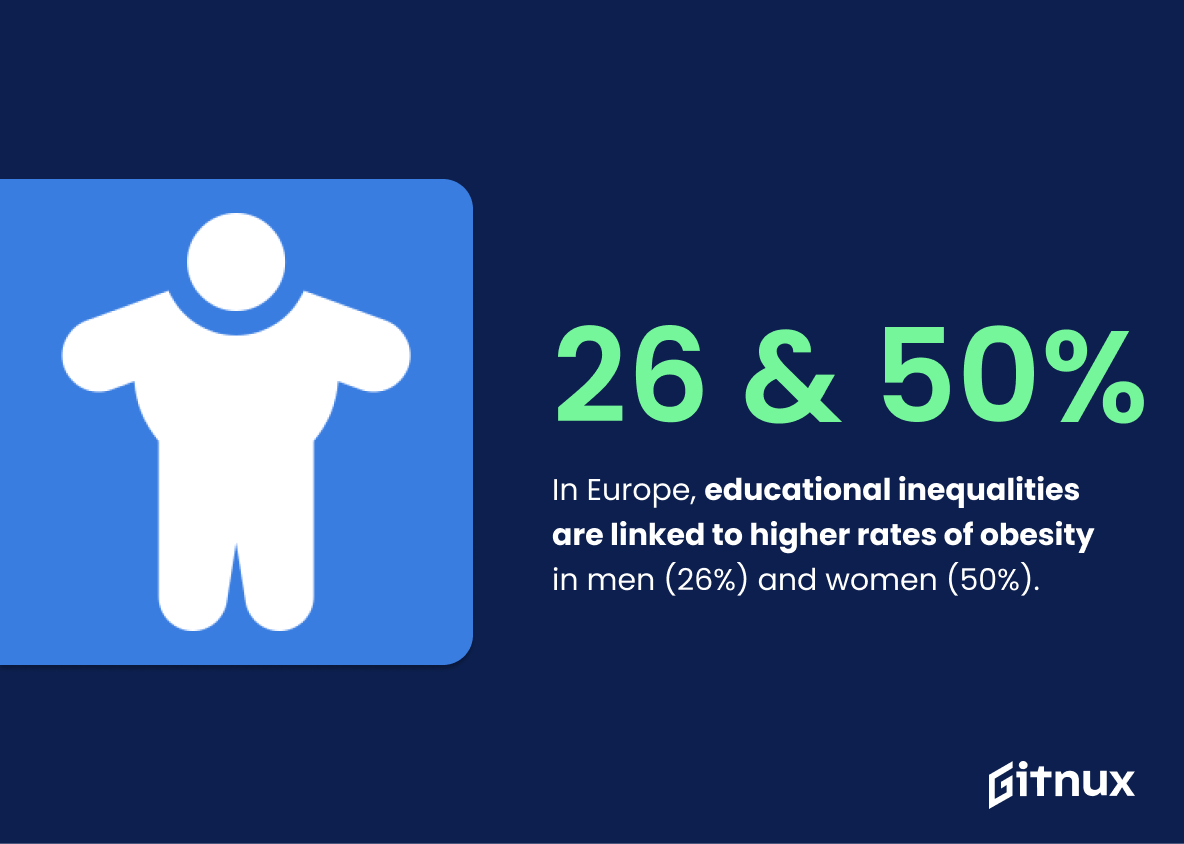
In Europe, educational inequalities are linked to higher rates of obesity in men (26%) and women (50%).
It suggests that people with lower educational attainment are more likely to be obese, which can be attributed to a variety of factors such as access to healthy foods, lack of physical activity, and limited health care.
College graduates have a lower obesity prevalence than those with some college education or high school or less.
This indicates that higher levels of education can lead to better health outcomes, and that access to higher education can be a factor in reducing obesity prevalence.
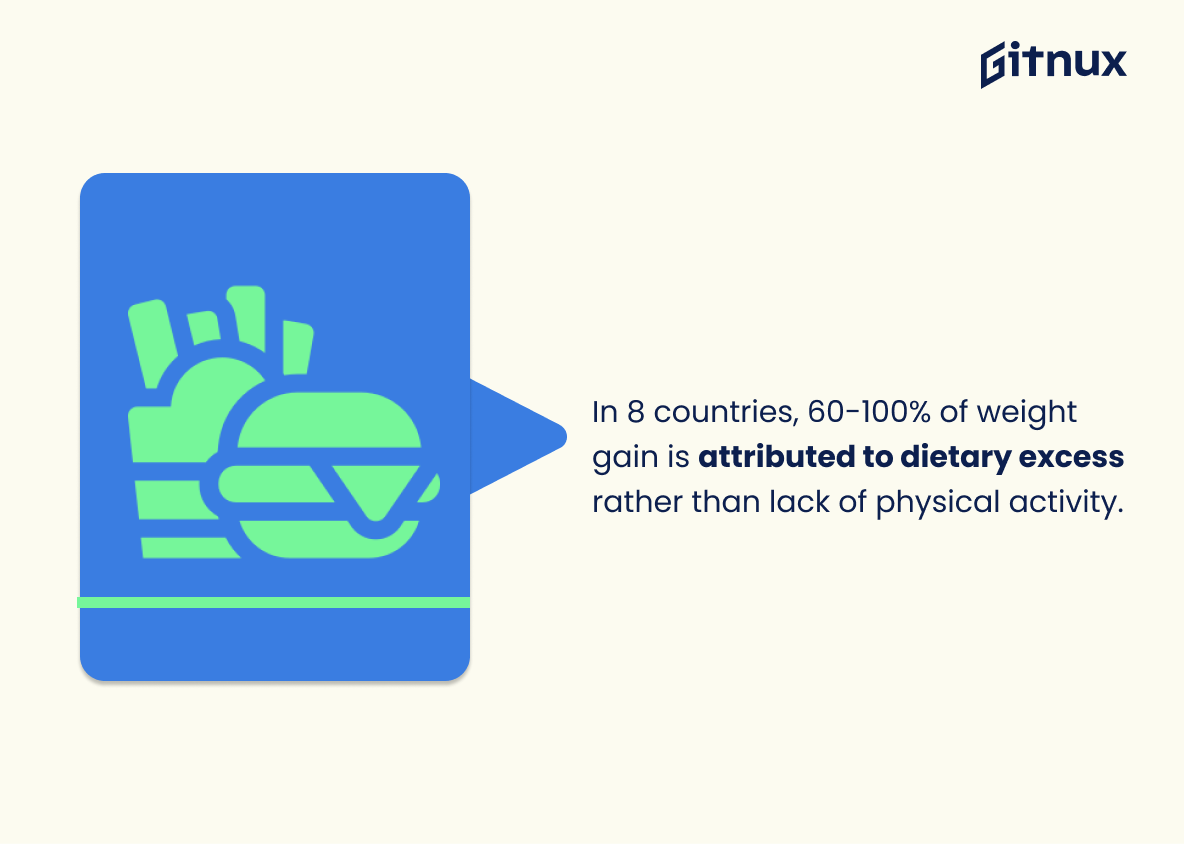
In 8 countries, 60-100% of weight gain is attributed to dietary excess rather than lack of physical activity.
Increased energy intake is the main driving force behind the obesity epidemic in lower socioeconomic groups. Healthy food tends to be less convenient, less accessible and more expensive, which can make it difficult for those in lower socioeconomic groups to make healthier food choices.
Low-income households in the UK were disproportionately affected by a 12% food price increase in 2007, spending 1.6% more on food than the average 0.3% increase.
This highlights the fact that low-income households are more likely to purchase energy-dense foods of poor nutritional value due to their affordability. This can lead to poorer nutrition and higher obesity rates among these households, which can have a long-term effect on their health and wellbeing.
Low socioeconomic groups in Europe are twice as likely to become obese, leading to increased risk of serious health issues.
Obesity is a major risk factor for many chronic diseases, and lower socioeconomic groups are more likely to suffer from these diseases due to their increased risk of obesity.
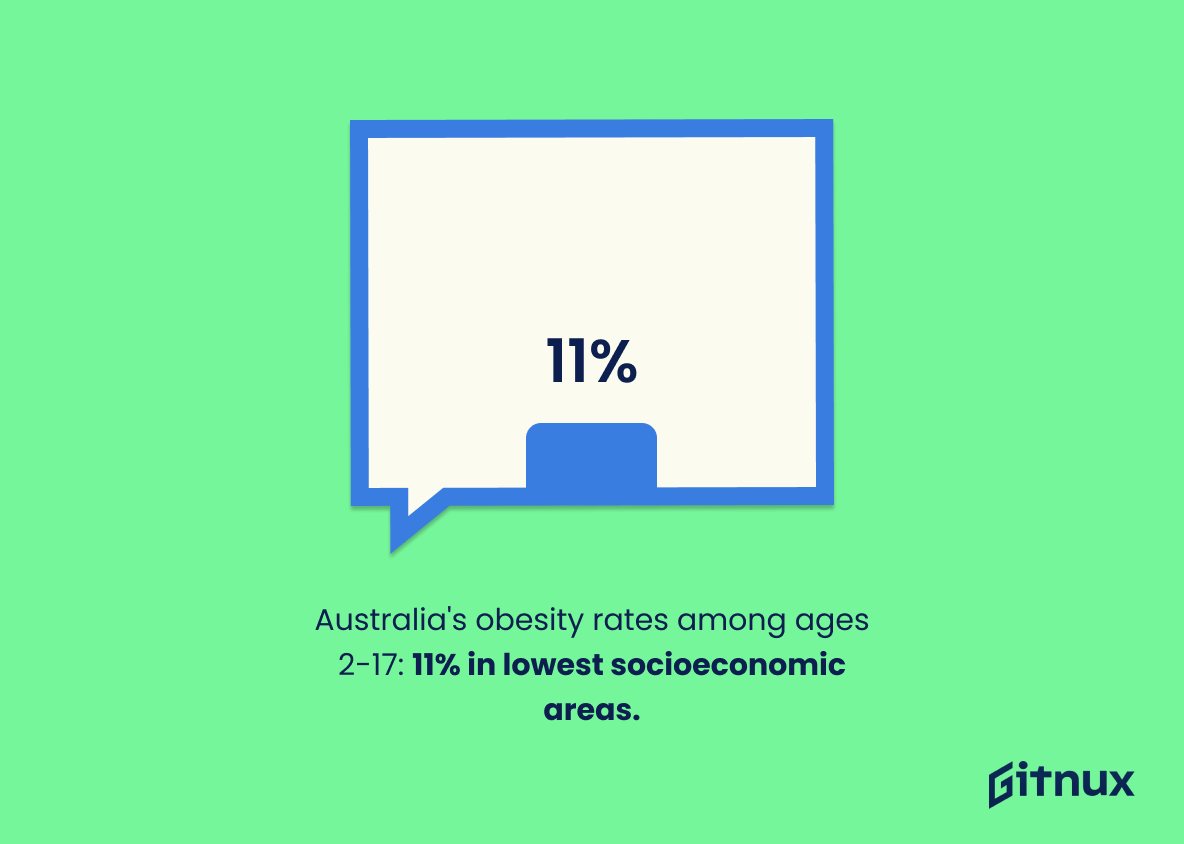
In Australia, obesity rates for those aged 2-17 were significantly higher in the lowest socioeconomic areas (11%) than in the highest socioeconomic areas (4.4%).
There is a link between socioeconomic status and obesity, suggesting that those in lower socioeconomic areas are more likely to be overweight or obese than those in higher socioeconomic areas. This has important implications for public health initiatives and policy-making.
In France, between 1997 and 2012, the lowest income group became obese more than three times faster than those in the higher income groups.
It shows that lower income groups are more likely to become obese at a faster rate than higher income groups, which can have a significant impact on the health and well-being of those in lower income groups.
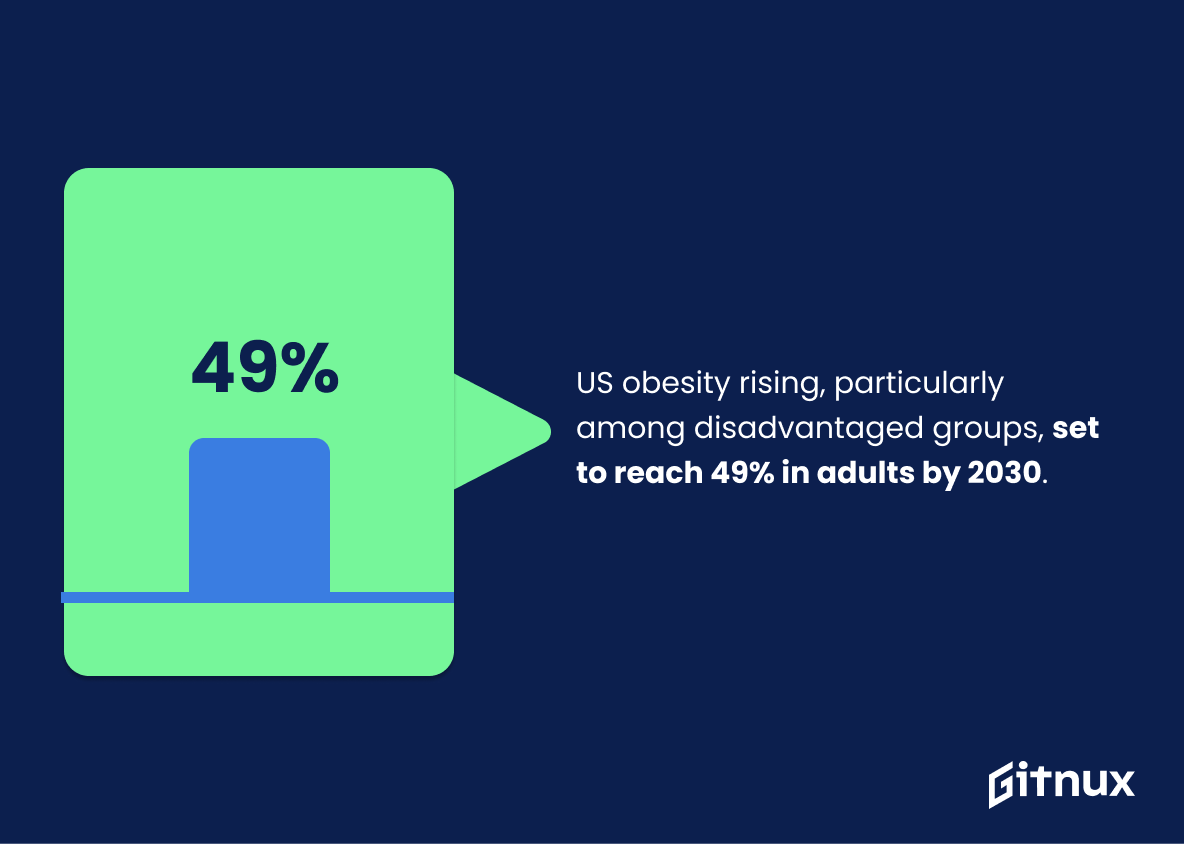
Obesity prevalence in the US is increasing, with the greatest prevalence among socially disadvantaged groups and under-represented persons, and is predicted to reach 48.9% in adults by 2030.
Thus, there is a disproportionate burden of obesity among socially disadvantaged groups, which can lead to further health disparities and economic inequality.
Obesity prevalence is lower in the highest income group than in the middle and lowest income groups, and this is significant for white women.
Obesity prevalence is lower in both the lowest and highest income groups compared to the middle-income group, and higher in the highest income group than the lowest income group for non-Hispanic black men.
Non-Hispanic black adults and adolescents are much more likely to be overweight or obese than their non-Hispanic white counterparts.
This highlights the disparities between different racial groups in terms of their likelihood of being overweight or obese.
African women and Black/Hispanic women have the highest rates of obesity, while Latino men are twice as likely to be diagnosed with diabetes.
This data shows that certain ethnic groups are more likely to suffer from obesity and diabetes, which can have serious health consequences. It also highlights the need for targeted interventions to address these disparities and improve health outcomes for all ethnic groups.
The incidence of overweight and obesity in ACT children decreased in males, but remained consistent in females, particularly those from low socioeconomic families.
While there have been some improvements in the overall incidence of overweight and obesity in ACT children, those from low socioeconomic families are still disproportionately affected. This highlights the need for targeted interventions to address the underlying social and economic factors that contribute to the prevalence of obesity in these communities.
The global rate of obesity has nearly tripled since 1975, with 13% of people 18 and older being obese and 39% overweight, and 340 million overweight or obese kids and teenagers between the ages of 5 and 19.
Over 30% of adults are overweight or obese, with 9.2% having extreme obesity, which shows that obesity is a widespread problem that affects people of all socioeconomic backgrounds.
Asians have the greatest income disparity and the highest percentage of households with at least one member with a bachelor’s degree, while Blacks and Hispanics have the highest percentage of household spending on housing.
Income and education level are associated with spending habits and access to resources, which can have an impact on health outcomes. For example, those with higher incomes may have access to healthier food options and more leisure time to exercise, while those with lower incomes may have limited access to healthy foods and limited time to exercise due to work and other obligations.
Obesity prevalence has decreased among high SES groups and increased among low SES groups, resulting in a narrowing of the gap between obesity rates in different SES categories.
There is an unequal distribution of obesity rates among different SES groups. This can have a significant impact on health outcomes and access to resources, as those with lower SES are more likely to suffer from obesity-related health issues.
Obesity is a major risk factor for premature death, leading to 4.7 million deaths worldwide and 8% of all fatalities, with 13% of adults and 39% of adults being obese and one in five kids and teenagers being overweight.
Overweight and obesity kill more people than underweight in 65% of countries and are responsible for a significant portion of cancer, heart disease, and diabetes burdens. It highlights the importance of addressing the issue, especially in countries where it is responsible for a large portion of health burdens.
Conclusion
In conclusion, socioeconomic status and obesity statistics are closely linked. Low-income individuals are more likely to be obese than those with higher incomes, and this is due to a variety of factors such as access to healthy food, lack of physical activity, and stress.
The good news is that there are steps that can be taken to reduce the prevalence of obesity in low-income communities, such as providing access to healthy food, promoting physical activity, and reducing stress. By taking these steps, we can help reduce the prevalence of obesity and improve the overall health of our society.
References
1 – https://www.euro.who.int/__data/assets/pdf_file/0003/247638/obesity-090514.pdf
2 – https://www.cdc.gov/mmwr/volumes/66/wr/mm6650a1.htm?s_cid=mm6650a1_w
3 – https://www.aihw.gov.au/reports/australias-health/overweight-and-obesity
4 – https://financesonline.com/obesity-and-the-black-american-causes-culture-consequences-and-cost/
5 – https://www.brookings.edu/blog/up-front/2020/08/07/black-and-hispanic-americans-at-higher-risk-of-hypertension-diabetes-obesity-time-to-fix-our-broken-food-system/
6 – https://bmcpublichealth.biomedcentral.com/articles/10.1186/s12889-019-7645-9
7 – https://www.obesityevidencehub.org.au/collections/trends/socio-economic-group
8 – https://www.who.int/news-room/fact-sheets/detail/obesity-and-overweight
9 – https://www.niddk.nih.gov/health-information/health-statistics/overweight-obesity
10 – https://www.bls.gov/spotlight/2018/race-economics-and-social-status/home.htm
11 – https://www.ncbi.nlm.nih.gov/pmc/articles/PMC7484407/#:~:text=Over%20the%20past%203%20decades,ethnic%2Fracial%20and%20gender%20categories.
12 – https://ourworldindata.org/obesity#citation
13 – https://easo.org/media-portal/statistics/#:~:text=At%20least%202.8%20million%20adults,attributable%20to%20overweight%20and%20obesity.
