San Francisco, known as one of the most expensive cities in the United States, has income statistics that mirror its high cost of living. In this blog post, we will delve into various income statistics from sources like DataUSA, Macrotrends, SFGov Maps ArcGIS, and SFPublicPress.org. Our exploration will cover an array of demographics to provide a comprehensive view of earnings in San Francisco.
Topics will include median household incomes for families with children under 18, per capita incomes, poverty rates, and the racial wealth gap between white and Black households. We’ll also examine the disparity between the top 1% of earners and the bottom 99%, compare median full-time salaries of women to those of men, and review changes in income distribution since 1979. Additionally, we’ll compare San Francisco’s median family income with that of other large U.S. cities, explore concentrations of low-income families by neighborhood, and look at the number of millionaires per capita in the city. Other points of interest will be the percentage of the population living below the poverty line, the cost of living comfortably in San Francisco, and salary trends among tech workers.
This statistic is a telling indication of the financial health of San Francisco households. It provides a snapshot of the average income of households in the city, and can be used to compare the financial well-being of San Franciscans to other cities and regions. It can also be used to identify areas of inequality and poverty, and to inform policy decisions that can help improve the economic situation of San Franciscans.
The per capita income for San Francisco is $62,785.
This statistic is a telling indication of the financial health of San Francisco. It provides a snapshot of the average income of the city’s residents, giving insight into the economic well-being of the city and its citizens.
San Francisco Income Statistics Overview
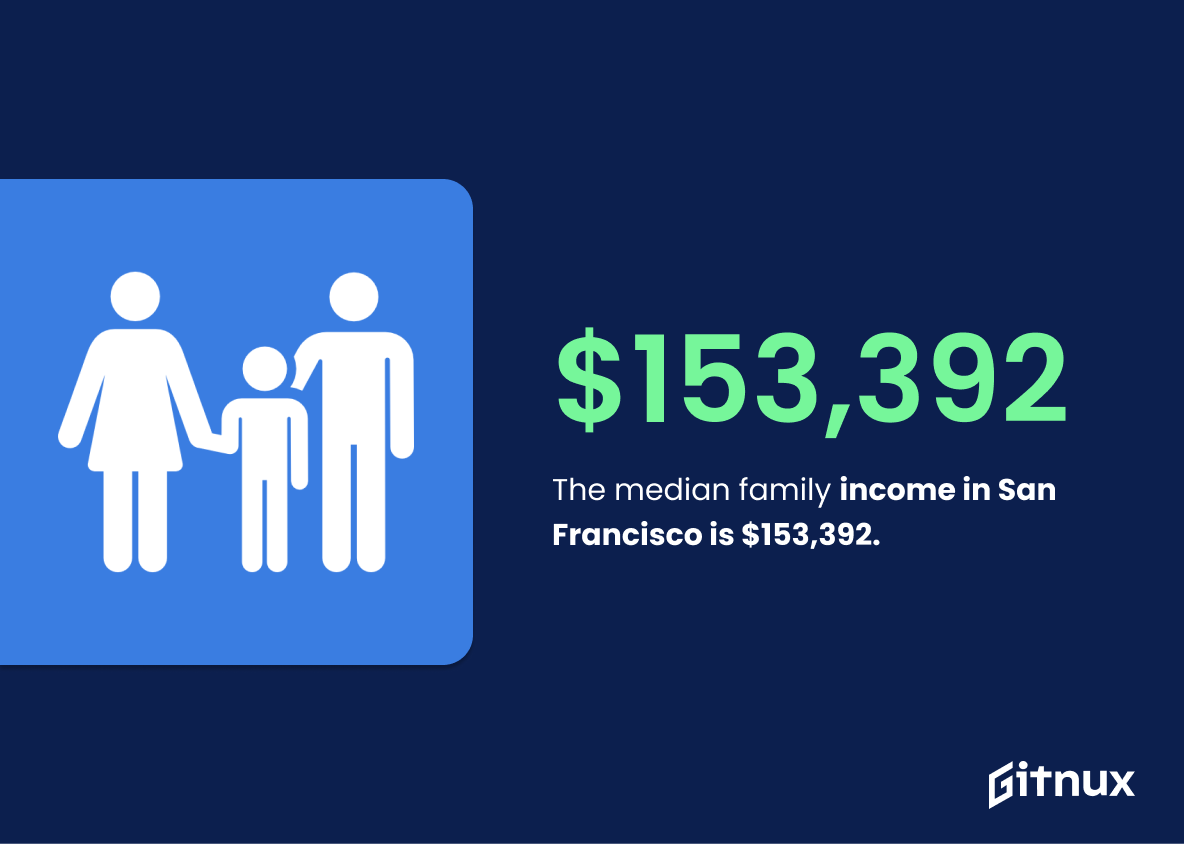
The median family income in San Francisco is $153,392.
This statistic is a telling indication of the financial landscape of San Francisco. It provides a snapshot of the average family income in the city, giving readers an idea of the financial stability of the area. It also serves as a benchmark for comparison, allowing readers to gauge how their own income stacks up against the median.
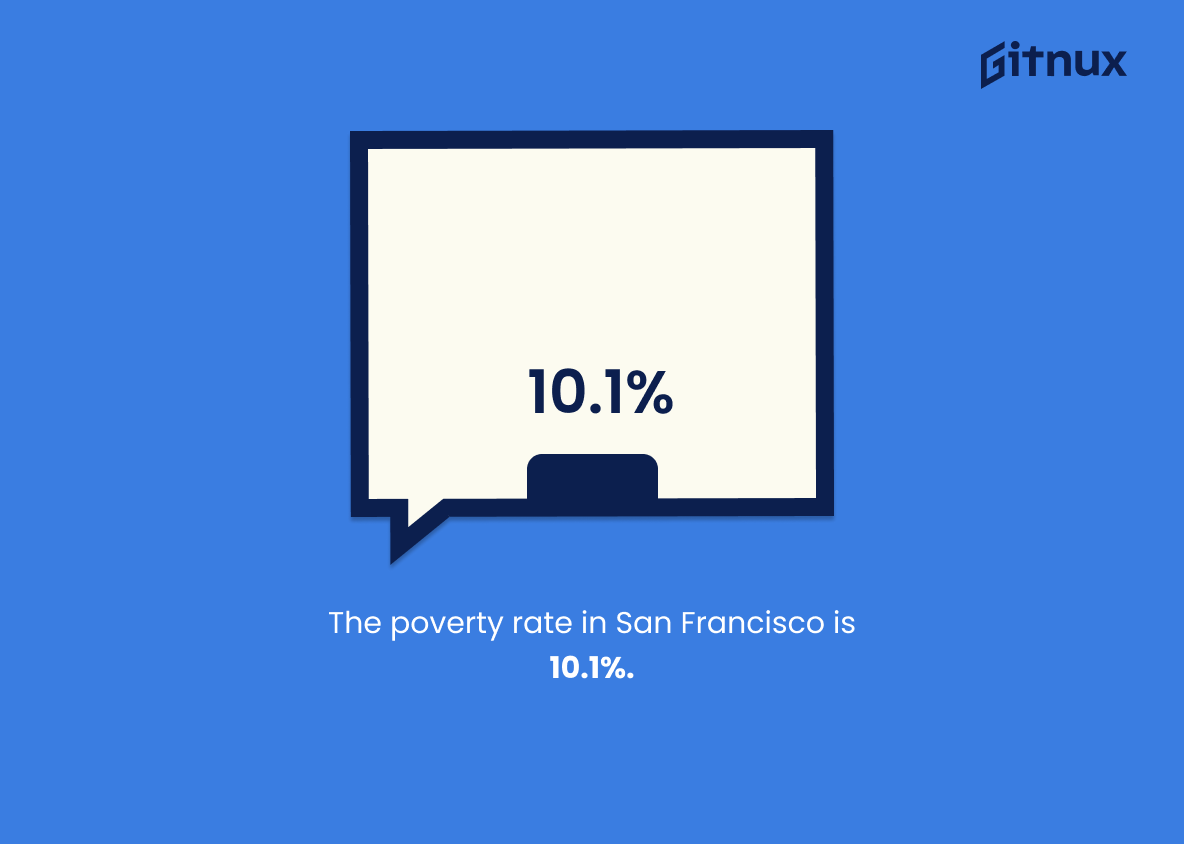
The poverty rate in San Francisco is 10.1%.
This statistic is a stark reminder of the economic disparities that exist in San Francisco. It highlights the fact that despite the city’s wealth and prosperity, there are still many people living in poverty. This statistic serves as a call to action to address the issue of poverty in the city and to ensure that everyone has access to the resources they need to thrive.
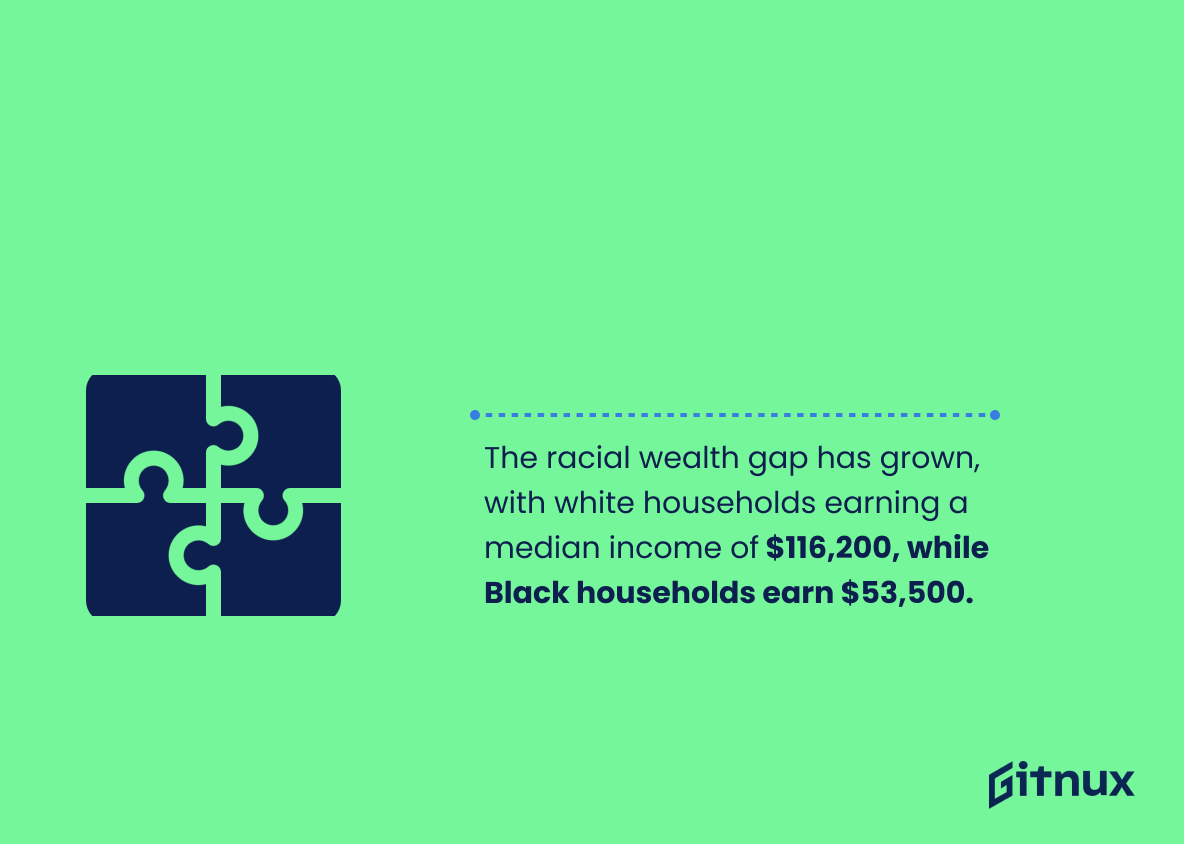
The racial wealth gap in San Francisco has increased, with white households having a median income of $116,200 as compared to $53,500 for Black households.
This statistic is a stark reminder of the inequality that exists in San Francisco. It highlights the fact that, despite the city’s reputation for being a progressive and diverse place, there is still a large disparity between the incomes of white and Black households. This disparity is a major issue that needs to be addressed in order to ensure that all San Franciscans have access to the same opportunities and resources.
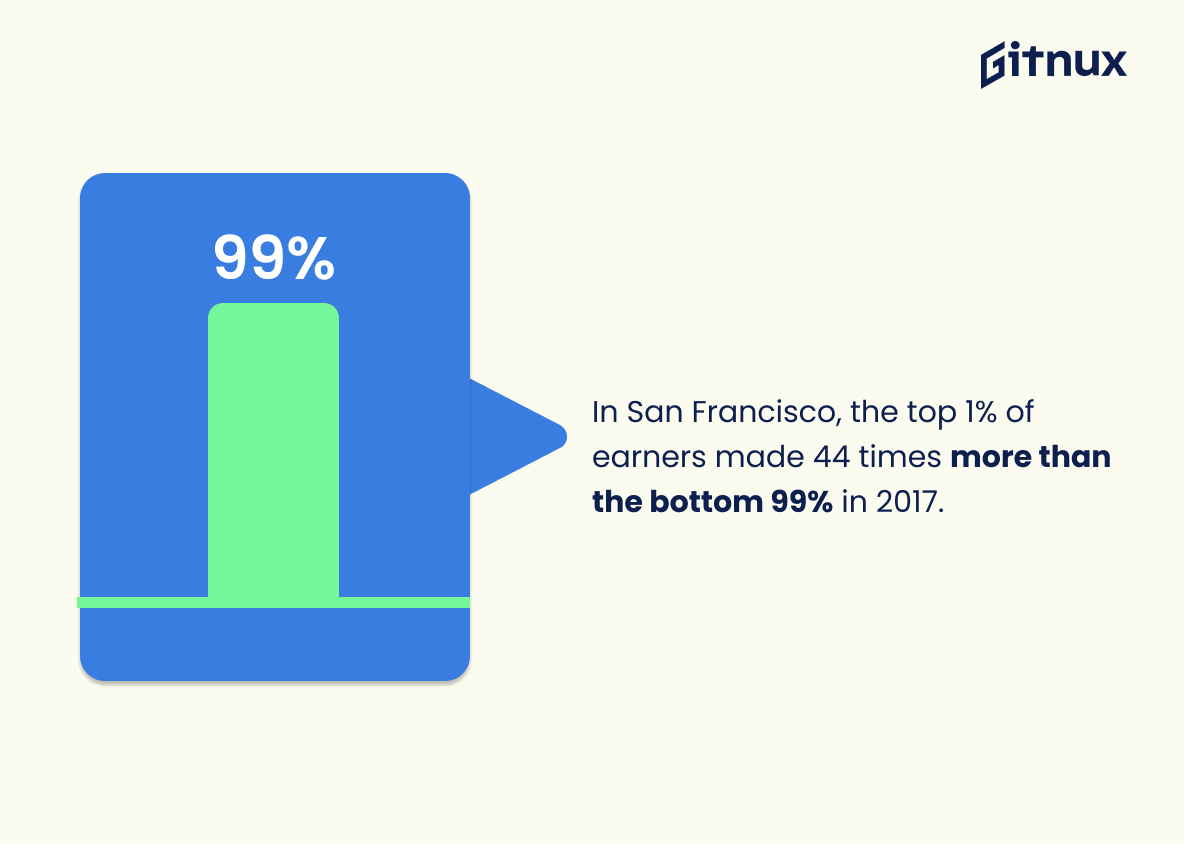
In San Francisco, the top 1% of earners made 44 times more than the bottom 99% in 2017.
This statistic is a stark reminder of the immense wealth gap that exists in San Francisco. It paints a vivid picture of the extreme disparity between the top 1% and the bottom 99%, and serves as a reminder of the need for greater economic equality in the city.
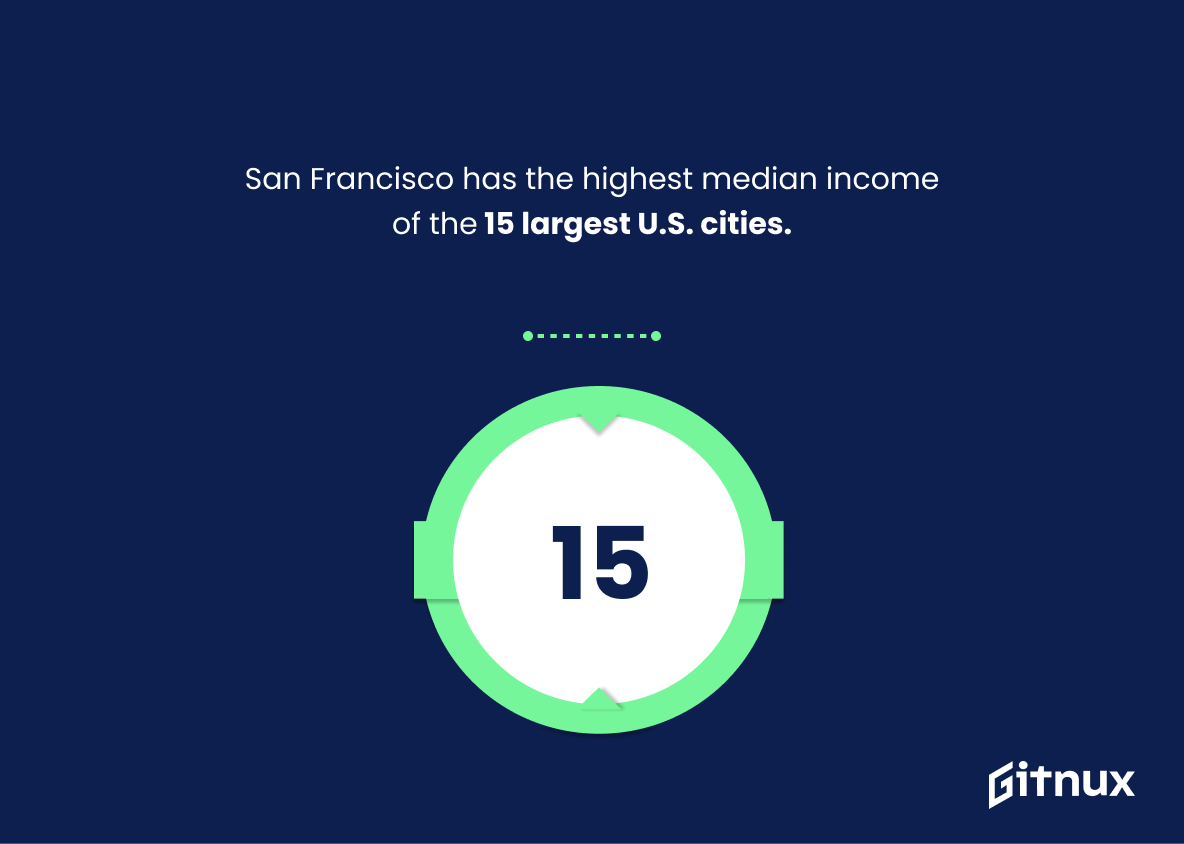
San Francisco has the highest median income of the 15 largest U.S. cities.
This statistic is a testament to the economic success of San Francisco, highlighting the city’s ability to provide its citizens with a high median income. It is a powerful indicator of the city’s financial stability and prosperity, and serves as a reminder of the city’s potential for continued growth and success.
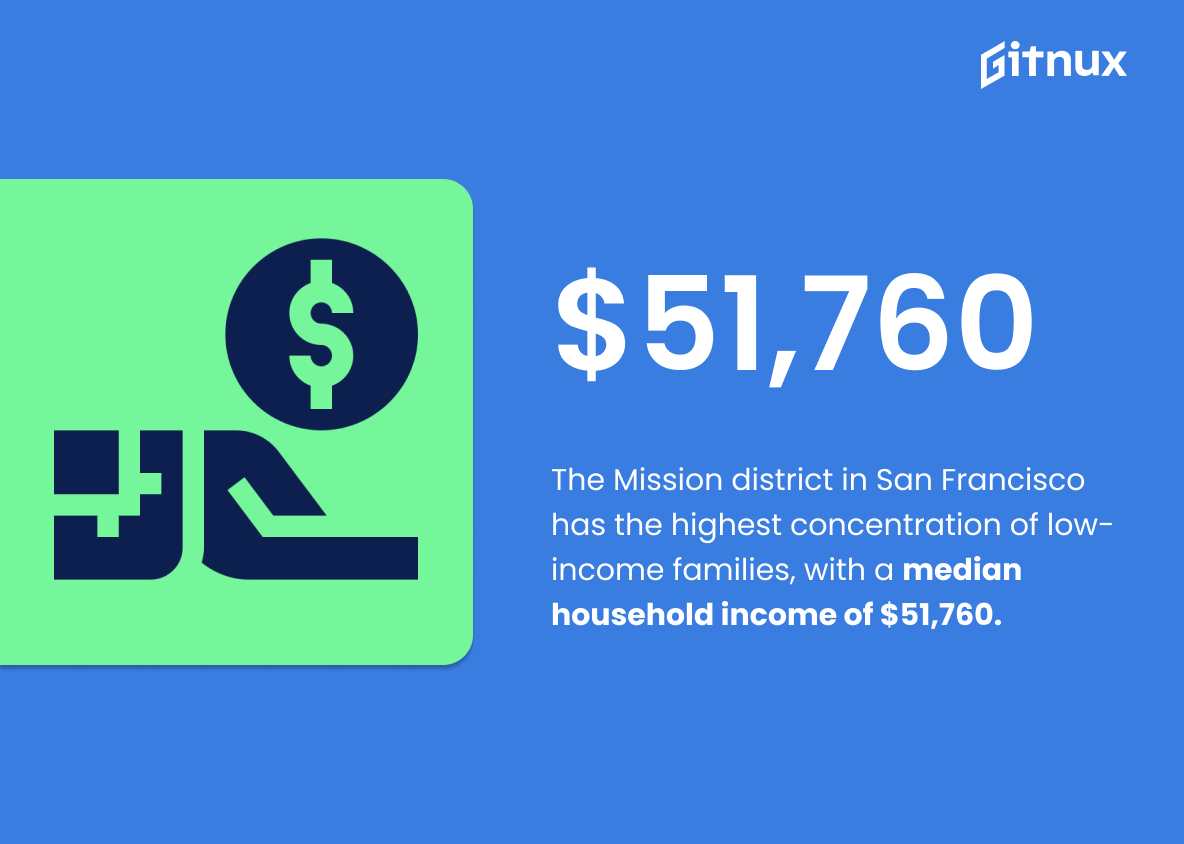
The Mission district in San Francisco has the highest concentration of low-income families, with a median household income of $51,760.
This statistic is a telling indication of the economic disparities that exist in San Francisco. It highlights the fact that the Mission district is home to a large number of low-income families, with a median household income far below the city’s average. This statistic serves as a reminder that, despite the city’s overall wealth, there are still many people living in poverty in San Francisco.
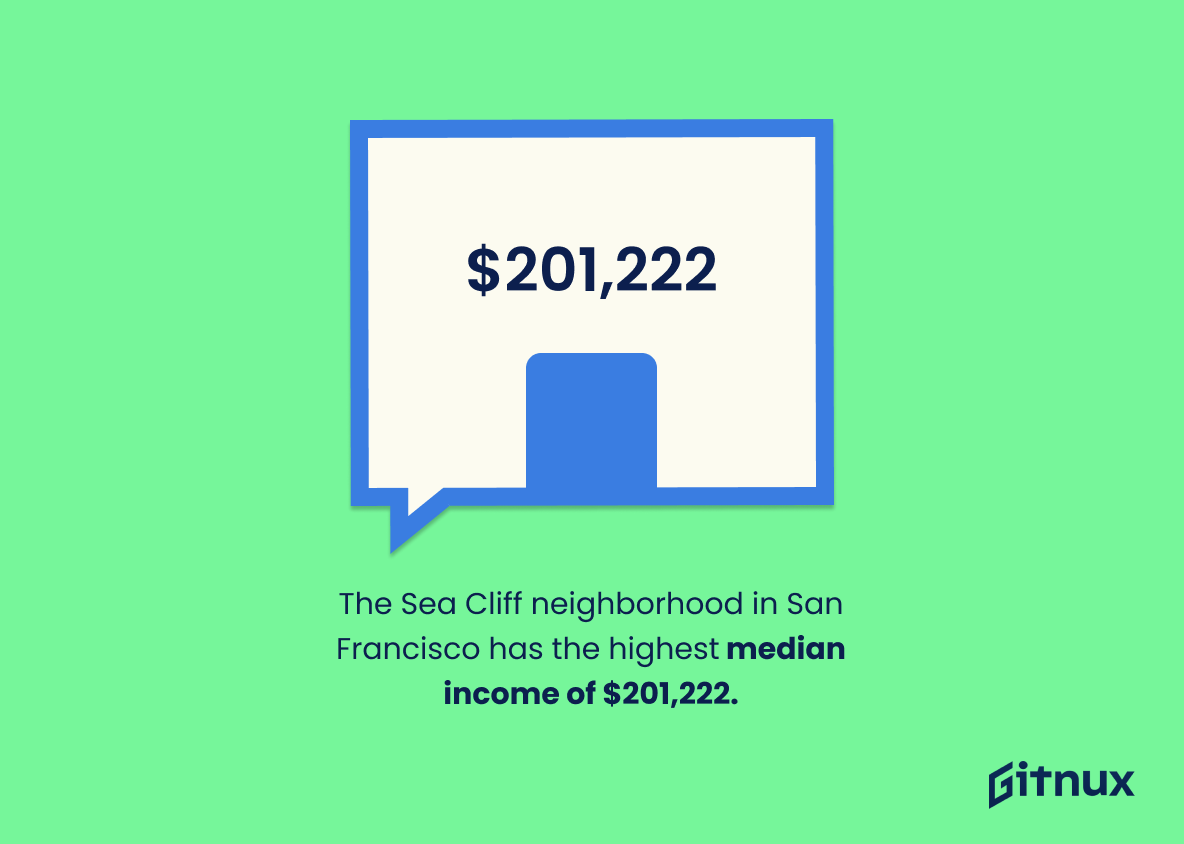
The Sea Cliff neighborhood in San Francisco has the highest median income of $201,222.
This statistic is a testament to the wealth of the Sea Cliff neighborhood in San Francisco, highlighting the fact that it is the most affluent area in the city. It is a telling indicator of the economic disparities between different neighborhoods in San Francisco, and serves as a reminder of the importance of understanding the income dynamics of the city.
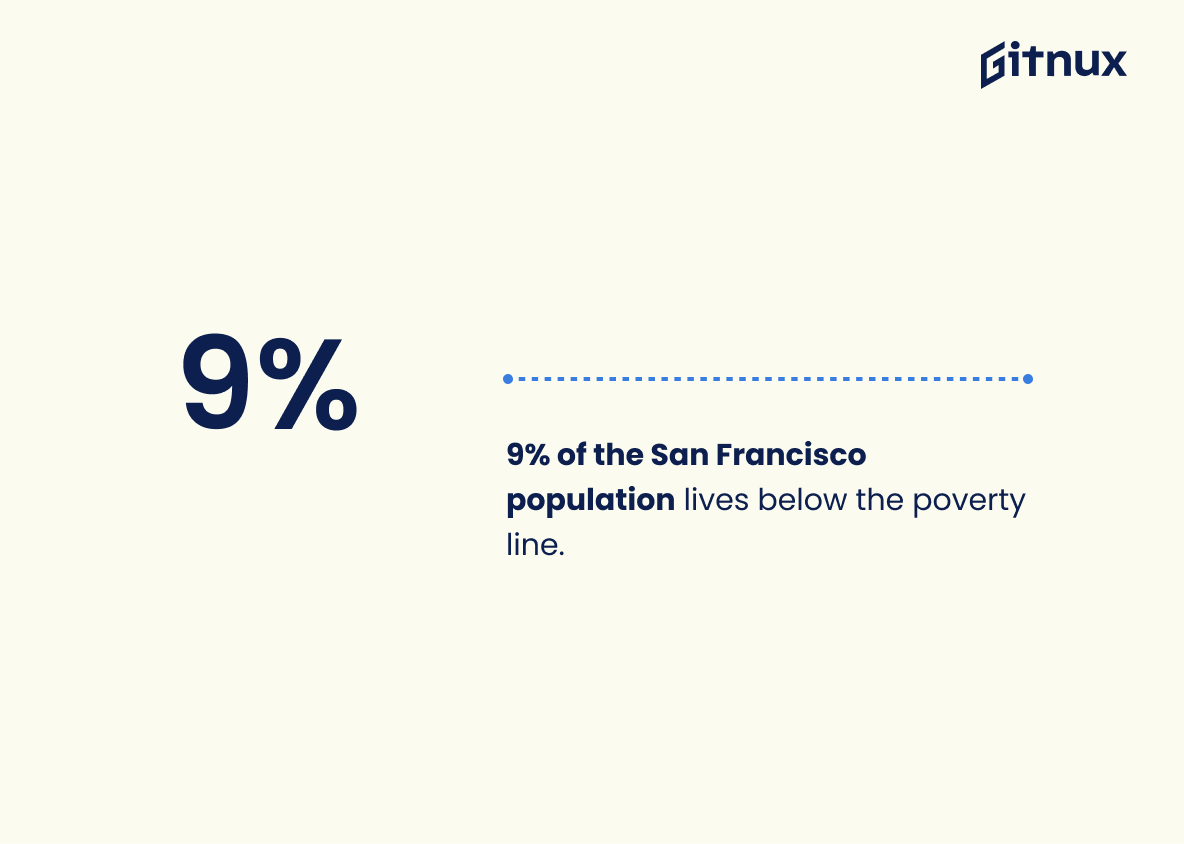
9% of the San Francisco population lives below the poverty line.
This statistic is a stark reminder of the economic disparities that exist in San Francisco. It highlights the need for more resources and support for those living in poverty, as well as the need for greater economic equality in the city.
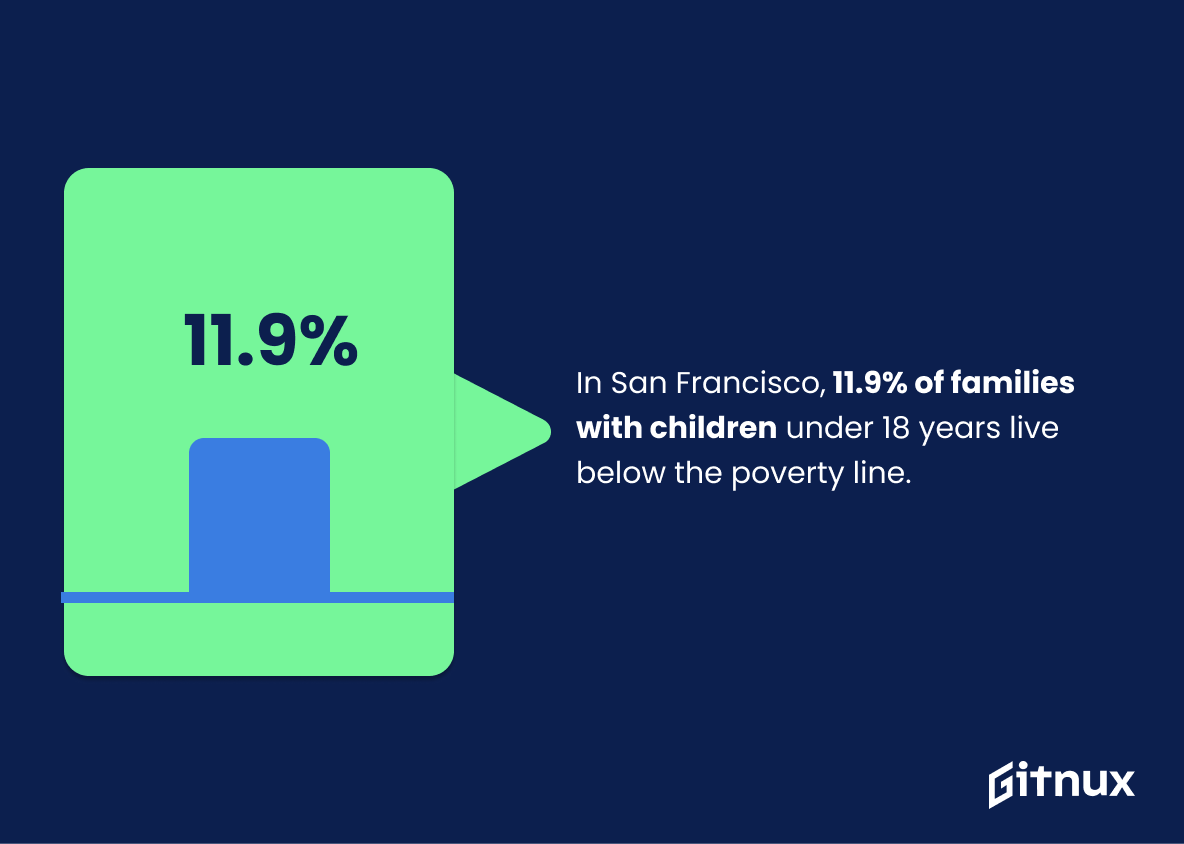
In San Francisco, 11.9% of families with children under 18 years live below the poverty line.
This statistic is a stark reminder of the financial struggles faced by families in San Francisco. It highlights the need for more resources and support to help these families make ends meet and break the cycle of poverty.
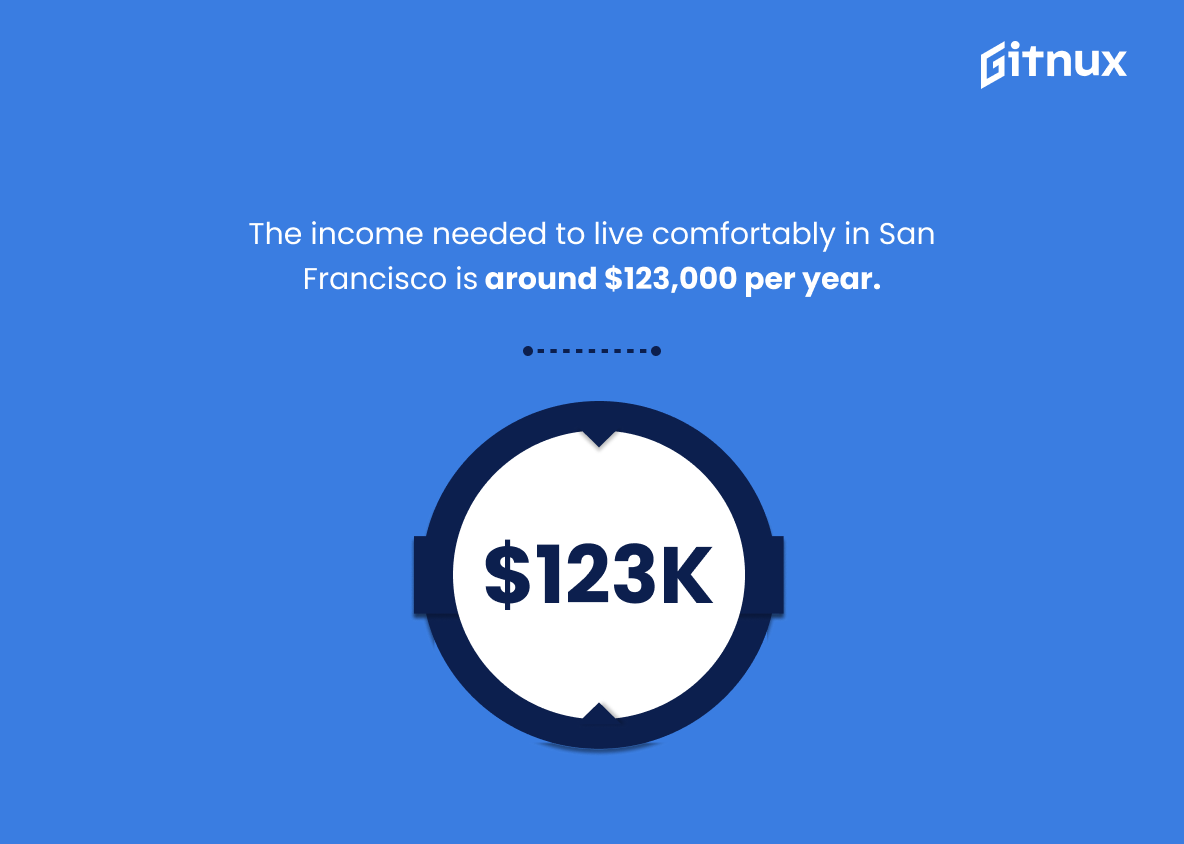
The income needed to live comfortably in San Francisco is around $123,000 per year.
This statistic is a stark reminder of the financial realities of living in San Francisco. It highlights the fact that, in order to live comfortably in the city, one must have an income of at least $123,000 per year. This is a significant amount of money, and it serves to illustrate the high cost of living in San Francisco.
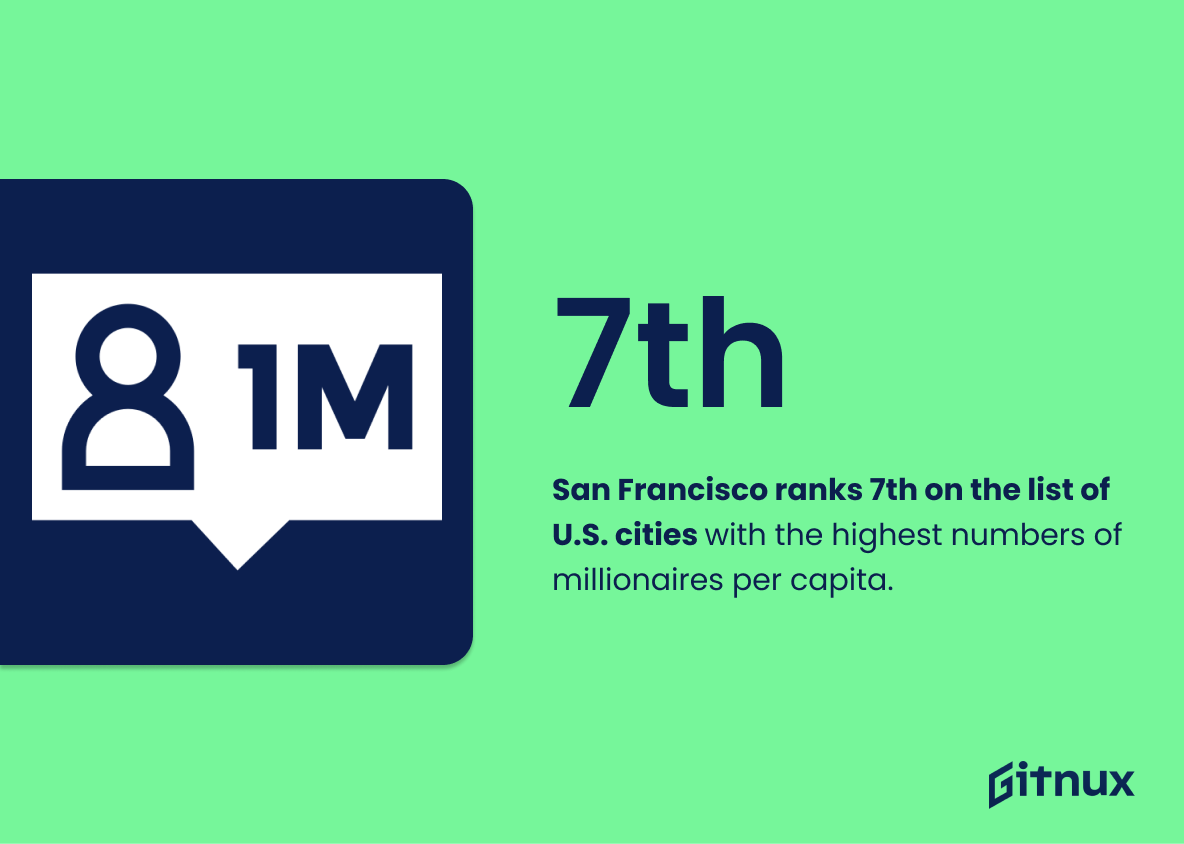
San Francisco ranks 7th on the list of U.S. cities with the highest numbers of millionaires per capita.
This statistic is a testament to the wealth of San Francisco, highlighting the city’s status as a hub for the affluent. It speaks to the city’s economic success and the opportunities it provides for those looking to make their fortune. It also serves as a reminder of the city’s high cost of living, as the high number of millionaires per capita is likely a contributing factor to the city’s expensive housing market.
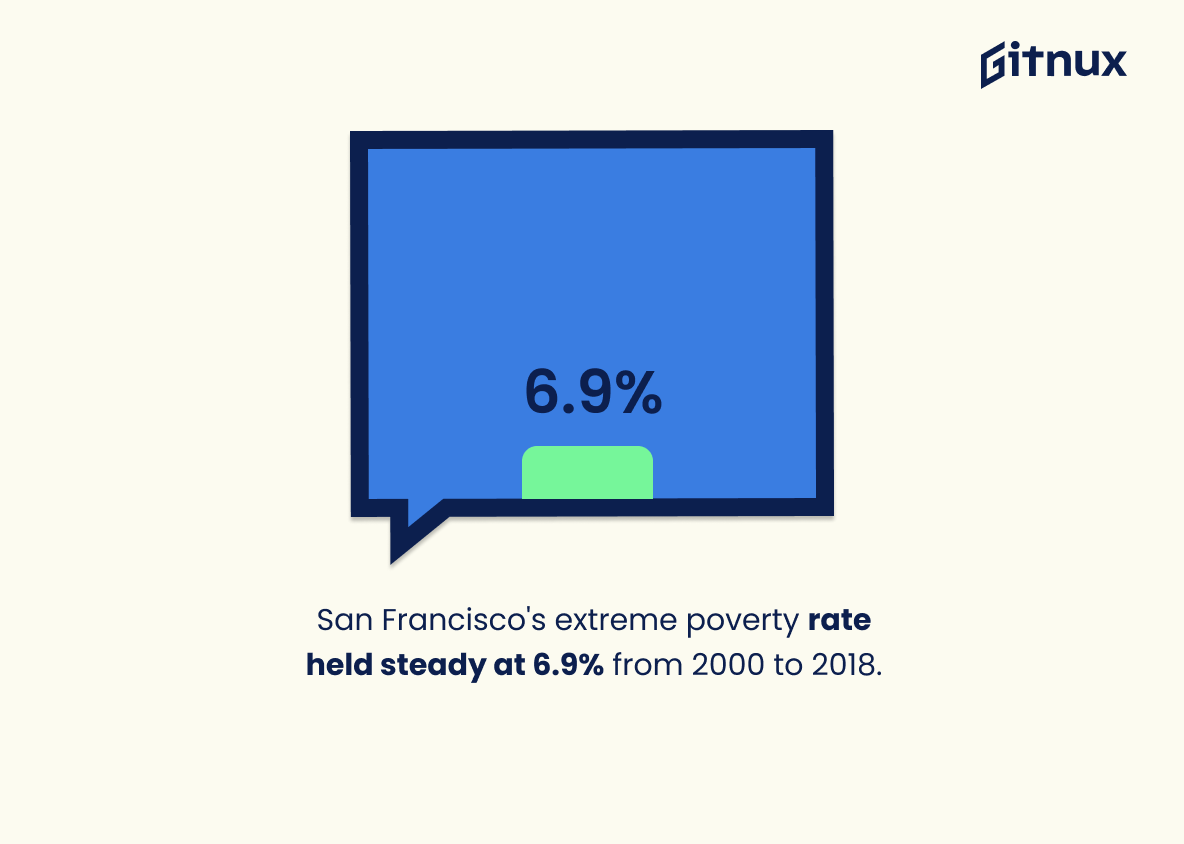
The percentage of San Francisco residents living in extreme poverty, earning less than $10,000 per year, has remained stable at 6.9% between 2000 to 2018.
This statistic is a telling indication of the financial stability of San Francisco residents. It shows that despite the economic growth of the city, the percentage of people living in extreme poverty has remained unchanged. This highlights the need for more effective policies to reduce poverty and ensure that all San Franciscans have access to the resources they need to thrive.
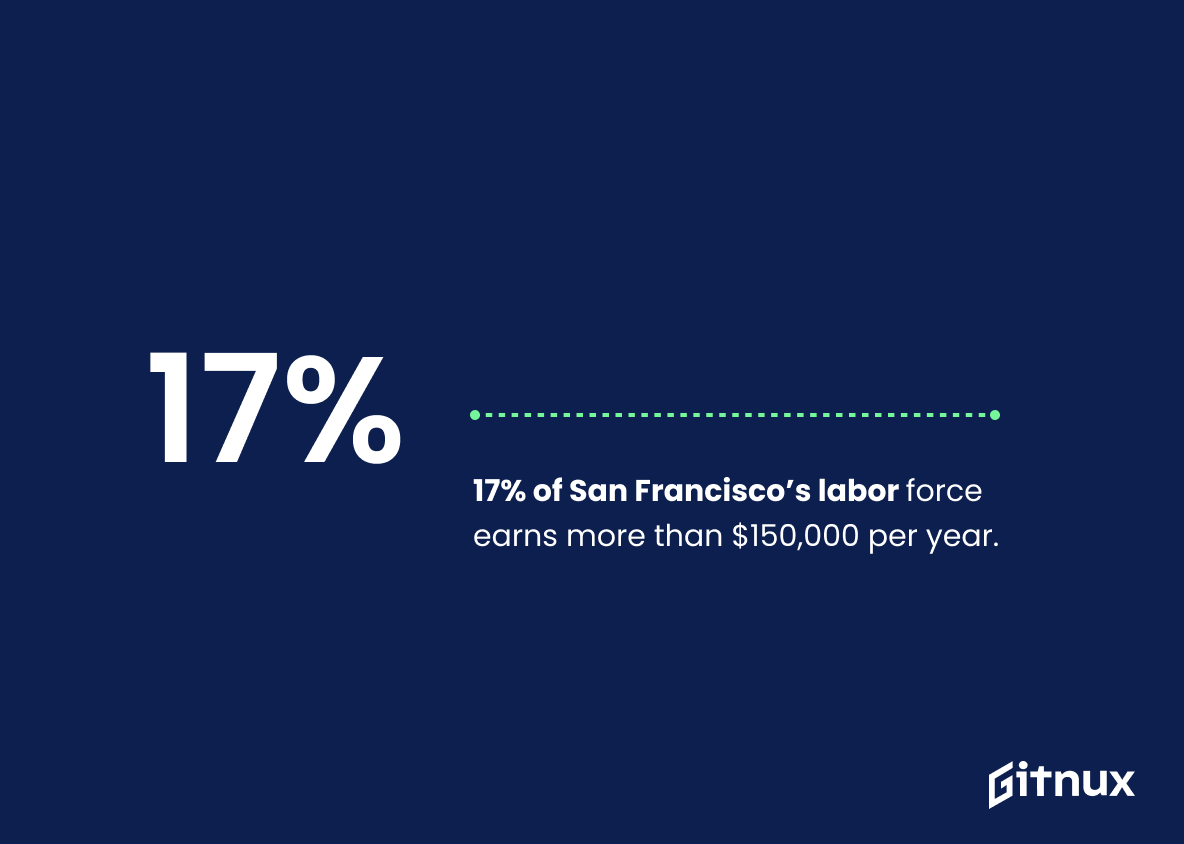
17% of San Francisco’s labor force earns more than $150,000 per year.
This statistic is a telling indication of the wealth disparity in San Francisco. It shows that a large portion of the city’s labor force is earning a significantly higher income than the majority of the population. This highlights the need for policies that can help bridge the gap between the wealthy and the rest of the city’s population.
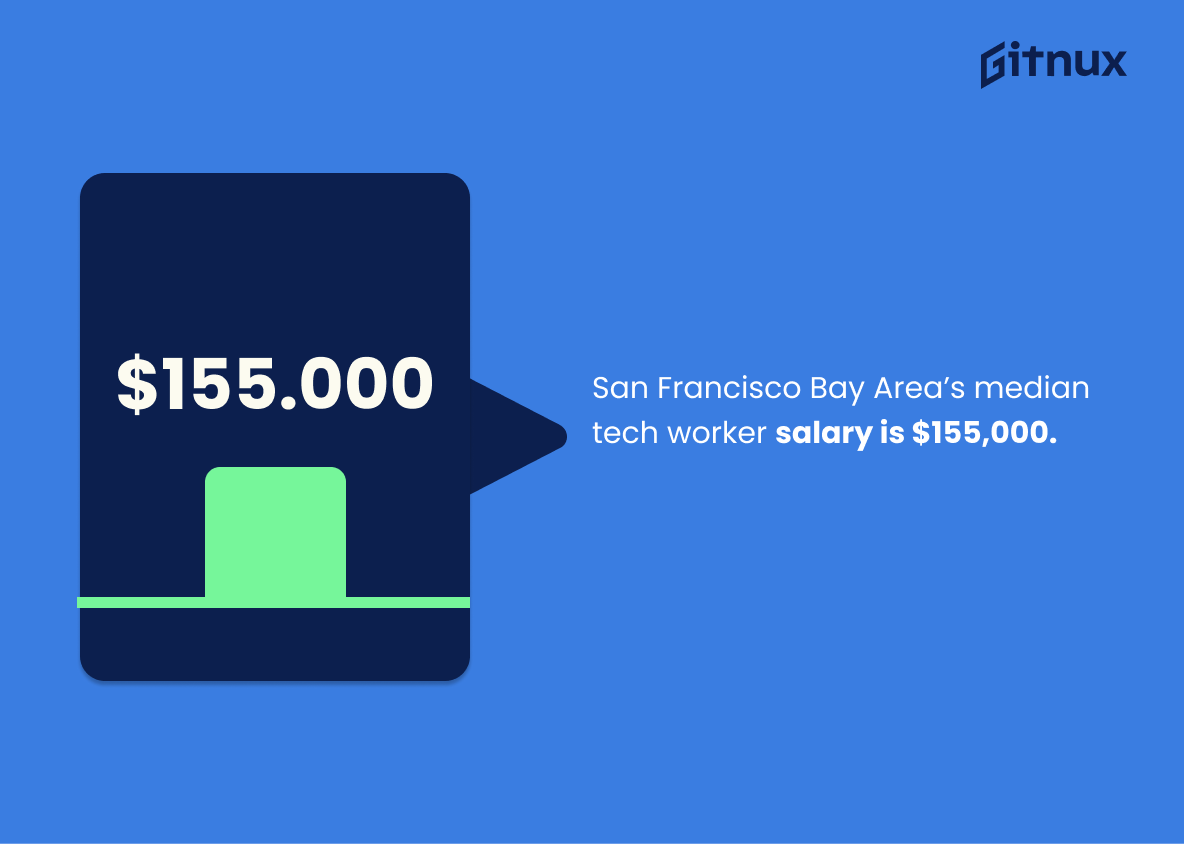
San Francisco Bay Area’s median tech worker salary is $155,000.
This statistic is a telling indication of the financial success of tech workers in the San Francisco Bay Area. It speaks to the high wages that tech workers can earn in the area, and the potential for a lucrative career in the tech industry. It also serves as a reminder of the stark economic divide between tech workers and other workers in the area, and the need for policies that ensure equitable access to economic opportunities.
Conclusion
San Francisco is a city of great wealth and opportunity, but it also has its share of economic disparities. The median household income in San Francisco is $123,859, the per capita income for San Franciscans is $62,785 and the median family income stands at an impressive $153,392. However, there are still pockets of poverty with 10.1% living below the poverty line and 6.9% earning less than $10k annually between 2000 and 2018; this number remains unchanged despite rapid growth in tech jobs during early 2010s which caused a 78% increase in rent while incomes only increased by 37%.
The racial wealth gap has widened significantly over time as well – white households have a median income of around 116K compared to 53K for Black households – highlighting how much more work needs to be done towards achieving true equity across all communities within San Francisco’s borders. Despite these issues, however, SF ranks 7th on US cities list with the highest numbers of millionaires per capita (17%) and boasts one of the highest medians incomes among 15 largest U.S. cities ($123k). It’s clear that although inequality persists throughout many parts of neighborhoods such as Mission district where families earn 51K or Sea Cliff neighborhood where they make 201K, overall prosperity continues to grow steadily year after year, making it an attractive destination for those seeking financial success.
References
0. – https://www.sfpublicpress.org
1. – https://www.sfgov.maps.arcgis.com
2. – https://www.datausa.io
3. – https://www.census.gov
4. – https://www.hoodline.com
5. – https://www.macrotrends.net
6. – https://www.sf.curbed.com
7. – https://www.businessinsider.com
8. – https://www.cnbc.com
