
In the ever-competitive world of the restaurant industry, success hinges on understanding and interpreting key data insights that drive strategic decision-making. Whether it’s boosting customer satisfaction, optimizing staff performance, or fine-tuning logistics to maximize profitability, the analysis of various restaurant metrics serves as a critical tool in unlocking an establishment’s full potential.
In this insightful blog post, we will delve into the essential restaurant metrics every restaurateur must be aware of in order to achieve long-term growth and sustainability. By getting a comprehensive overview and learning how to effectively leverage this valuable data, you will be better equipped to navigate the industry’s challenges and leverage hidden opportunities waiting to be discovered. So, let’s embark on this data-driven journey aimed at elevating your restaurant’s performance to unparalleled heights.
Restaurant Metrics You Should Know
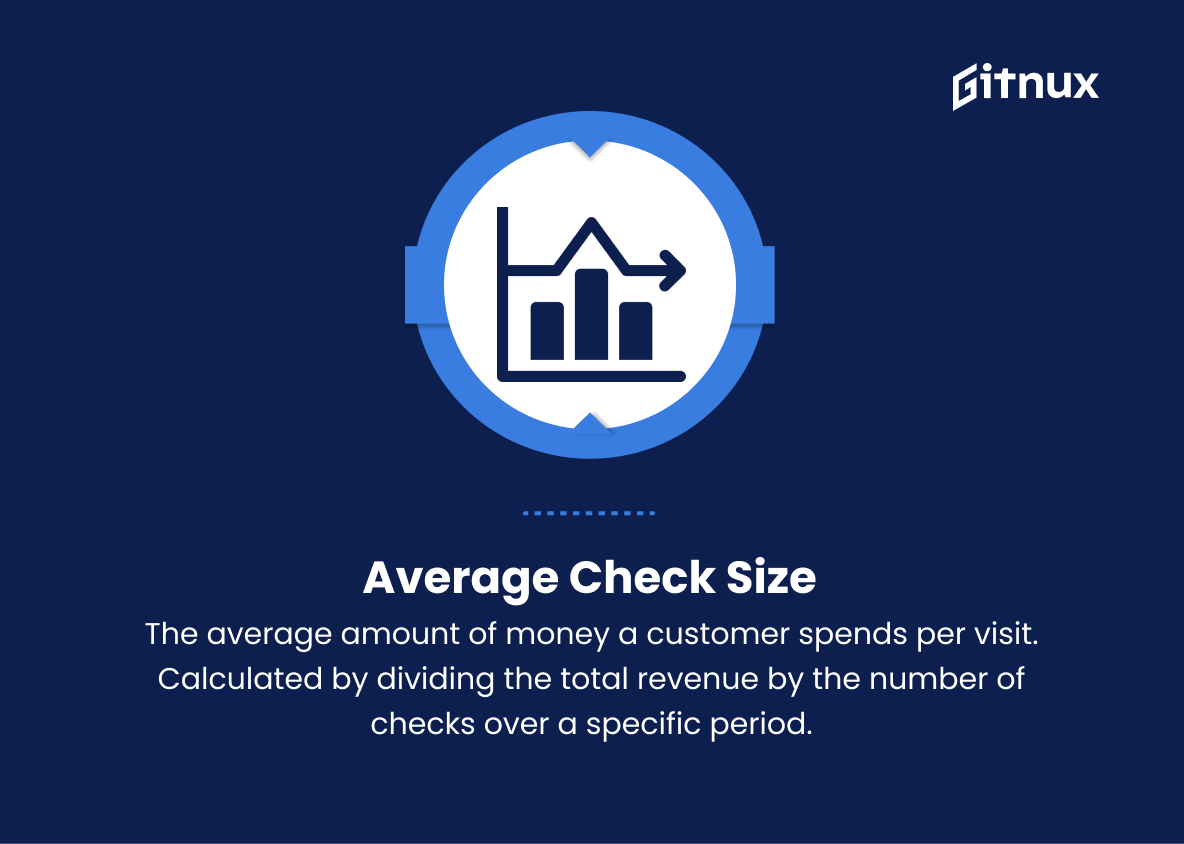
1. Average check size
The average amount of money a customer spends per visit. Calculated by dividing the total revenue by the number of checks over a specific period.
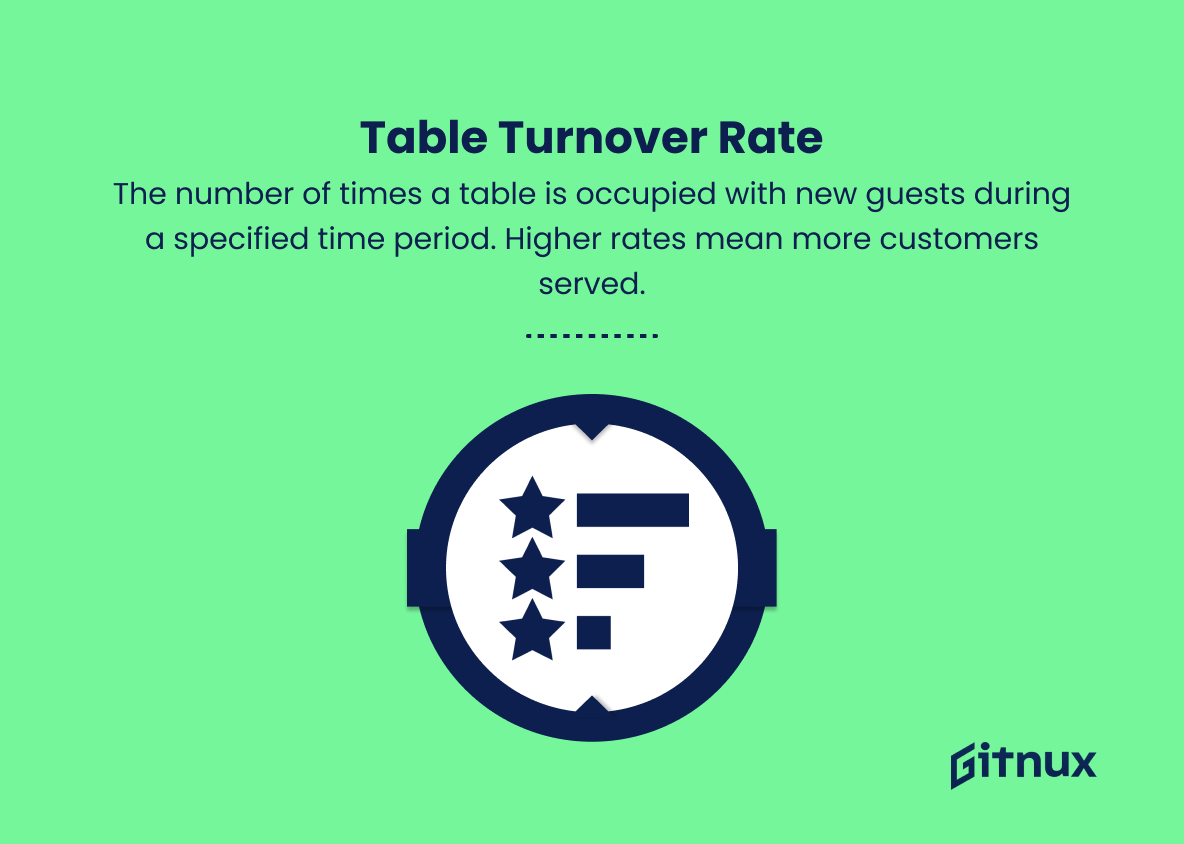
2. Table turnover rate
The number of times a table is occupied with new guests during a specified time period. Higher rates mean more customers served.
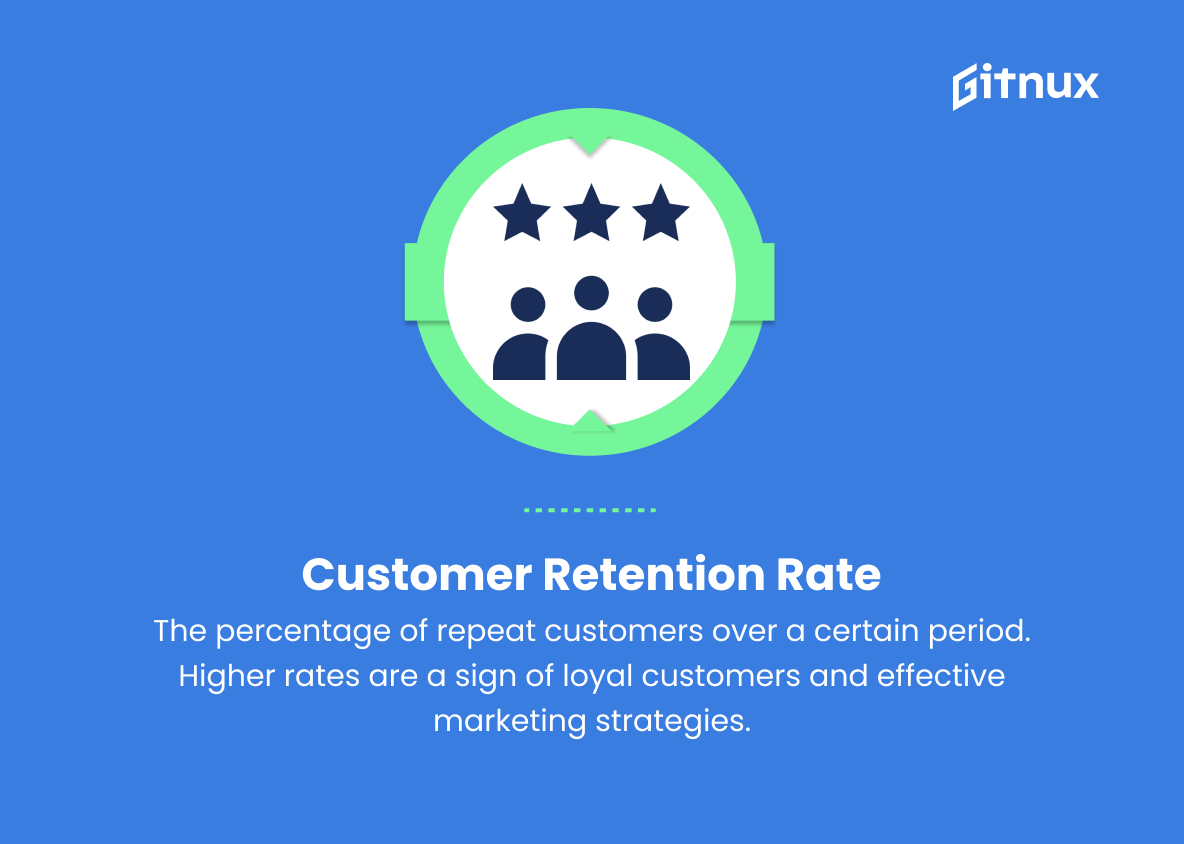
3. Customer retention rate
The percentage of repeat customers over a certain period. Higher rates are a sign of loyal customers and effective marketing strategies.
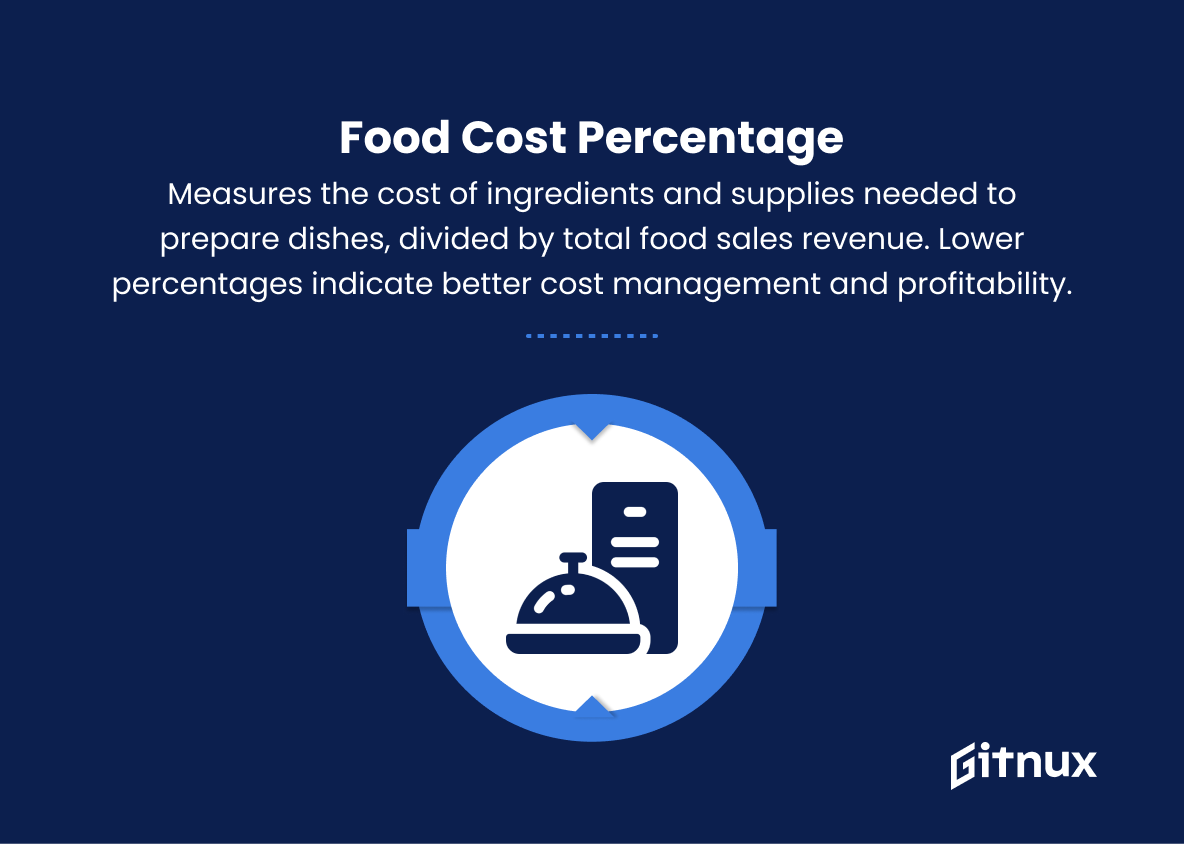
4. Food cost percentage
Measures the cost of ingredients and supplies needed to prepare dishes, divided by total food sales revenue. Lower percentages indicate better cost management and profitability.
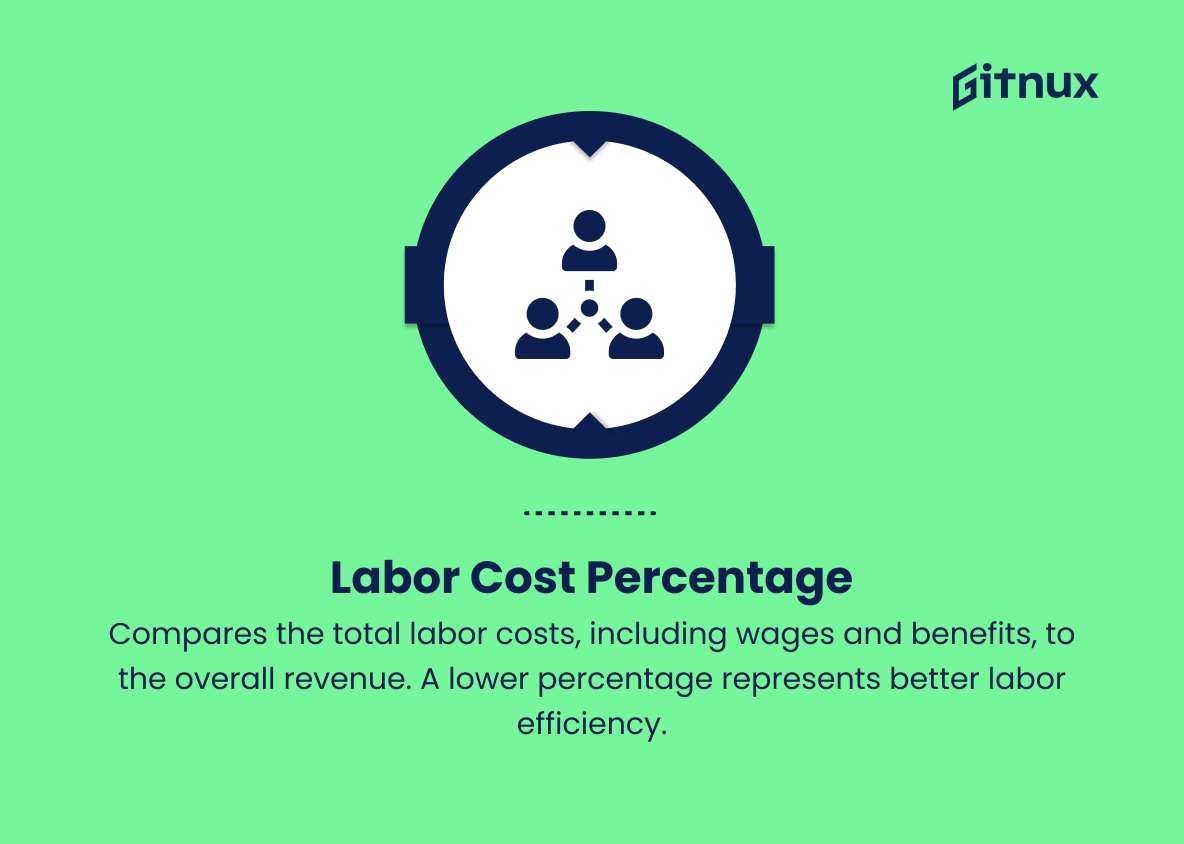
5. Labor cost percentage
Compares the total labor costs, including wages and benefits, to the overall revenue. A lower percentage represents better labor efficiency.
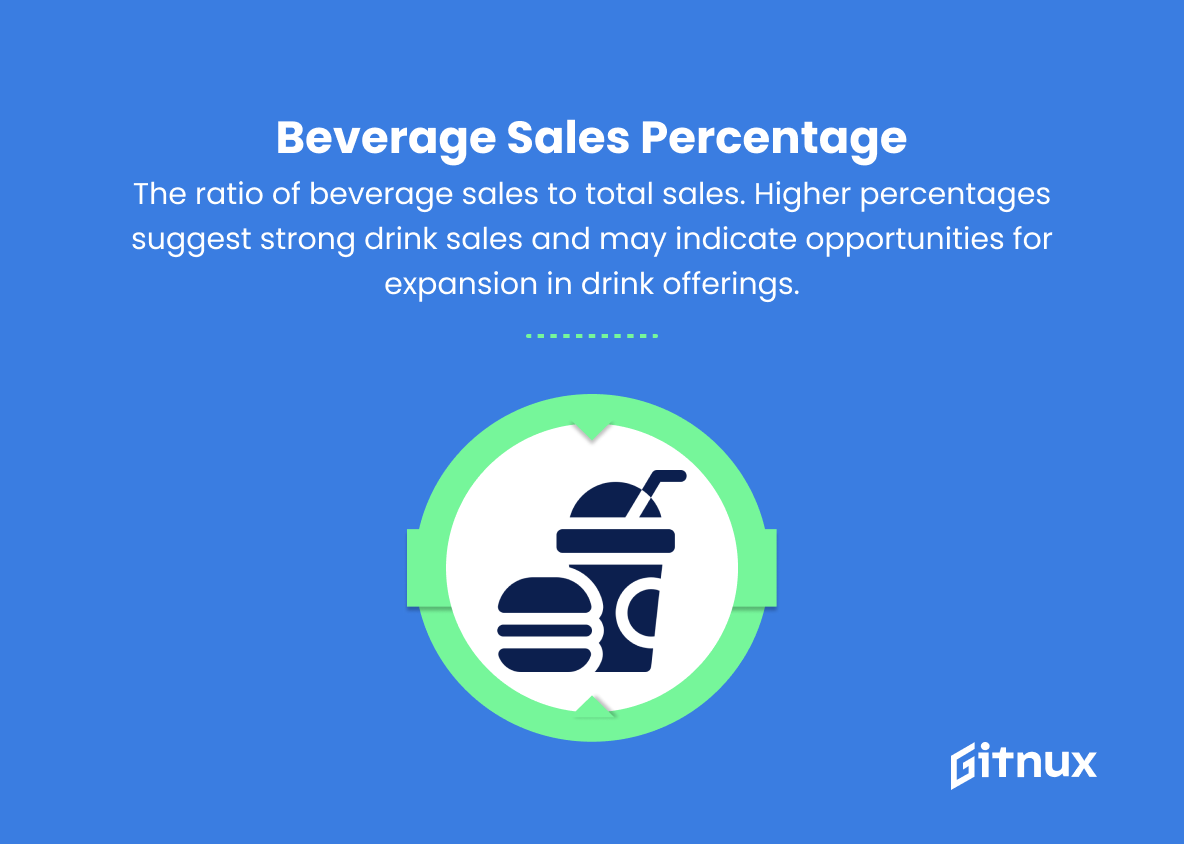
6. Beverage sales percentage
The ratio of beverage sales to total sales. Higher percentages suggest strong drink sales and may indicate opportunities for expansion in drink offerings.
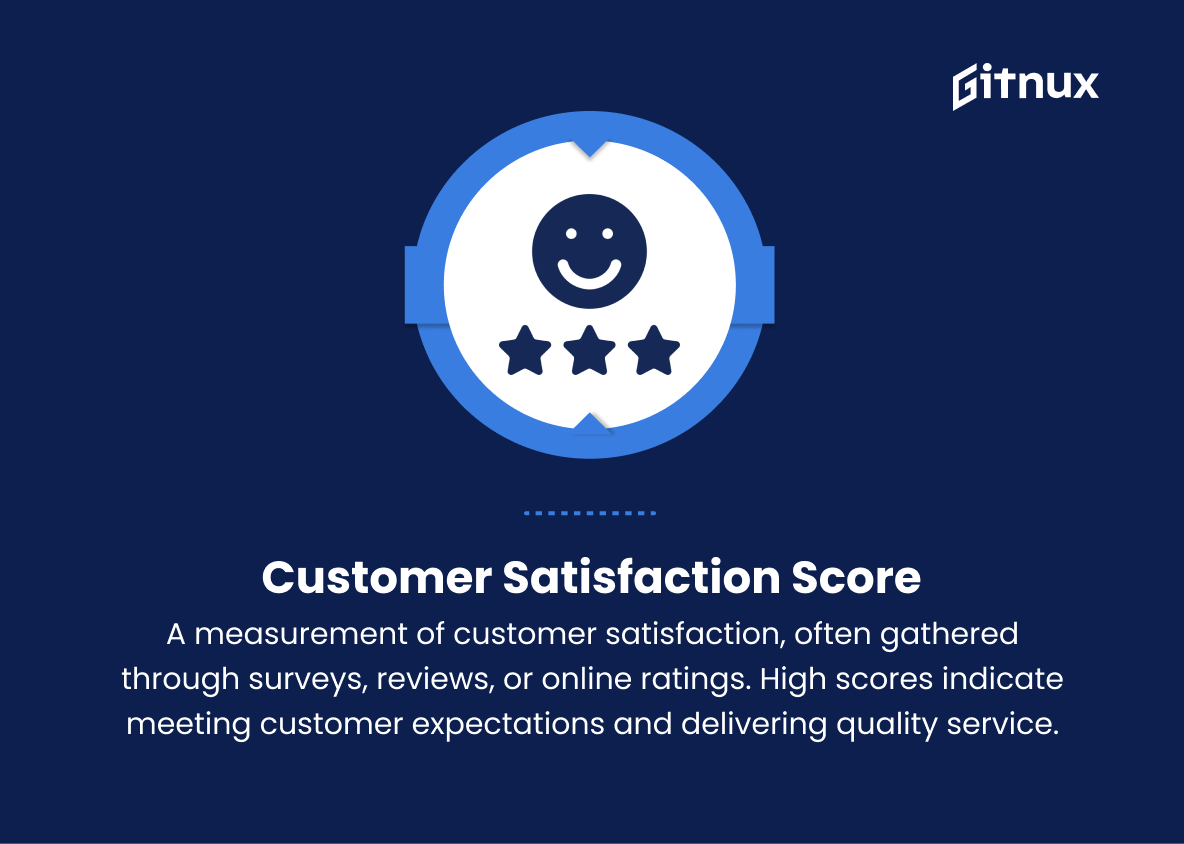
7. Customer satisfaction score
A measurement of customer satisfaction, often gathered through surveys, reviews, or online ratings. High scores indicate meeting customer expectations and delivering quality service.
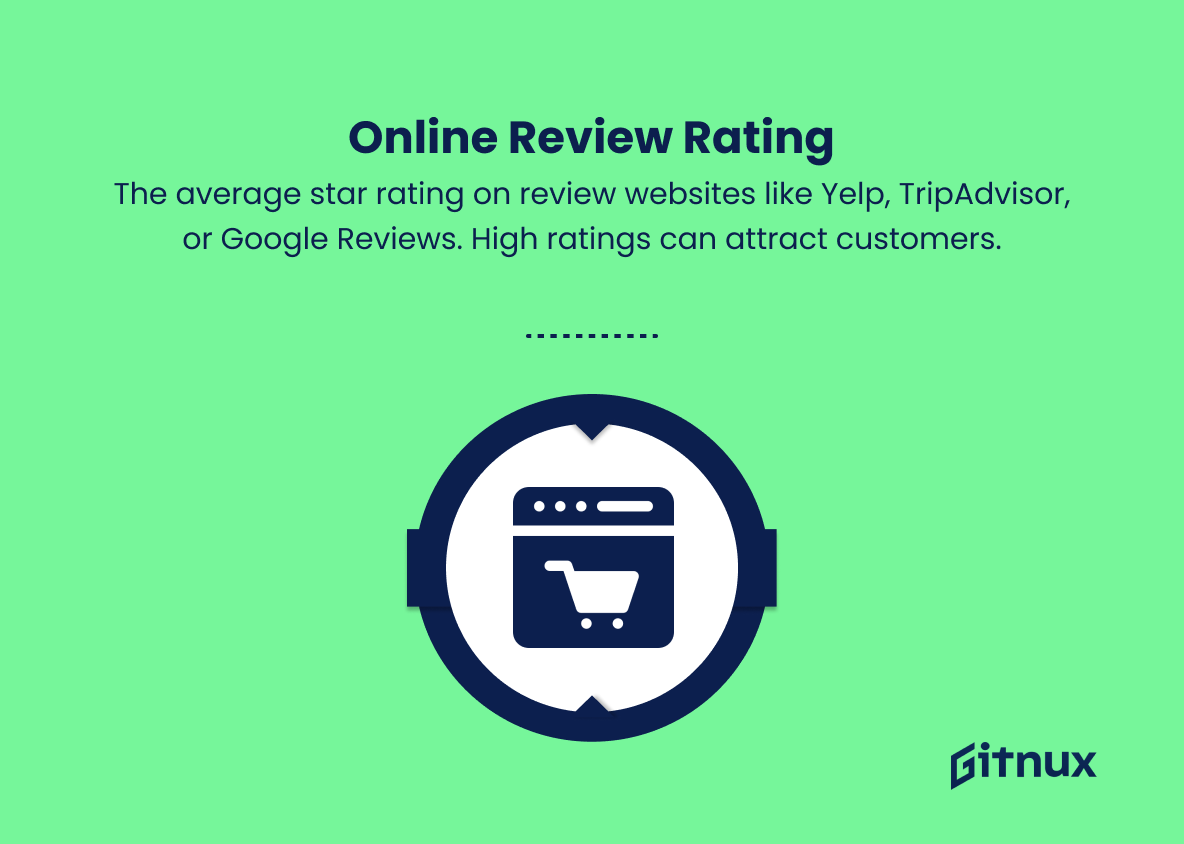
8. Online review rating
The average star rating on review websites like Yelp, TripAdvisor, or Google Reviews. High ratings can attract customers.
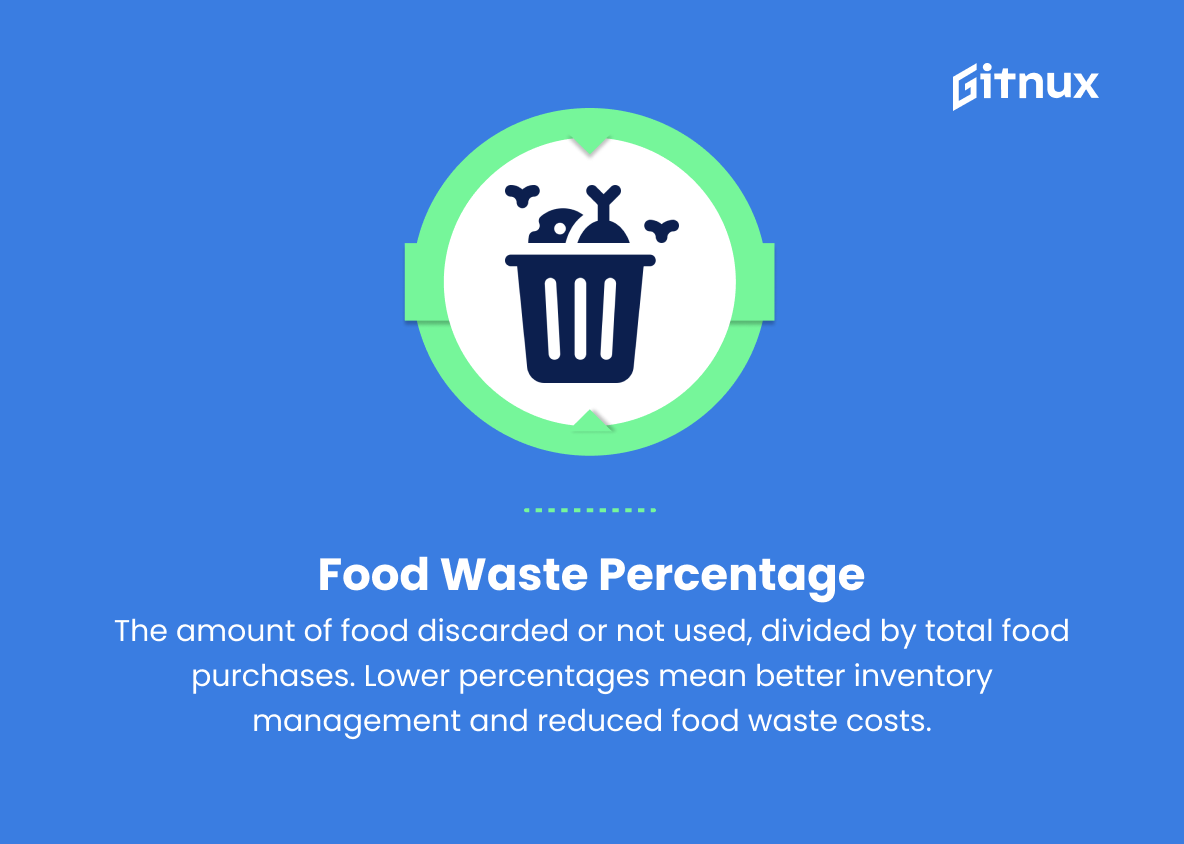
9. Food waste percentage
The amount of food discarded or not used, divided by total food purchases. Lower percentages mean better inventory management and reduced food waste costs.
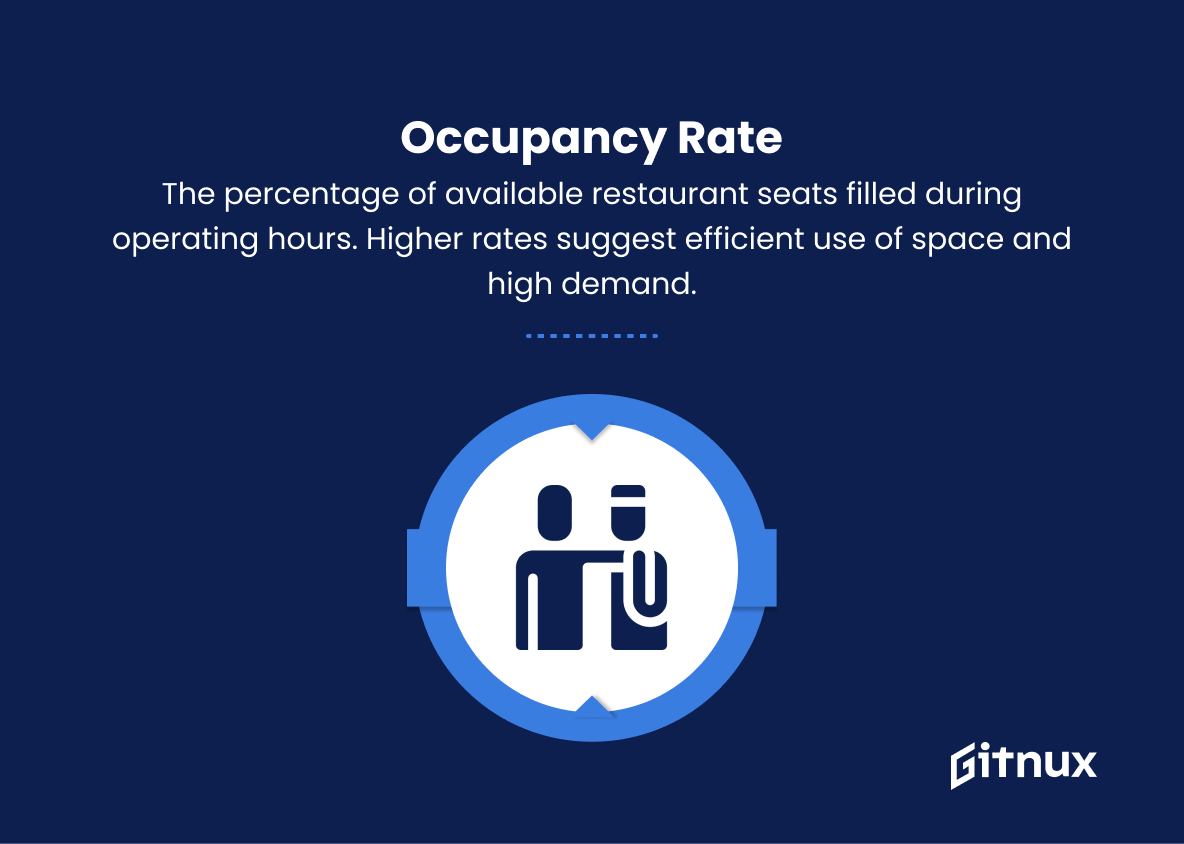
10. Occupancy rate
The percentage of available restaurant seats filled during operating hours. Higher rates suggest efficient use of space and high demand.
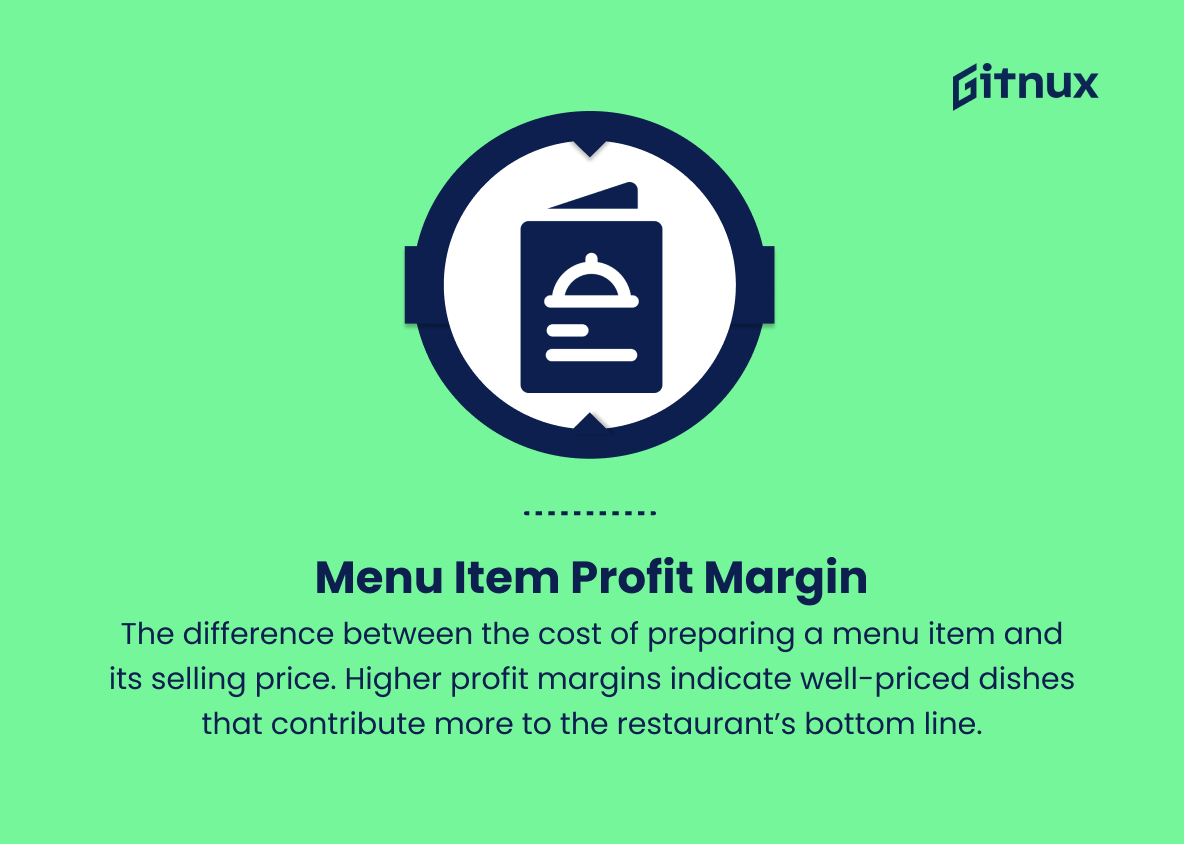
11. Menu item profit margin
The difference between the cost of preparing a menu item and its selling price. Higher profit margins indicate well-priced dishes that contribute more to the restaurant’s bottom line.
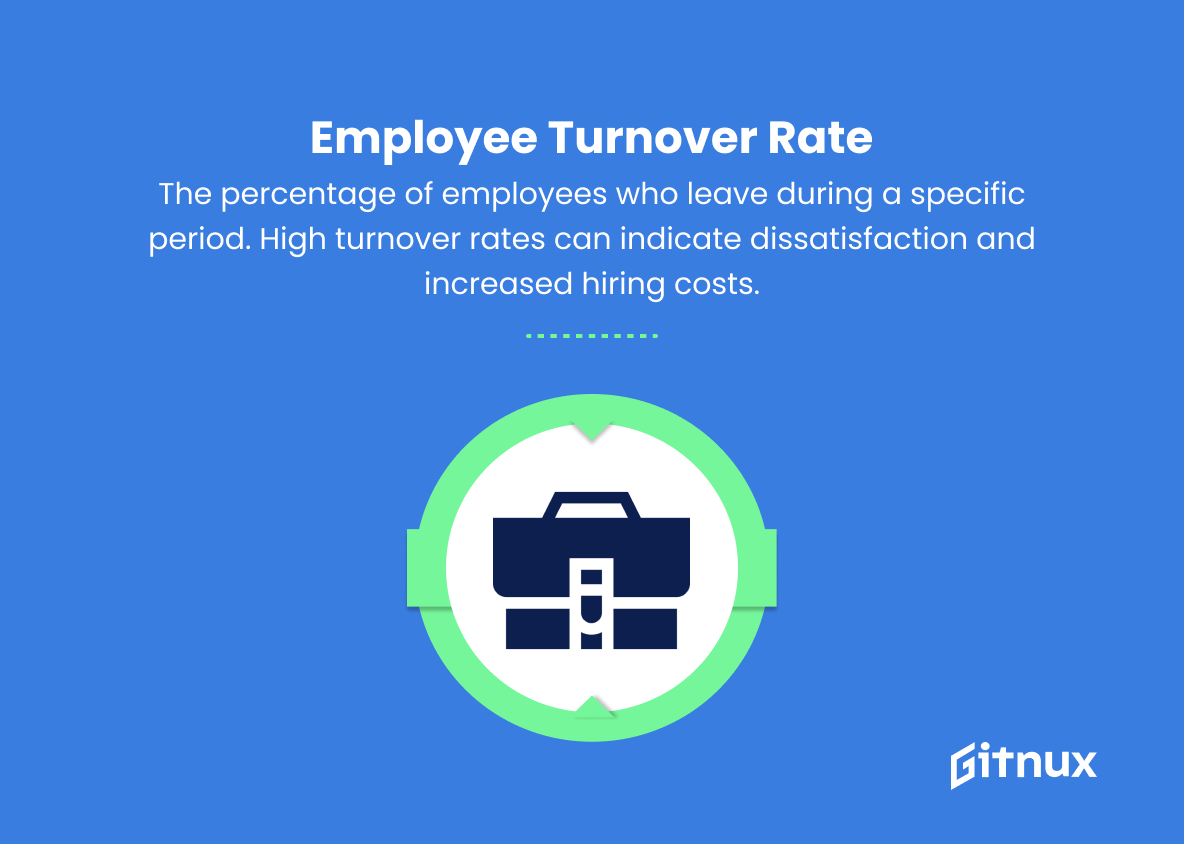
12. Employee turnover rate
The percentage of employees who leave during a specific period. High turnover rates can indicate dissatisfaction and increased hiring costs.
13. Social media engagement
The number of likes, comments, shares, and followers on social media platforms. Higher engagement rates indicate effective marketing efforts and customer connection.
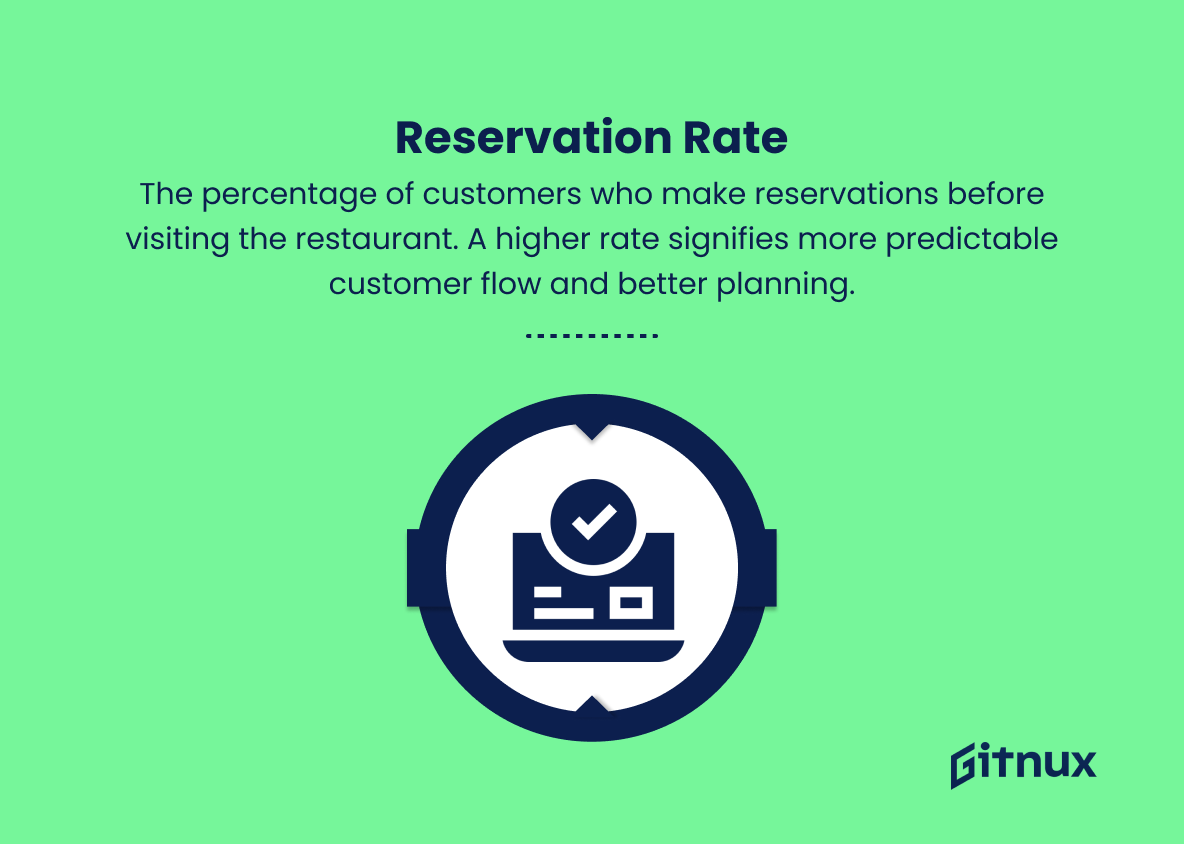
14. Reservation rate
The percentage of customers who make reservations before visiting the restaurant. A higher rate signifies more predictable customer flow and better planning.
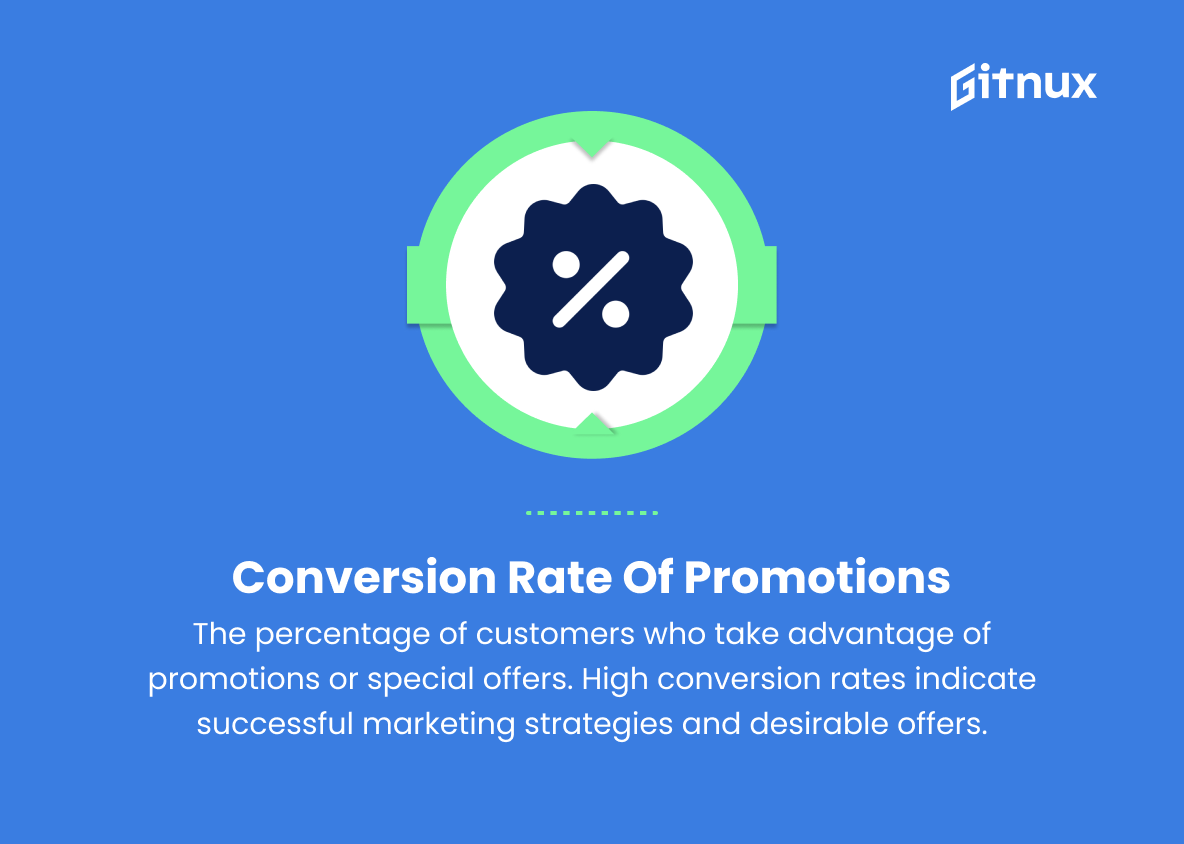
15. Conversion rate of promotions/special offers
The percentage of customers who take advantage of promotions or special offers. High conversion rates indicate successful marketing strategies and desirable offers.
16. Customer acquisition cost
The total amount spent on marketing, advertising, and promotions divided by the number of new customers acquired. Lower costs reflect more efficient acquisition strategies.
17. Average length of stay
The average time customers spend at the restaurant. Longer stays may indicate satisfaction, but could also mean slow service, depending on the restaurant type.
Restaurant Metrics Explained
Restaurant metrics play a vital role in measuring the overall performance and efficiency of a restaurant business. Metrics such as average check size, table turnover rate, and customer retention rate are essential indicators of customer spending behavior, capacity management, and customer loyalty, which all contribute to overall revenue. Food cost percentage, labor cost percentage, and beverage sales percentage help determine the profitability, cost management, and growth opportunities of the restaurant.
Meanwhile, customer satisfaction score, online review rating, and menu item profit margin highlight the importance of meeting customer expectations and offering quality products and services. Additionally, food waste percentage, occupancy rate, employee turnover rate, social media engagement, reservation rate, and conversion rate of promotions/special offers demonstrate the operational efficiency, marketing effectiveness, and ability to adapt to changing market trends.
By closely monitoring customer acquisition cost and average length of stay, restaurant operators can identify areas where they need to focus resources to increase customer satisfaction or optimize service speed to maintain competitiveness in an ever-evolving industry.
Conclusion
Understanding and monitoring your restaurant metrics is essential to your business’s success. By keeping an eye on essential KPIs, you will be able to make more informed decisions, improve operations, enhance customer satisfaction, and ultimately increase profitability. The key is to choose the right set of metrics that align with your business objectives and use the insights to continuously fine-tune your strategies for long-term success. Remember, “what gets measured gets managed,” and in the competitive world of the restaurant industry, staying on top of your metrics is a recipe for triumph.
