
In today’s fast-paced digital world, businesses and organizations rely heavily on cloud-based services and applications to run and manage their day-to-day operations. One of the key aspects in ensuring smooth operations and consistent performance of these services is monitoring vital metrics and logging information. Lambda CloudWatch Metrics, a powerful and advanced monitoring tool, provides an unparalleled level of insight into your AWS Lambda functions, allowing you to optimize performance, troubleshoot any issues, and ultimately make informed decisions to enhance and streamline your cloud services.
This comprehensive blog post will delve into the essential concepts and key features underpinning Lambda CloudWatch Metrics, highlighting its impact and significance in maintaining seamless, efficient cloud operations.
Lambda CloudWatch Metrics You Should Know
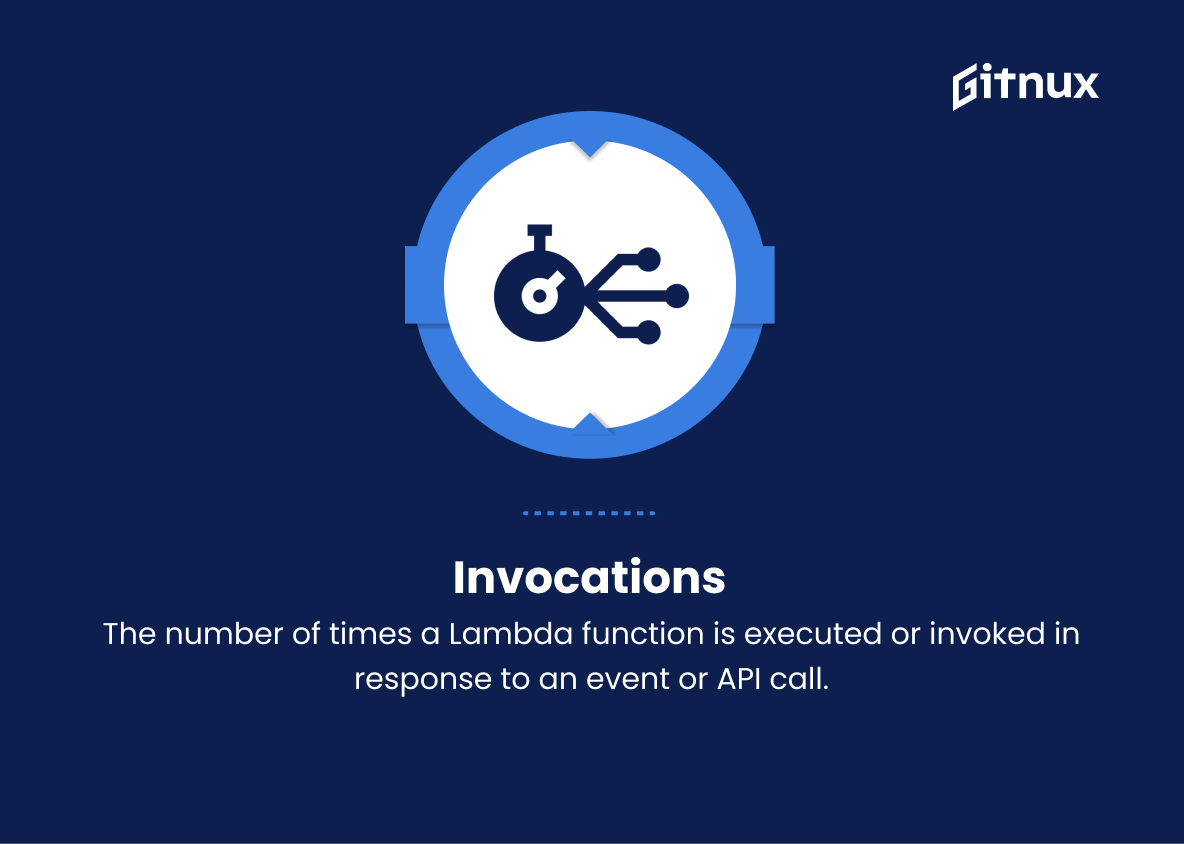
1. Invocations
The number of times a Lambda function is executed or invoked in response to an event or API call.
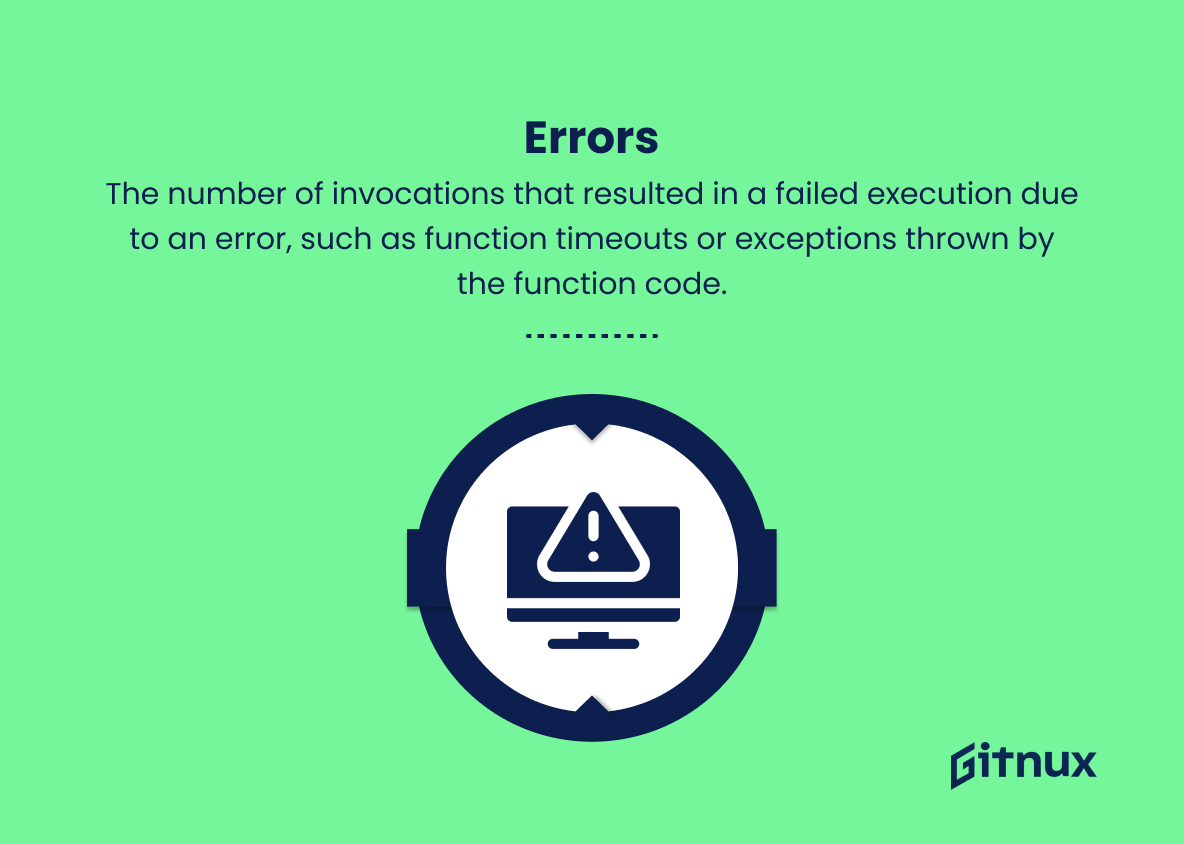
2. Errors
The number of invocations that resulted in a failed execution due to an error, such as function timeouts or exceptions thrown by the function code.
3. Duration
The amount of time it takes for a Lambda function to execute, measured in milliseconds. This duration begins when AWS Lambda receives a request, and ends when the execution is complete.
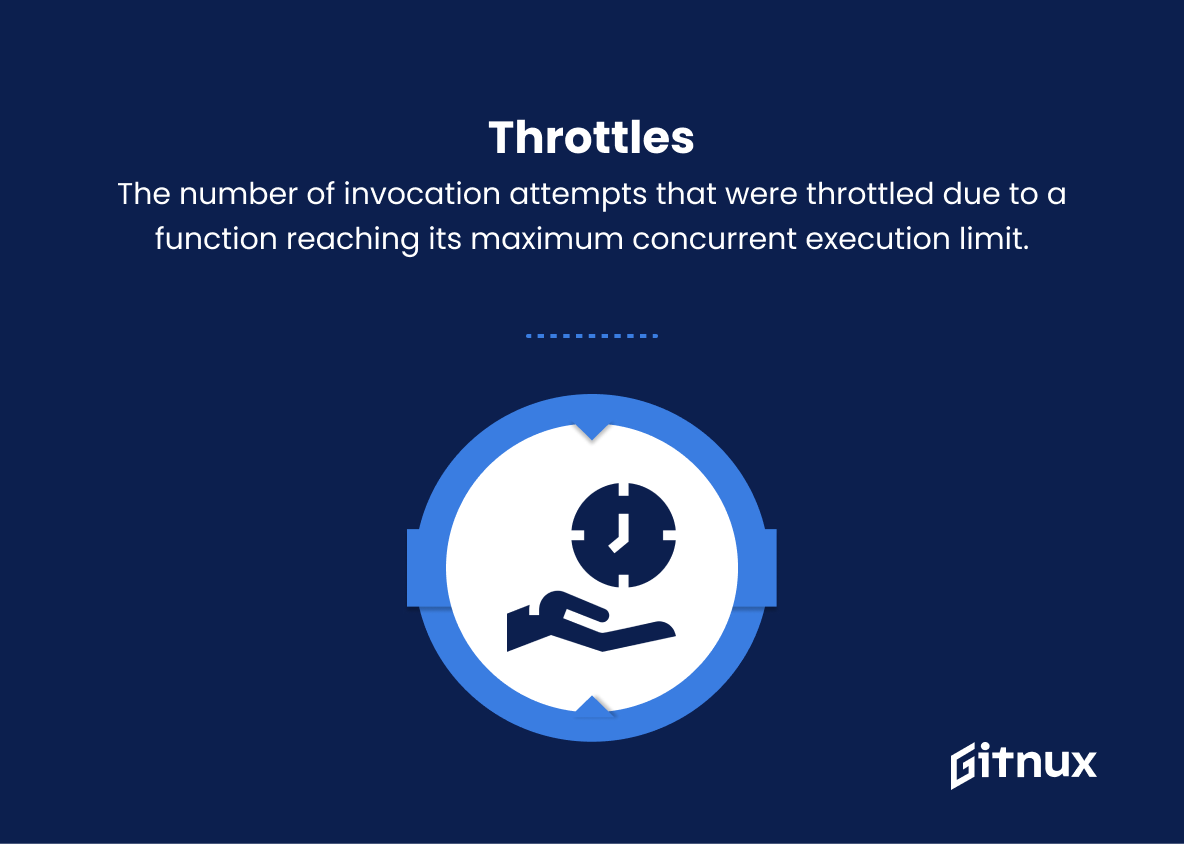
4. Throttles
The number of invocation attempts that were throttled due to a function reaching its maximum concurrent execution limit.
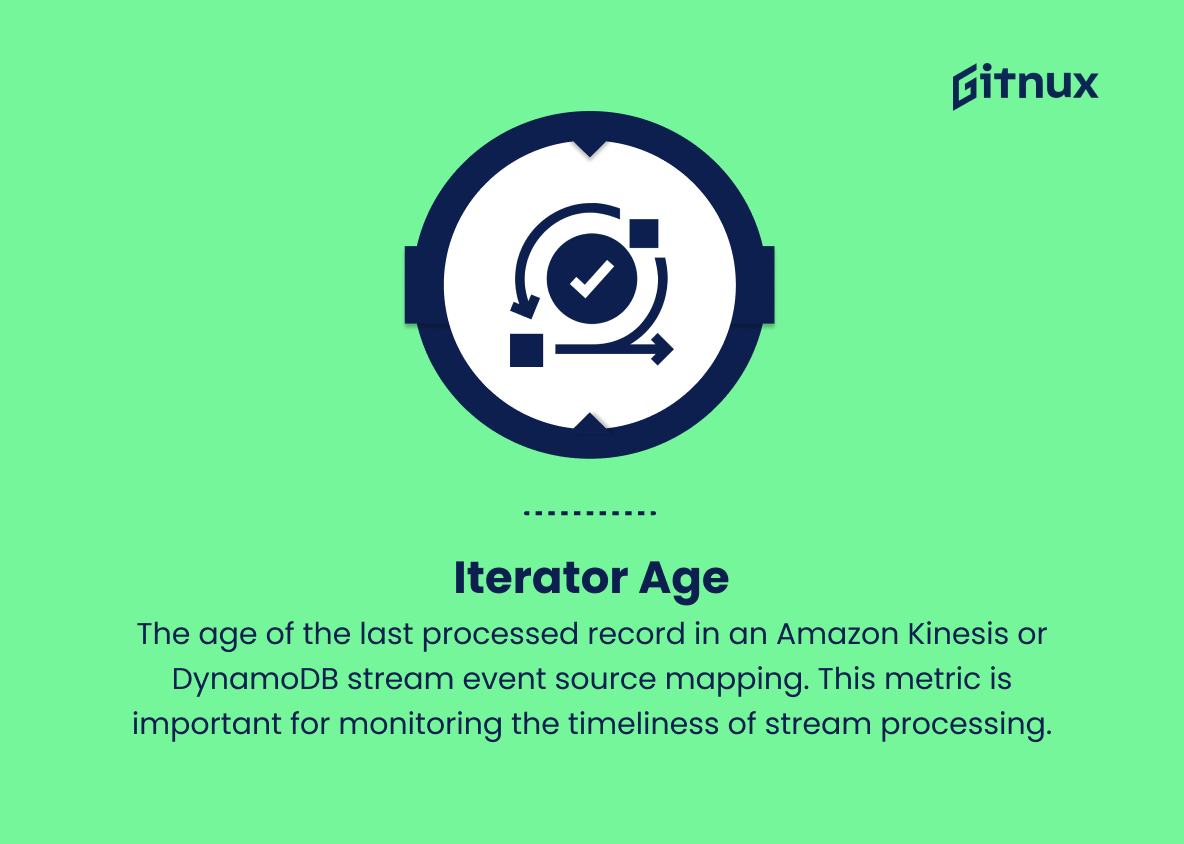
5. Iterator Age
The age of the last processed record in an Amazon Kinesis or DynamoDB stream event source mapping. This metric is important for monitoring the timeliness of stream processing.
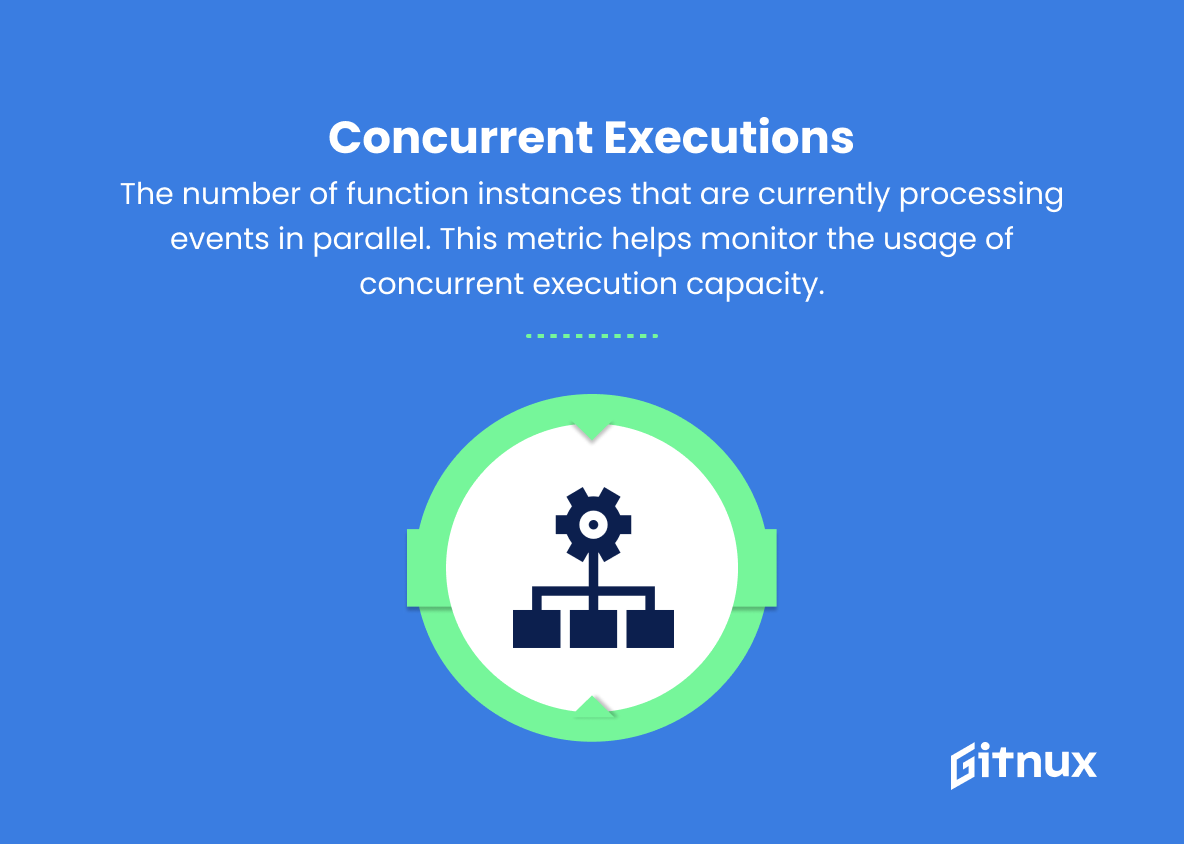
6. Concurrent Executions
The number of function instances that are currently processing events in parallel. This metric helps monitor the usage of concurrent execution capacity.
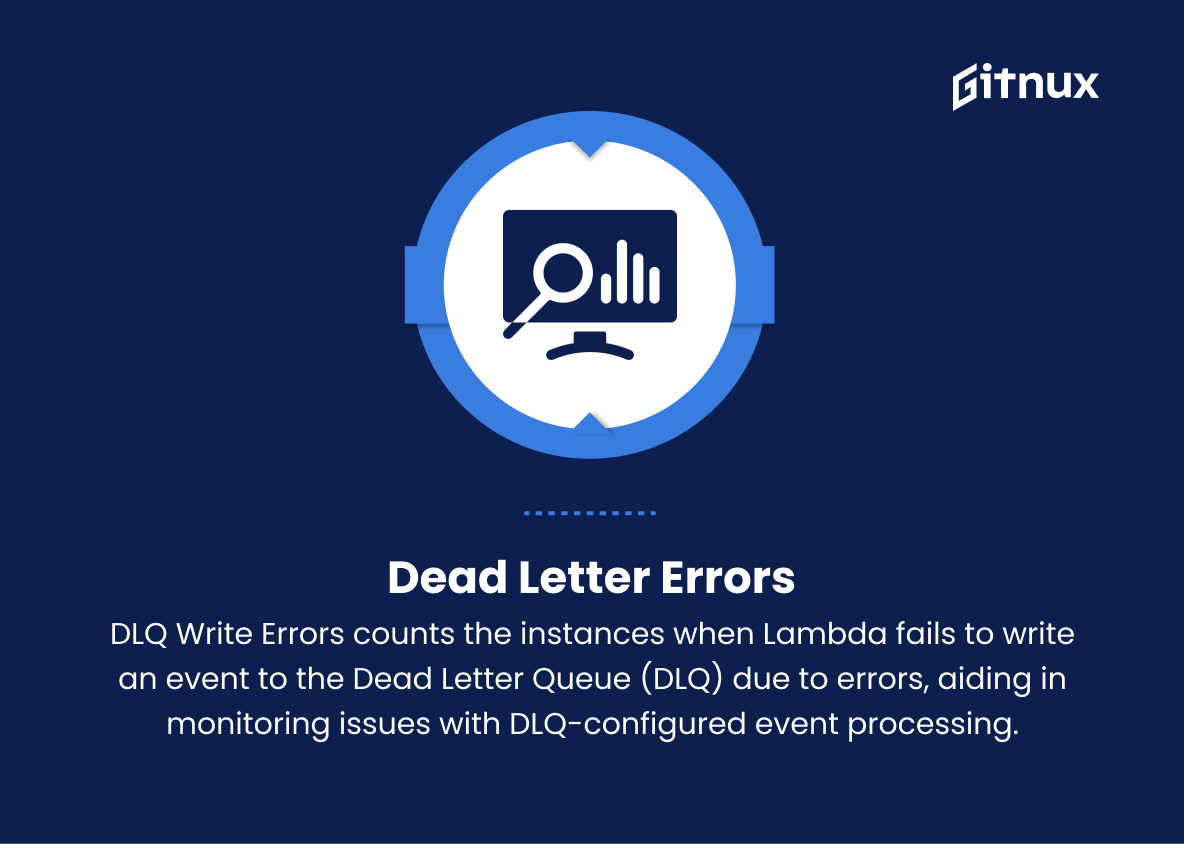
7. Dead Letter Errors
The number of times Lambda could not write an event to the Dead Letter Queue (DLQ) because of an error. This can help track issues when a DLQ is configured for a function to handle failed event processing.
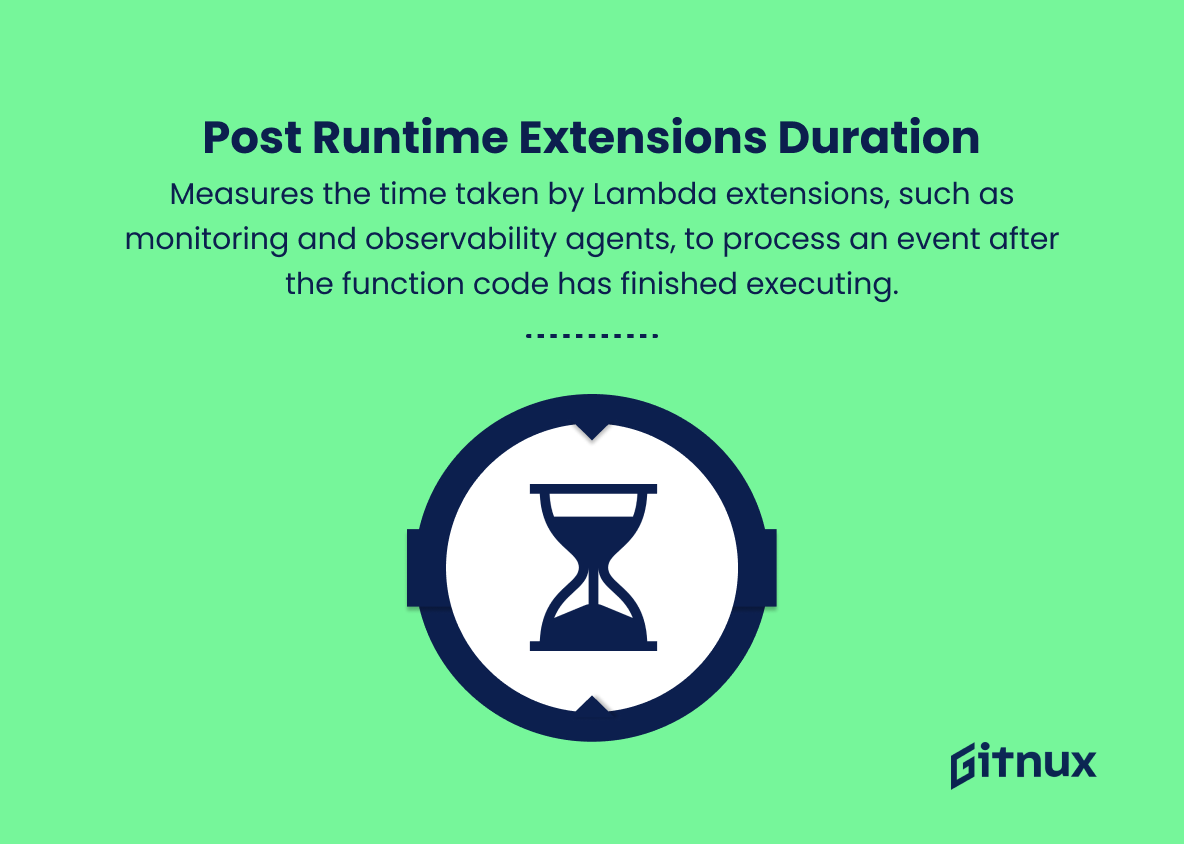
8. Post Runtime Extensions Duration
Measures the time taken by Lambda extensions, such as monitoring and observability agents, to process an event after the function code has finished executing.
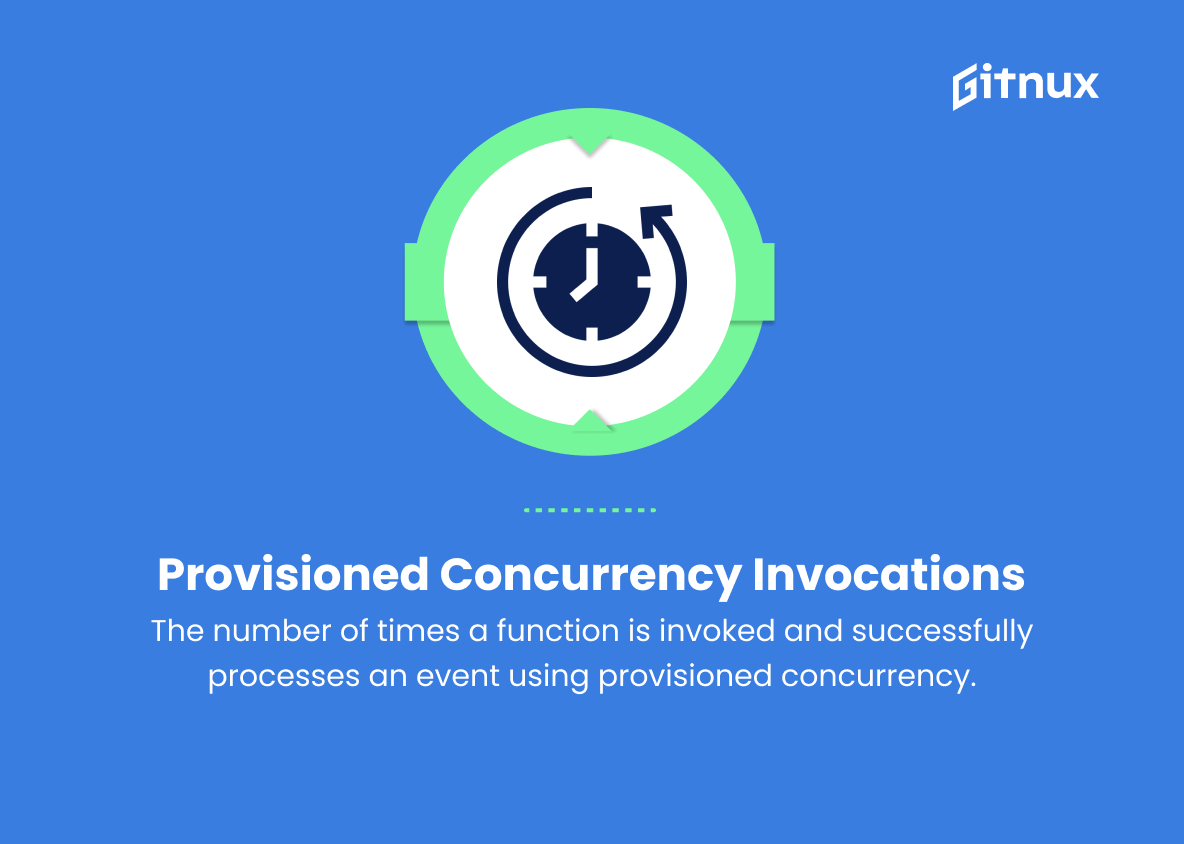
9. Provisioned Concurrency Invocations
The number of times a function is invoked and successfully processes an event using provisioned concurrency.
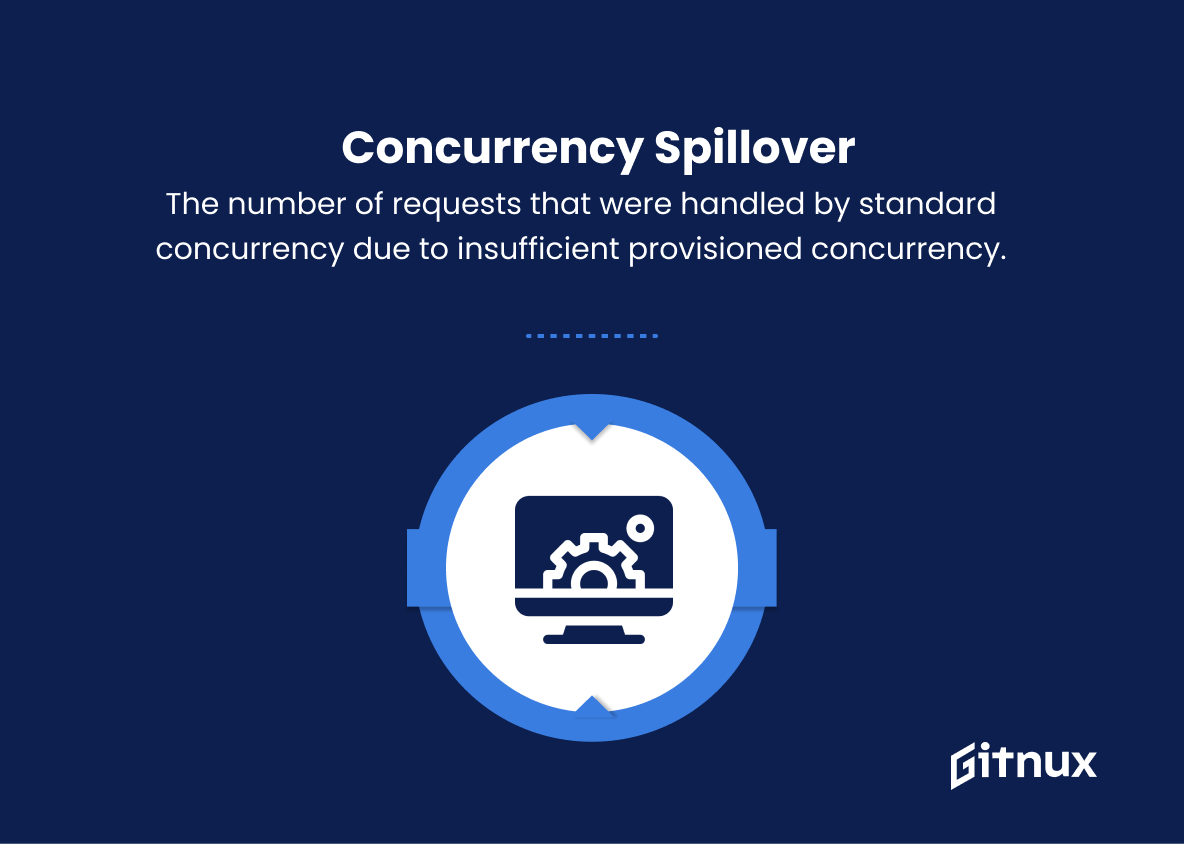
10. Provisioned Concurrency Spillover Invocations
The number of requests that were handled by standard concurrency due to insufficient provisioned concurrency.
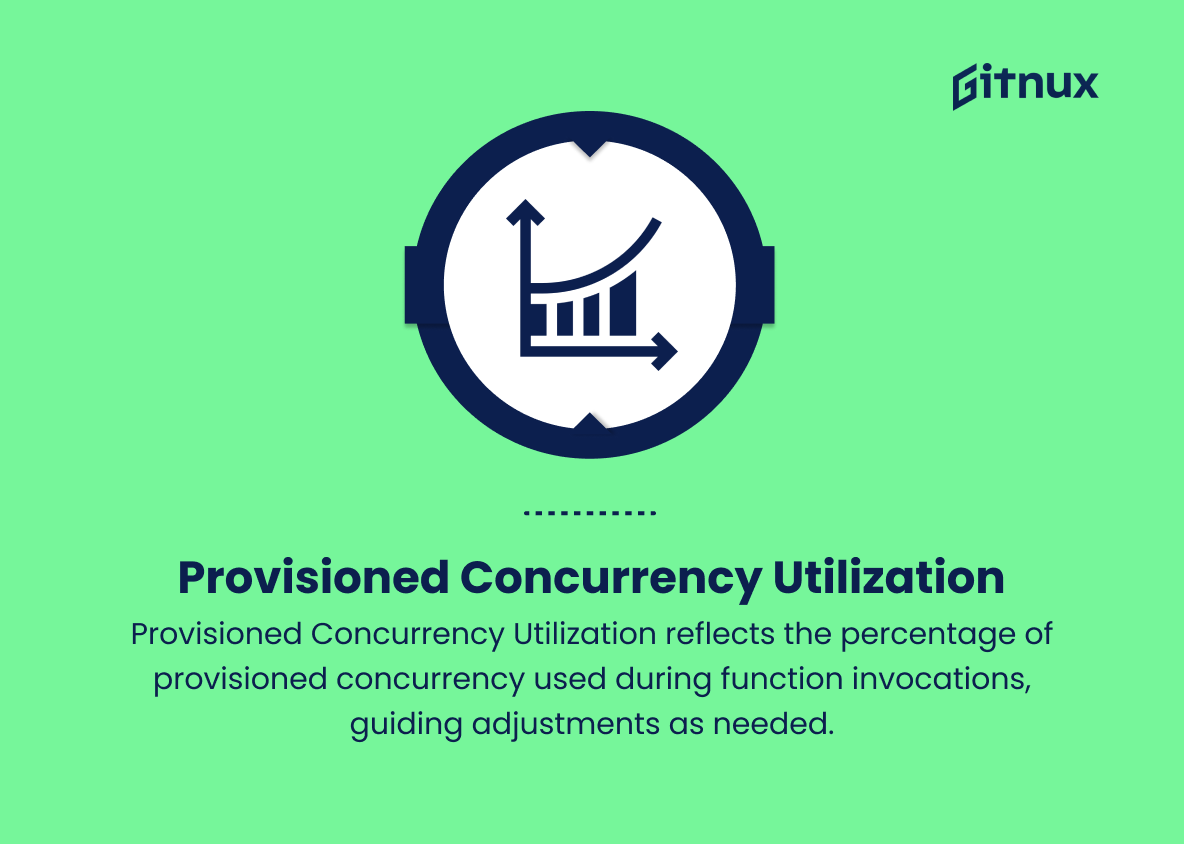
11. Provisioned Concurrency Utilization
The percentage of configured provisioned concurrency that is being used during function invocations. This metric helps identify when it’s necessary to increase or decrease the provisioned concurrency settings.
These AWS Lambda CloudWatch metrics provide key insights into function performance, error rates, capacity utilization, and other factors that help optimize and troubleshoot Lambda functions.
Lambda Cloudwatch Metrics Explained
The AWS Lambda CloudWatch metrics are critical to understanding the performance, efficiency, and robustness of your Lambda functions. Invocations give you an idea of how frequently your function is being called, while Errors and Duration help you identify issues and bottlenecks in your function’s execution. Throttles reveal potential concurrency limitations, and Iterator Age allows you to monitor the timeliness of stream processing.
Concurrent Executions provide insight into the utilization of concurrent execution capacity, and Dead Letter Errors help you track issues with failed event processing. Post Runtime Extensions Duration helps you gauge the impact of Lambda extensions on overall execution time, and the Provisioned Concurrency-related metrics give you insights on how well your provisioned concurrency settings are handling demand. By monitoring these metrics, you can optimize your Lambda functions, detect and resolve issues more efficiently, and improve the overall performance of your serverless applications.
Conclusion
In summary, Amazon CloudWatch Metrics plays a crucial role in the effective monitoring, management, and optimization of AWS Lambda functions. By leveraging these robust metrics, developers and administrators can gain invaluable insights into their functions’ performance, spot issues, and make data-driven decisions to enhance the overall efficiency of their serverless applications.
Staying on top of these critical metrics not only contributes to streamlined operations but also helps in maintaining high quality and responsive cloud infrastructure. As the world of serverless computing continues to evolve, harnessing the power of Lambda CloudWatch Metrics is vital for staying ahead of the curve and achieving optimal performance in the rapidly changing cloud environment.
