The ever-evolving landscape of Information Technology (IT) has demonstrated the immense value and impact that it can have on businesses and organizations across all industries. In today’s data-driven world, tracking the effectiveness and efficiency of IT processes is essential for maintaining a competitive edge in the market. As such, Information Technology Metrics have emerged as a critical tool for assessing the performance of IT systems and gauging the return on investments in new technologies.
This blog post will delve into the significance and application of these vital metrics, providing readers with a comprehensive understanding of the key indicators that must be considered in order to optimize IT strategies for sustained success.
Information Technology Metrics You Should Know
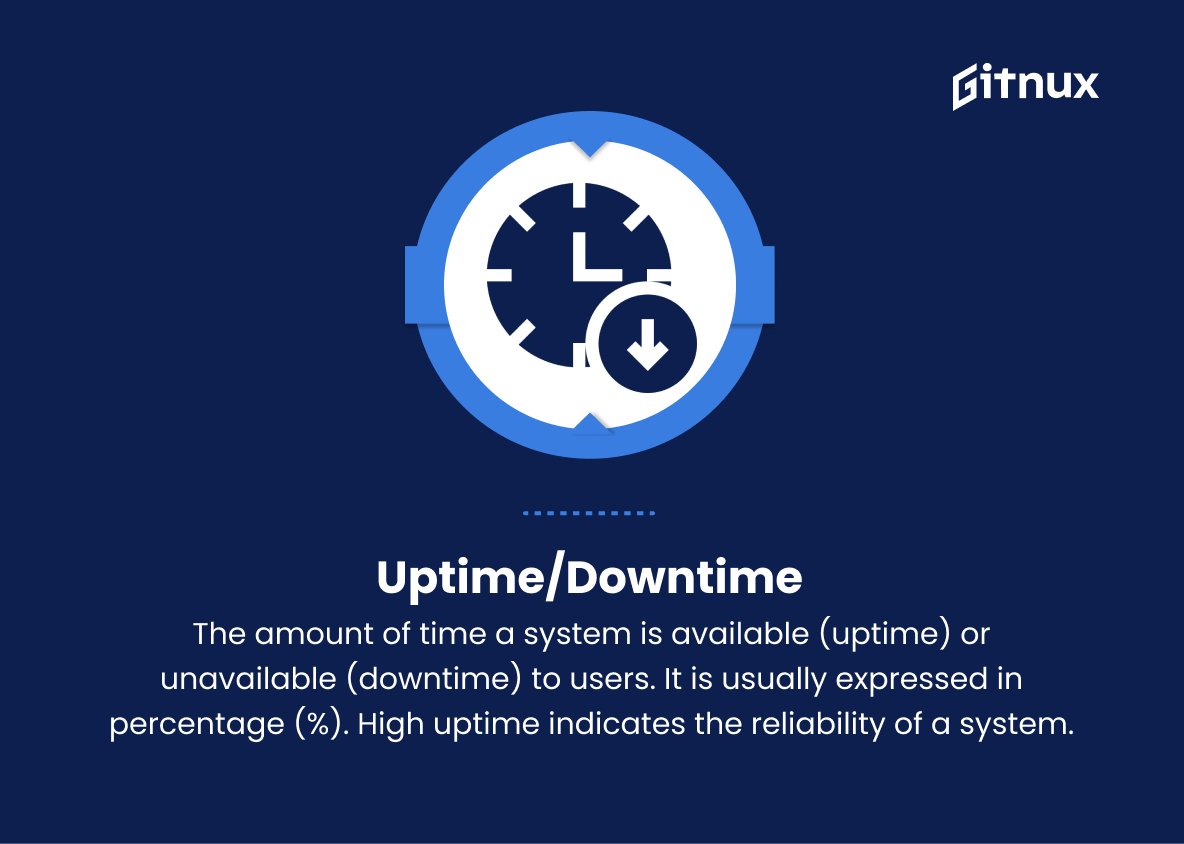
1. Uptime/Downtime
The amount of time a system is available (uptime) or unavailable (downtime) to users. It is usually expressed in percentage (%). High uptime indicates the reliability of a system.
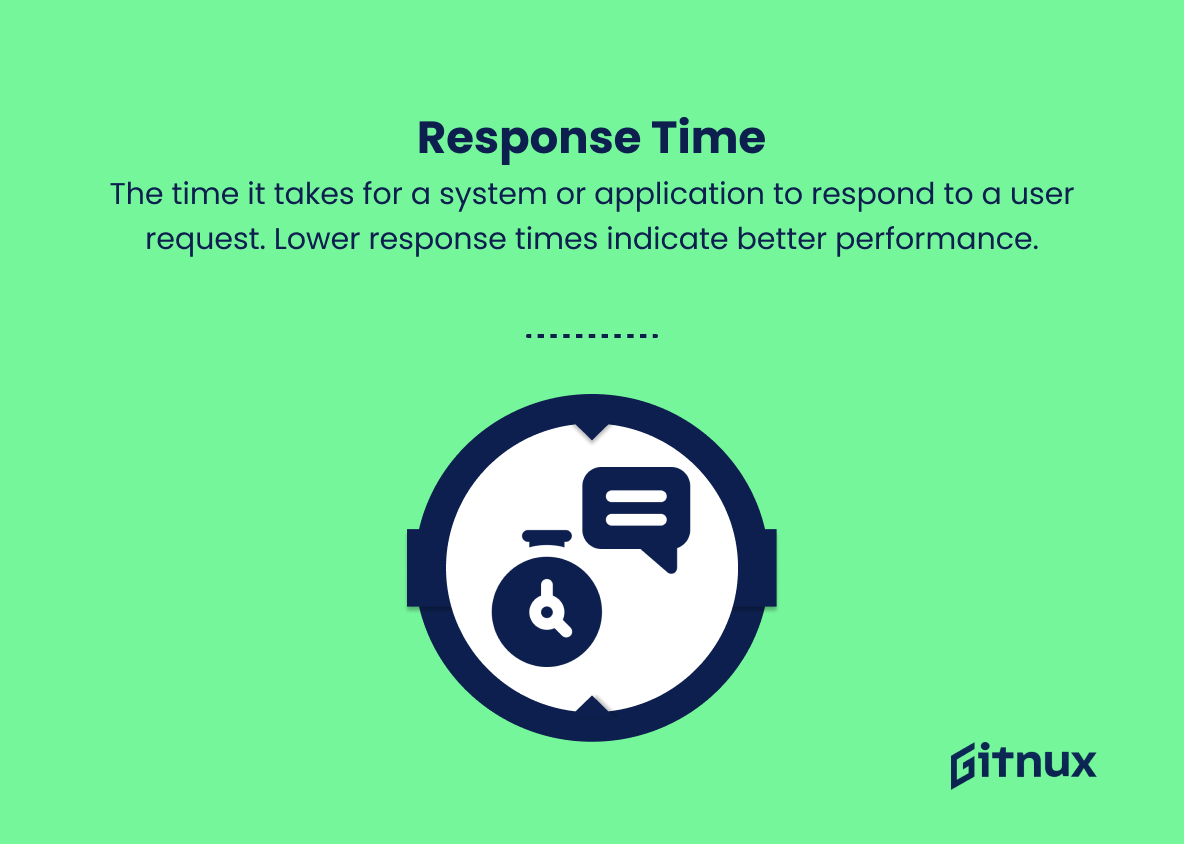
2. Response time
The time it takes for a system or application to respond to a user request. Lower response times indicate better performance.
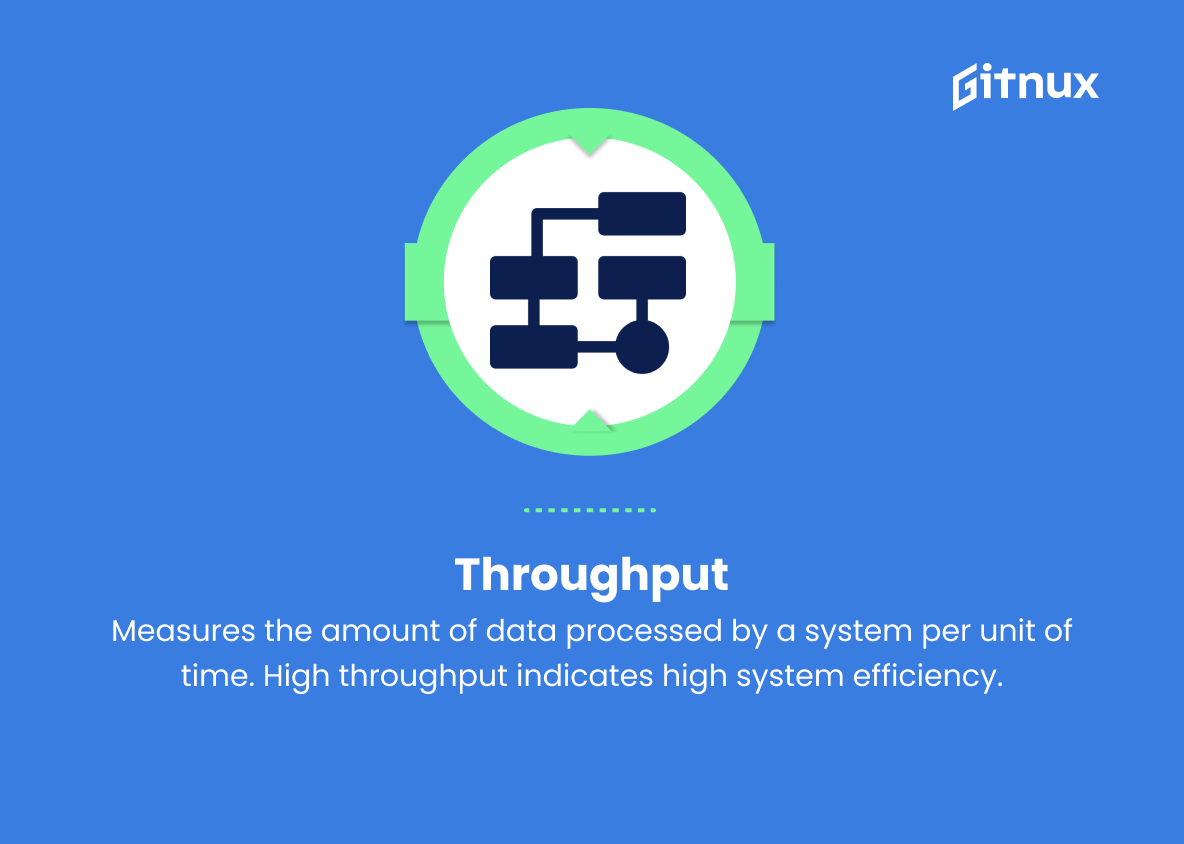
3. Throughput
Measures the amount of data processed by a system per unit of time. High throughput indicates high system efficiency.
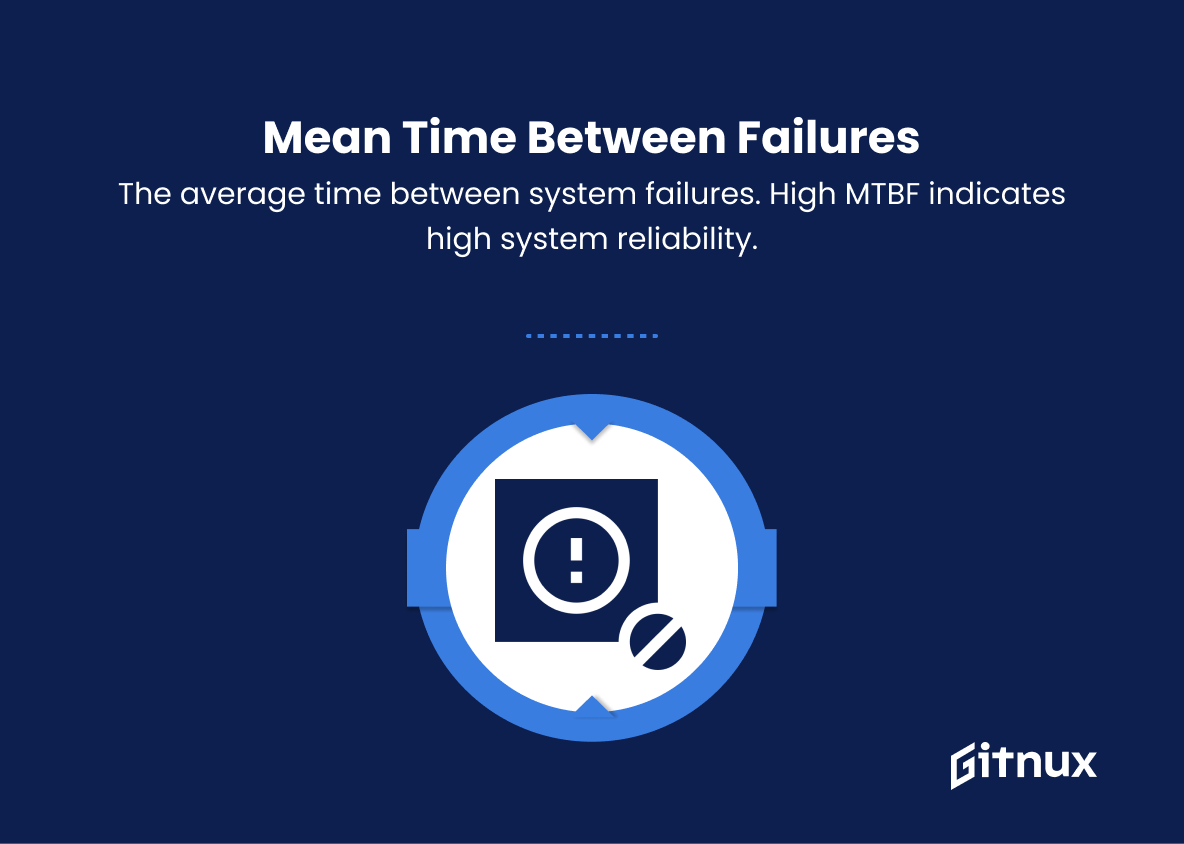
4. Mean time between failures (MTBF)
The average time between system failures. High MTBF indicates high system reliability.
5. Mean time to repair (MTTR)
The average time it takes to repair a failed system. Lower MTTR indicates efficient maintenance processes.
6. Network latency
The time it takes for a data packet to travel across a network from one node to another. Lower latency indicates better network performance.
7. CPU utilization
The percentage of processing power being used by the computer’s central processing unit (CPU). Lower CPU utilization indicates better system performance.
8. Memory utilization
The percentage of total memory in use on a system at any given time. Lower memory utilization indicates more available system resources.
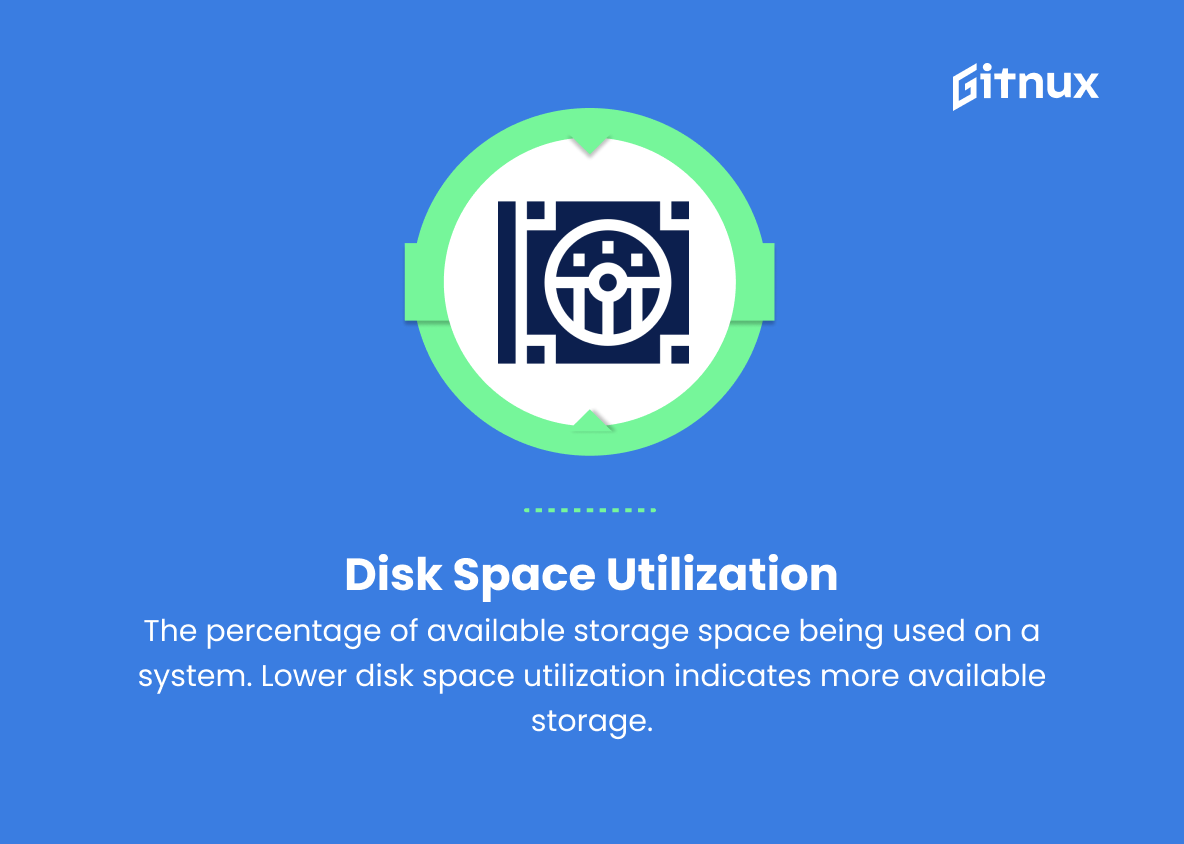
9. Disk space utilization
The percentage of available storage space being used on a system. Lower disk space utilization indicates more available storage.
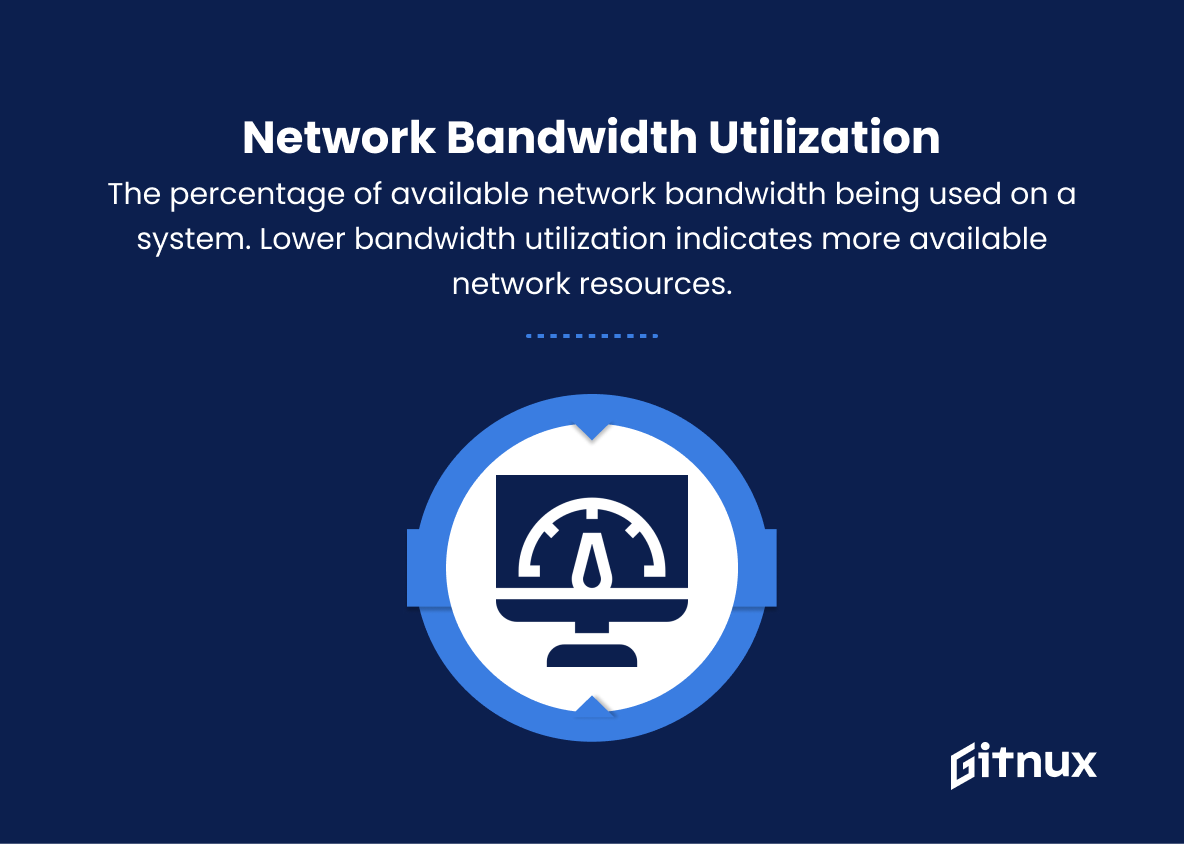
10. Network bandwidth utilization
The percentage of available network bandwidth being used on a system. Lower bandwidth utilization indicates more available network resources.
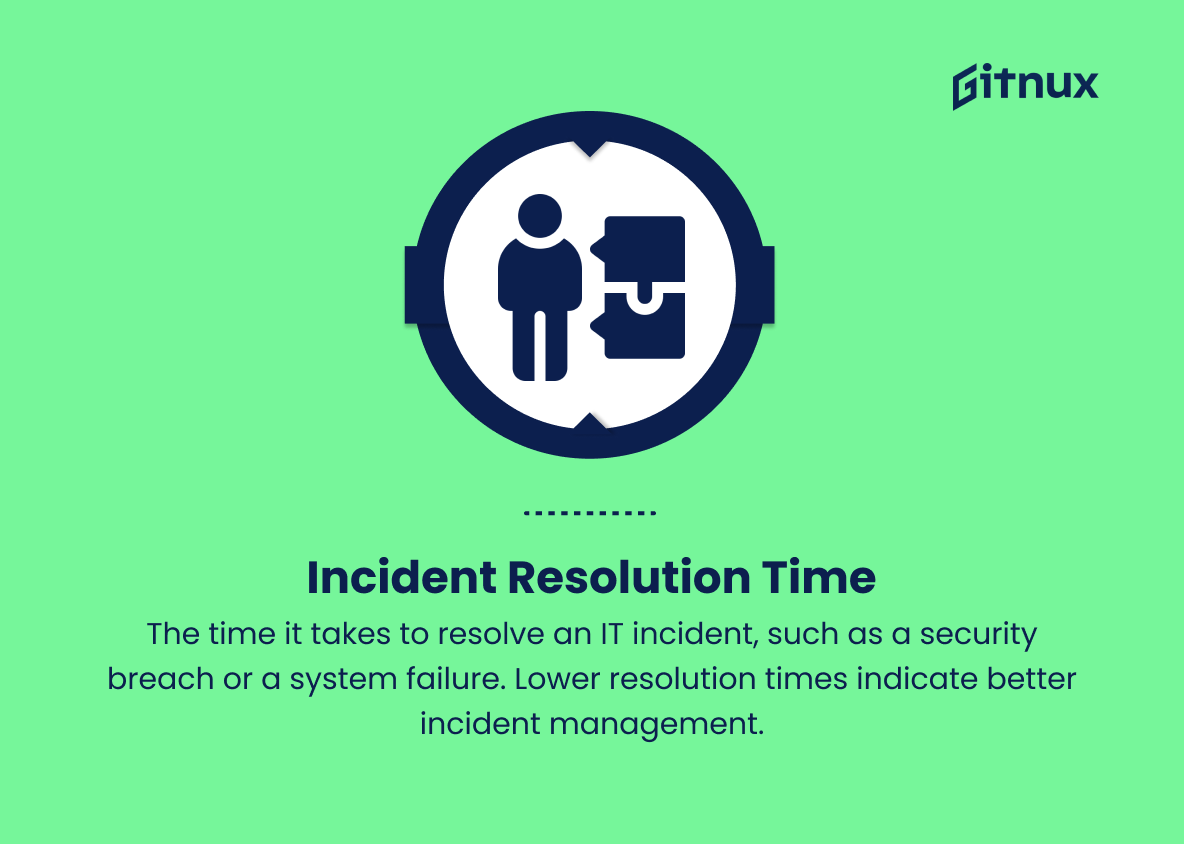
11. Incident resolution time
The time it takes to resolve an IT incident, such as a security breach or a system failure. Lower resolution times indicate better incident management.
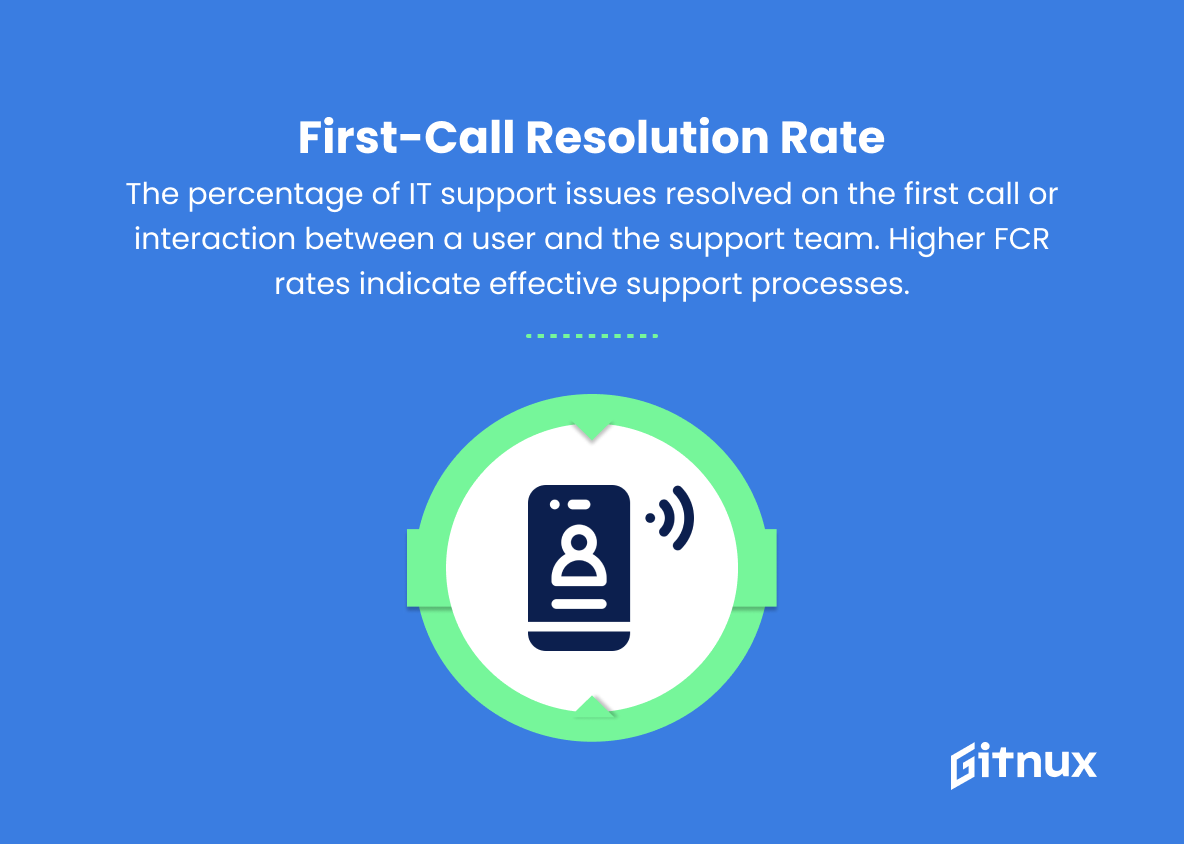
12. First-call resolution rate (FCR)
The percentage of IT support issues resolved on the first call or interaction between a user and the support team. Higher FCR rates indicate effective support processes.
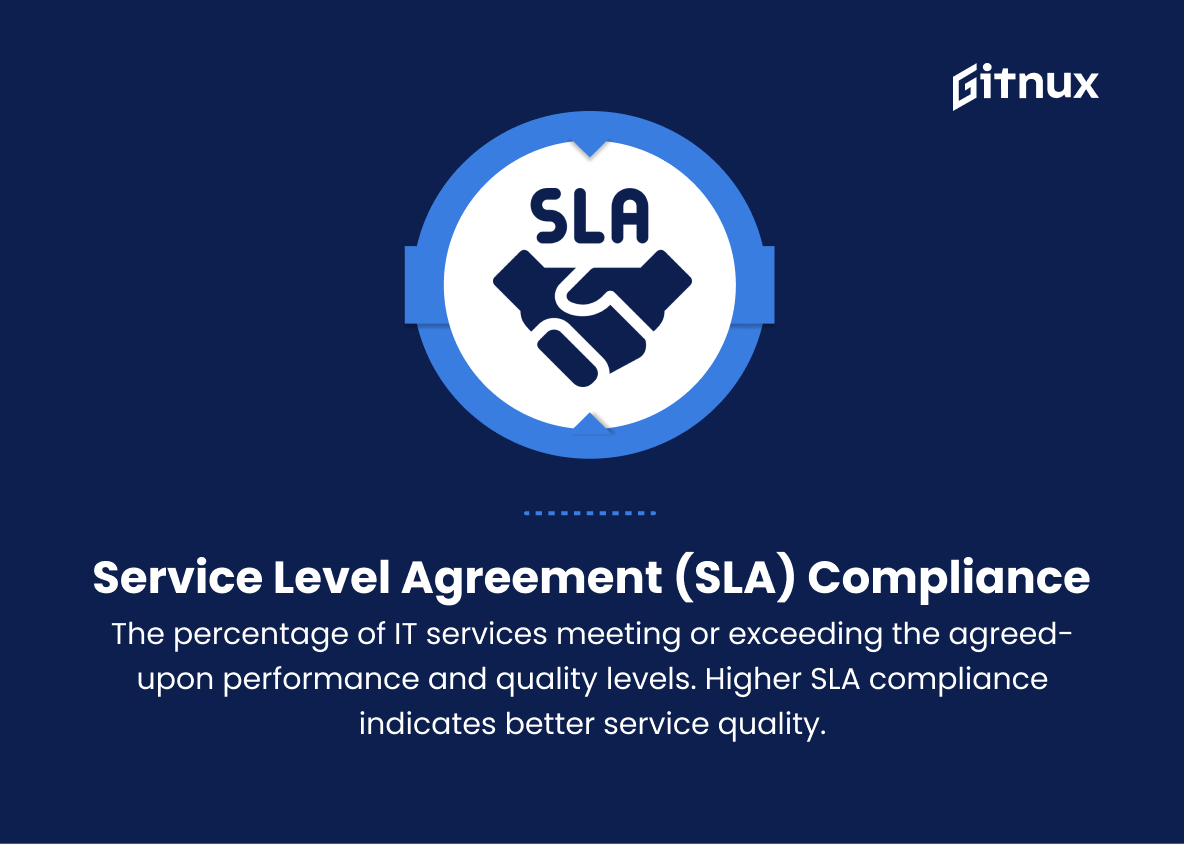
13. Service Level Agreement (SLA) compliance
The percentage of IT services meeting or exceeding the agreed-upon performance and quality levels. Higher SLA compliance indicates better service quality.
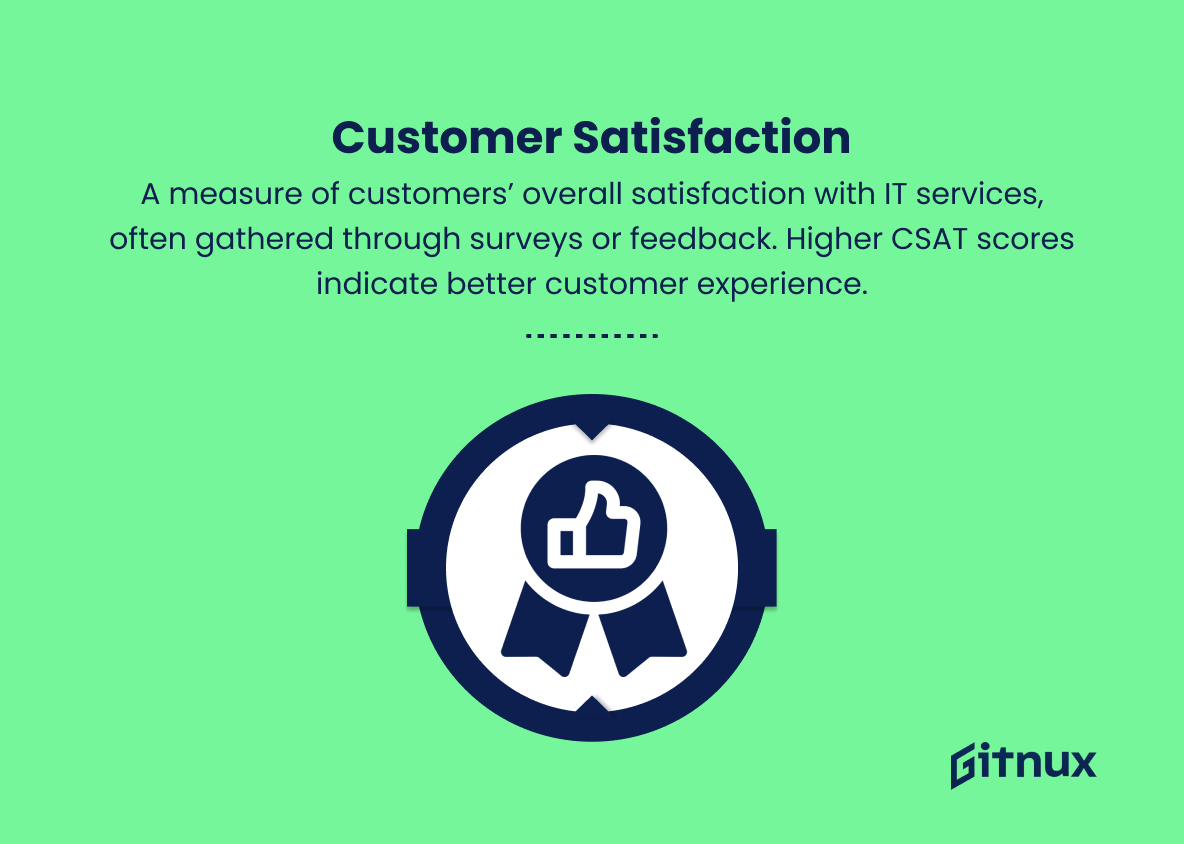
14. Customer satisfaction (CSAT)
A measure of customers’ overall satisfaction with IT services, often gathered through surveys or feedback. Higher CSAT scores indicate better customer experience.
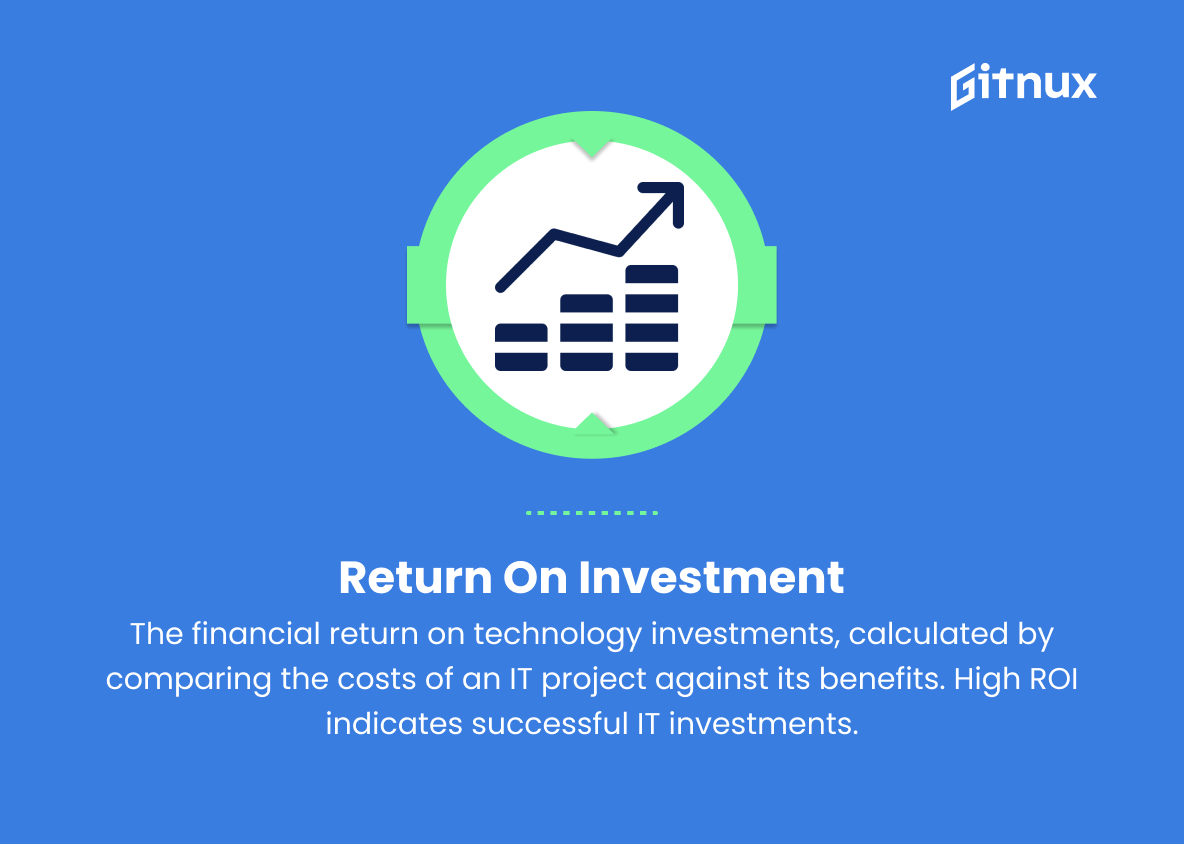
15. Return on Investment (ROI)
The financial return on technology investments, calculated by comparing the costs of an IT project against its benefits. High ROI indicates successful IT investments.
16. Cost per transaction
The cost associated with processing a specific IT-related transaction, such as a file transfer or a database query. Lower cost per transaction indicates improved efficiency.
17. Software defect rate
The number of defects, bugs, or errors in a software application compared to its size (e.g., lines of code). Lower defect rates indicate higher software quality.
Information Technology Metrics Explained
Information Technology Metrics such as uptime/downtime, response time, throughput, MTBF, MTTR, network latency, CPU utilization, memory utilization, disk space utilization, network bandwidth utilization, incident resolution time, FCR, SLA compliance, CSAT, ROI, cost per transaction, and software defect rate are essential indicators of system performance, efficiency, reliability, and customer satisfaction. These metrics provide IT professionals with the necessary insights to optimize and improve upon system performance, ensuring that users have the best experience possible.
By tracking and analyzing these metrics, IT departments can identify areas of concern, make informed decisions, allocate resources efficiently, and ultimately increase the value of their IT investments. Furthermore, monitoring and managing these metrics can help support teams proactively address issues and reduce the risk of system failures or breaches. In summary, using these IT metrics allows organizations to create a reliable, efficient, and cost-effective IT infrastructure that meets the needs of both internal and external users.
Conclusion
In conclusion, Information Technology metrics play a pivotal role in the success and growth of any organization in today’s ever-evolving digital landscape. By tracking, analyzing, and implementing these metrics, businesses can improve their IT infrastructure, streamline processes, work more proactively, and achieve optimum performance.
Ultimately, embracing IT metrics ensures efficiency, promotes informed decision-making, and lays a solid foundation for continuous improvement and innovation. Therefore, organizations committed to success must adopt and prioritize IT metrics to stay competitive and foster sustainable growth in the increasingly complex world of technology.
