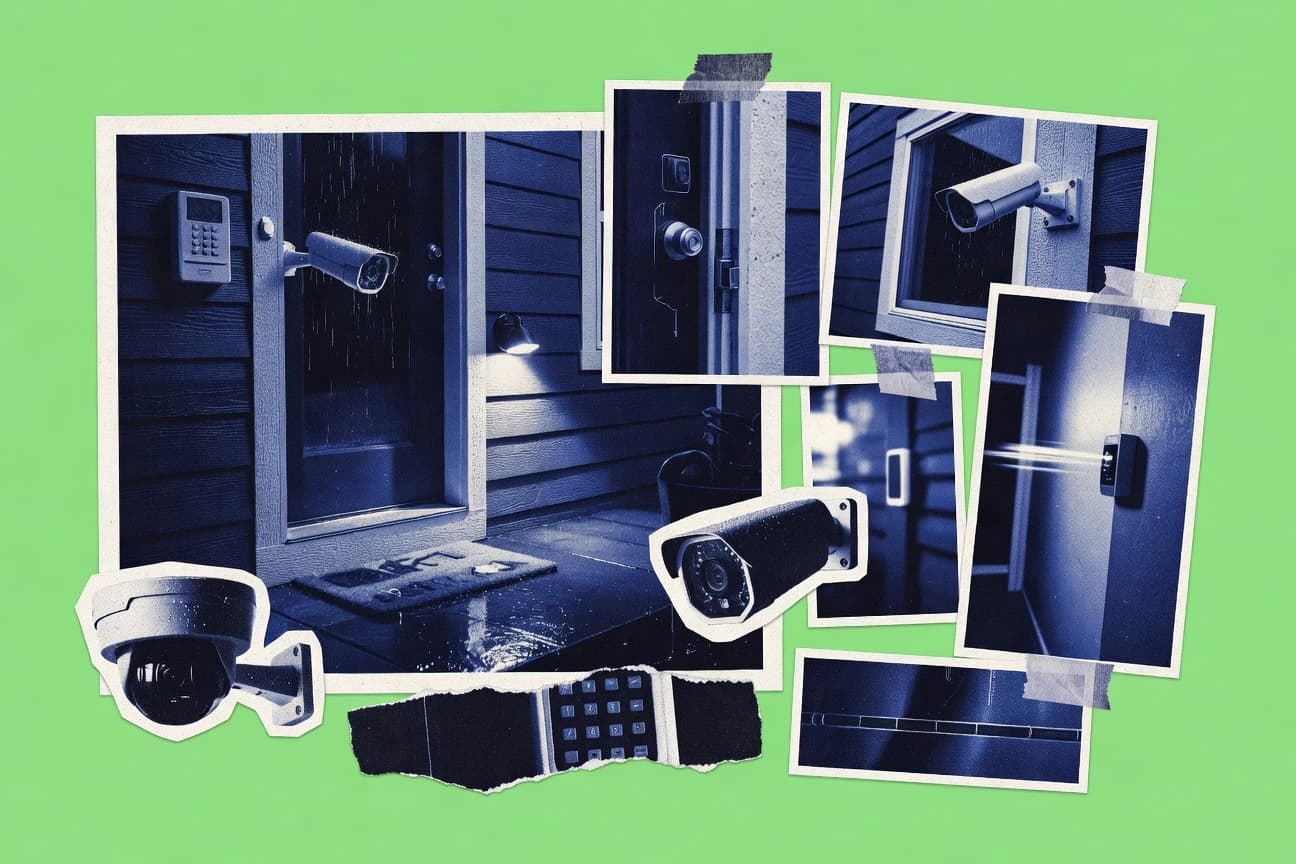

Global home security revenue is forecast to grow 3% from 2023 to 2024, while smart home security is projected to expand at a 19.4% CAGR through 2030. In the U.S., about 29% of burglary victims reported their doors or windows were not secured, even as cameras and sensors become more common. This report connects faster market adoption with the specific entry and risk patterns that keep driving incidents.
Key Takeaways
- 3% increase in global home security revenue from 2023 to 2024 (forecast baseline growth rate) indicates continued market expansion
- 7.6% CAGR for the global home security market over 2023–2030 indicates expected long-run growth rate
- 19.4% CAGR for the global smart home security market over 2023–2030 indicates rapid growth in connected security solutions
- 64% of surveyed homeowners reported willingness to share data with security providers in exchange for improved protection measures conditional data-sharing adoption
- Approximately 29% of burglary victims reported their doors or windows were not secured (risk context) measures common security gaps
- Professional monitoring costs commonly range from $20 to $60 per month measures recurring operational cost
- Insurance discounts for alarm systems in the U.S. commonly range from 5% to 20% measures potential savings impact on ROI
- A 2020 meta-analysis found CCTV and related deterrence interventions reduce crime by an average of about 16% across included studies measures general deterrence effectiveness
- 72% of breaches involve the human element according to Verizon 2024 DBIR measures cyber risk context for connected home security
- NVD lists over 30,000 vulnerabilities associated with “IoT” keywords since 2010 (scale of exposure) measures long-term security risk
- As of 2024, 28 countries have implemented national cybersecurity frameworks that include IoT guidance (policy context) measures regulatory momentum
- Motion sensors are present in 80% of home security system packages (component prevalence) measures common hardware configuration
- 2.1 million U.S. households subscribed to smart home monitoring services in 2022 (subscription count) measures growth of monitoring-led offerings
- In 2024, 38% of consumers were interested in integrating their home security systems with voice assistants (integration demand) measures ecosystem adoption
- In a meta-analysis of CCTV interventions (peer-reviewed), the pooled deterrence effect for property crime is reported as statistically significant with an average reduction estimate across studies; this indicates surveillance can affect outcomes.
Smart, connected home security keeps growing fast as households adopt cameras, monitoring, and data sharing.
Related reading
01 · Category
Market Size7 stats
01
3% increase in global home security revenue from 2023 to 2024 (forecast baseline growth rate) indicates continued market expansion
02
7.6% CAGR for the global home security market over 2023–2030 indicates expected long-run growth rate
03
19.4% CAGR for the global smart home security market over 2023–2030 indicates rapid growth in connected security solutions
04
23.4% of U.S. households with internet access used smart home security cameras in 2024 measures camera adoption
05
24% of U.S. burglaries happen through the front door (2019–2021 data); this indicates the front door is the most common entry point targeted by burglars.
06
27% of U.S. burglaries occur at night (9 p.m.–5:59 a.m.) based on 2019–2021 data; this indicates night-time home entry risk.
07
47% of break-ins take place when nobody is home (2019–2021 data); this indicates vacancy/absence conditions are a common driver of burglary success.
Interpretation
Market Size Interpretation
With global home security revenue forecast to grow 3% from 2023 to 2024 and reach 7.6% CAGR through 2030, the market expansion is being turbocharged by smart home security growing at a 19.4% CAGR and strong camera adoption where 23.4% of U.S. internet connected households use smart security cameras.
02 · Category
User Adoption1 stats
01
64% of surveyed homeowners reported willingness to share data with security providers in exchange for improved protection measures conditional data-sharing adoption
Interpretation
User Adoption Interpretation
With 64% of surveyed homeowners willing to share data with security providers for better protection, user adoption appears to be driven by clear value exchange between customers and providers.
03 · Category
Safety & Crime1 stats
01
Approximately 29% of burglary victims reported their doors or windows were not secured (risk context) measures common security gaps
Interpretation
Safety & Crime Interpretation
In the Safety and Crime context, about 29% of burglary victims said their doors or windows were not secured, highlighting that preventable entry-point gaps remain a major driver of home theft risk.
04 · Category
Effectiveness & Roi4 stats
01
Professional monitoring costs commonly range from $20to $60 per month measures recurring operational cost
02
Insurance discounts for alarm systems in the U.S. commonly range from 5% to 20% measures potential savings impact on ROI
03
A 2020 meta-analysis found CCTV and related deterrence interventions reduce crime by an average of about 16% across included studies measures general deterrence effectiveness
04
A peer-reviewed review reported that “visible guardianship” via surveillance systems is associated with reductions in property crime around 10%–20% (range across studies) measures deterrence ROI
Interpretation
Effectiveness & Roi Interpretation
For the Effectiveness and Roi angle, the data suggests that home security can deliver measurable returns, since professional monitoring costs $20 to $60 per month while insurance discounts of 5% to 20% and deterrence effects from CCTV averaging about a 16% crime reduction can combine to make the investment both affordable and impactful.
More related reading
05 · Category
Technology & Security3 stats
01
72% of breaches involve the human element according to Verizon 2024 DBIR measures cyber risk context for connected home security
02
NVD lists over 30,000 vulnerabilities associated with “IoT” keywords since 2010 (scale of exposure) measures long-term security risk
03
As of 2024, 28 countries have implemented national cybersecurity frameworks that include IoT guidance (policy context) measures regulatory momentum
Interpretation
Technology & Security Interpretation
Technology and Security for connected home systems faces a mounting risk as 72% of breaches stem from the human element, while the IoT vulnerability surface has grown to over 30,000 issues since 2010 and policy momentum reaches 28 countries with national cybersecurity frameworks that include IoT guidance.
06 · Category
Industry Trends10 stats
01
Motion sensors are present in 80% of home security system packages (component prevalence) measures common hardware configuration
02
2.1 million U.S. households subscribed to smart home monitoring services in 2022 (subscription count) measures growth of monitoring-led offerings
03
In 2024, 38% of consumers were interested in integrating their home security systems with voice assistants (integration demand) measures ecosystem adoption
04
AI-enabled video analytics are included in 27% of new security camera models in 2024 (feature penetration) measures automation trend
05
Privacy regulation increased in the EU: GDPR applies since May 2018 (compliance driver) measures ongoing regulatory constraint on security video/data
06
U.S. state laws on biometric data privacy cover 10 states as of 2024 (video/biometrics relevance) measures regulatory expansion affecting some camera analytics
07
Canada’s proposed privacy reforms (Bill C-27) include new safeguards for personal information; legislative progression in 2024 measures policy momentum impacting security vendors
08
In 2023, 65% of consumers reported that they want security systems that minimize false alarms (UX/quality driver) measures market pull for better detection
09
Residential burglar alarms market growth accelerated with smart alarms: 12% growth in 2023 vs 2022 for smart alarm segments (trend) measures category momentum
10
The UK National Cyber Security Centre (NCSC) published guidance on securing IoT devices; NCSC notes that many IoT devices have insecure configurations, supporting why connected home security requires secure provisioning controls.
Interpretation
Industry Trends Interpretation
As the industry trend toward smarter, more connected home protection accelerates, motion sensors appear in 80% of system packages and AI-enabled video analytics show up in 27% of new 2024 camera models, while growing monitoring subscriptions and rising integration interest push companies to innovate faster under tightening privacy rules like GDPR and expanding state biometric laws.
07 · Category
Crime & Risk2 stats
01
In a meta-analysis of CCTV interventions (peer-reviewed), the pooled deterrence effect for property crime is reported as statistically significant with an average reduction estimate across studies; this indicates surveillance can affect outcomes.
02
A 2023 peer-reviewed study found default passwords remain prevalent in connected devices (measured prevalence in sample); this implies a continuing risk for connected security products relying on user configuration.
Interpretation
Crime & Risk Interpretation
The evidence in Crime & Risk shows that CCTV can produce a statistically significant deterrence effect on property crime and that, as of 2023, default passwords are still common in connected devices, increasing vulnerability in the very systems meant to improve security.
08 · Category
Cost Analysis3 stats
01
The typical monthly cost for DIY/monitored home security plans in the U.S. is often cited as $20–$50 depending on tier and monitoring (industry pricing disclosures); this indicates ongoing affordability considerations.
02
The average cost to a business of a data breach in 2024 was reported as $4.88 million (IBM Security Cost of a Data Breach report); this provides a comparable economic risk benchmark for connected security systems (note: applies to breaches broadly).
03
Insurance claim frequency and costs vary: the U.S. insurance industry reported billions in insured property losses from theft and burglary-related claims in recent years (NAIC property/casualty summaries); this supports that underwriting can drive alarm discount strategies.
Interpretation
Cost Analysis Interpretation
For the Cost Analysis view of home security, consumer plans commonly run about $20 to $50 per month while the far higher cost of not preventing incidents is underscored by an average U.S. business data breach cost of $4.88 million in 2024 and large, ongoing insured losses from theft and burglary.
report visual · Comparison
Home Security Market Growth Signals Continued Expansion
Revenue growth and sector CAGR indicate steady expansion, with smart home security growing faster than the overall market.
19.4% CAGR for the global smart home security market over 2023–2030 indicates rapid growth in connected security solutio19.4%
Residential burglar alarms market growth accelerated with smart alarms: 12% growth in 2023 vs 2022 for smart alarm segme12%
7.6% CAGR for the global home security market over 2023–2030 indicates expected long-run growth rate7.6%
3% increase in global home security revenue from 2023 to 2024 (forecast baseline growth rate) indicates continued market3%
source-verifiedstatista.com · reportlinker.com2023
Reference
Cite This Report
This report is designed to be cited. We maintain stable URLs and versioned verification dates. Copy the format appropriate for your publication below.
APA
Margot Villeneuve. (2026, February 13). Home Security Industry Statistics. Gitnux. https://gitnux.org/home-security-industry-statistics
MLA
Margot Villeneuve. "Home Security Industry Statistics." Gitnux, 13 Feb 2026, https://gitnux.org/home-security-industry-statistics.
Chicago
Margot Villeneuve. 2026. "Home Security Industry Statistics." Gitnux. https://gitnux.org/home-security-industry-statistics.
Sources & references
31 datasets cited across this report · attribution is report-level
+7 additional datasets cited (not shown individually)