In the dynamic labyrinth of global economics, one pillar that holds significant influence is foreign direct investment (FDI). FDI plays an instrumental role in shaping the economic landscape of nations, driving growth, innovation, and cross-border integration. With this gravity, the need to comprehend and analyses FDI statistics becomes pivotal. Whether you’re a financial professional, an investor plotting your next move, or a curious economics student, our insightful breakdown of FDI statistics will help you decode the complexities of the global investment scene. Delve deep as we dissect trends, interpret data, explore projections, and illustrate the far-reaching impact of foreign direct investments across the world.
The Latest Foreign Direct Investments Statistics Unveiled
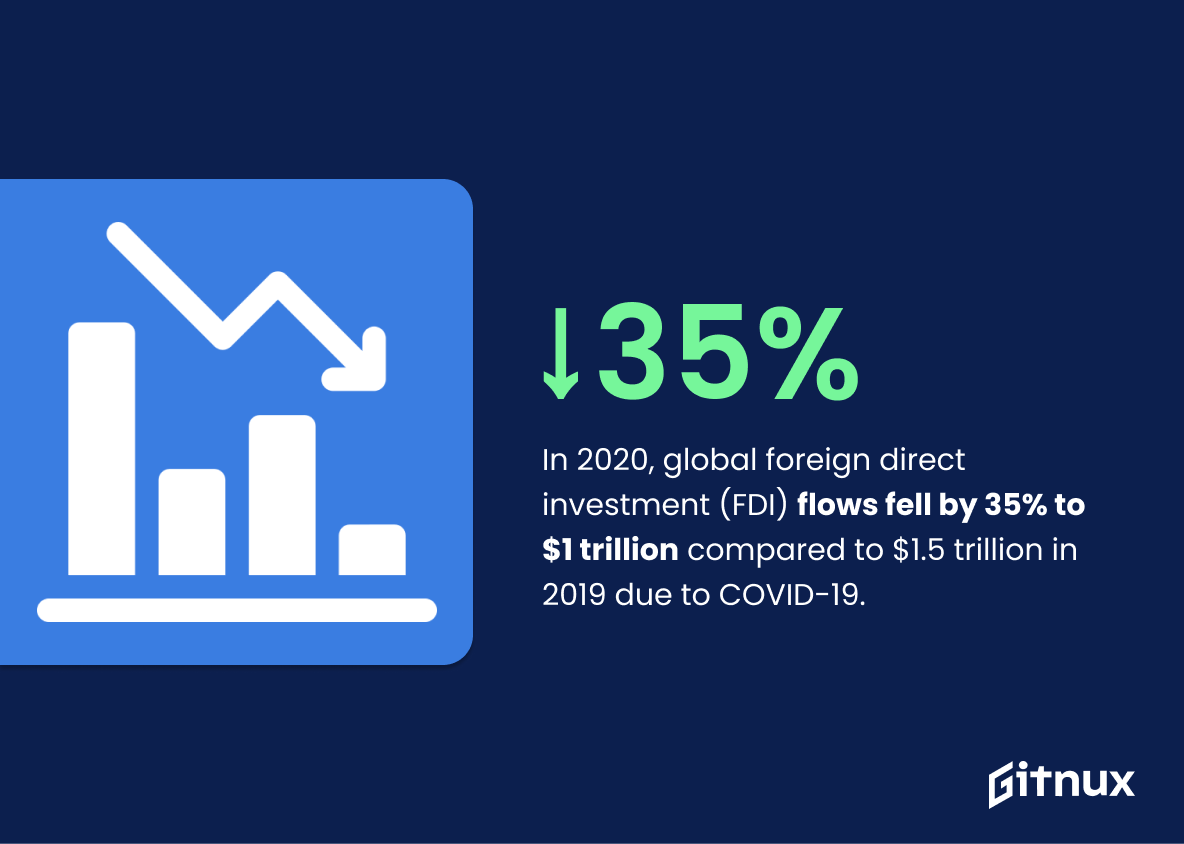
In 2020, global foreign direct investment (FDI) flows fell by 35% to $1 trillion compared to $1.5 trillion in 2019 due to COVID-19.
Unraveling the threads of this statistic exposes a dramatic plummet in global foreign direct investment in 2020, a 35% drop from the previous year’s $1.5 trillion, settling painfully at $1 trillion. The silent whisper behind this significant retreat is none other than the global pandemic, COVID-19.
This aftermath left by the virus is crucial in understanding FDI patterns, as it indisputably shows how events on a planetary scale can shake international investment decisions, disrupting economies worldwide. It offers a stark snapshot of the vulnerability and interconnectedness of global finance and underscores the fundamental impact of unforeseen global events on investment trends.
Moreover, it serves as a footprint for historians, market analysts, economists, and investors alike to comprehend the cyclical forces that drive global FDI. This dramatic twist of numbers therefore is a crucial player in framing future investment strategies, mapping global economy recovery plans, and drafting robust financial models resilient enough to withstand such global tremors. It is this stark drop that makes one appreciate the frugality, dynamics and the sensitivity revolving around foreign direct investments.
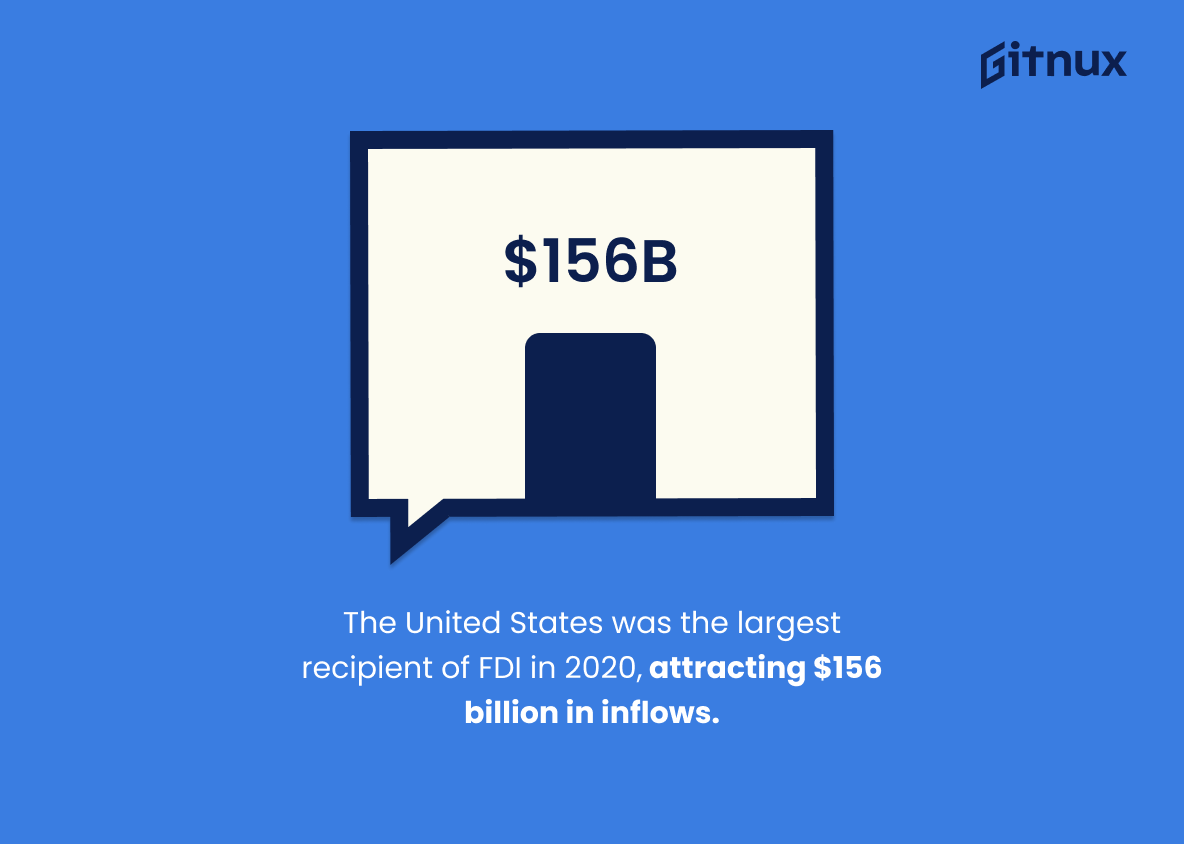
The United States was the largest recipient of FDI in 2020, attracting $156 billion in inflows.
Highlighting that the United States lured a staggering $156 billion in Foreign Direct Investments (FDI) inflows in 2020 underscores its status as a flashy beacon, magnetizing overseas investors. This figure doesn’t just pepper the country with the accolade of the largest global recipient but embodies a reflection of the strength and resilience of its economy amidst global uncertainties. Investors, economists, and policy makers often lever this kind of data as a compass pointing towards investment-friendly destinations, giving them insights to frame their strategies, predict market trends and navigate the complex world of global finance.
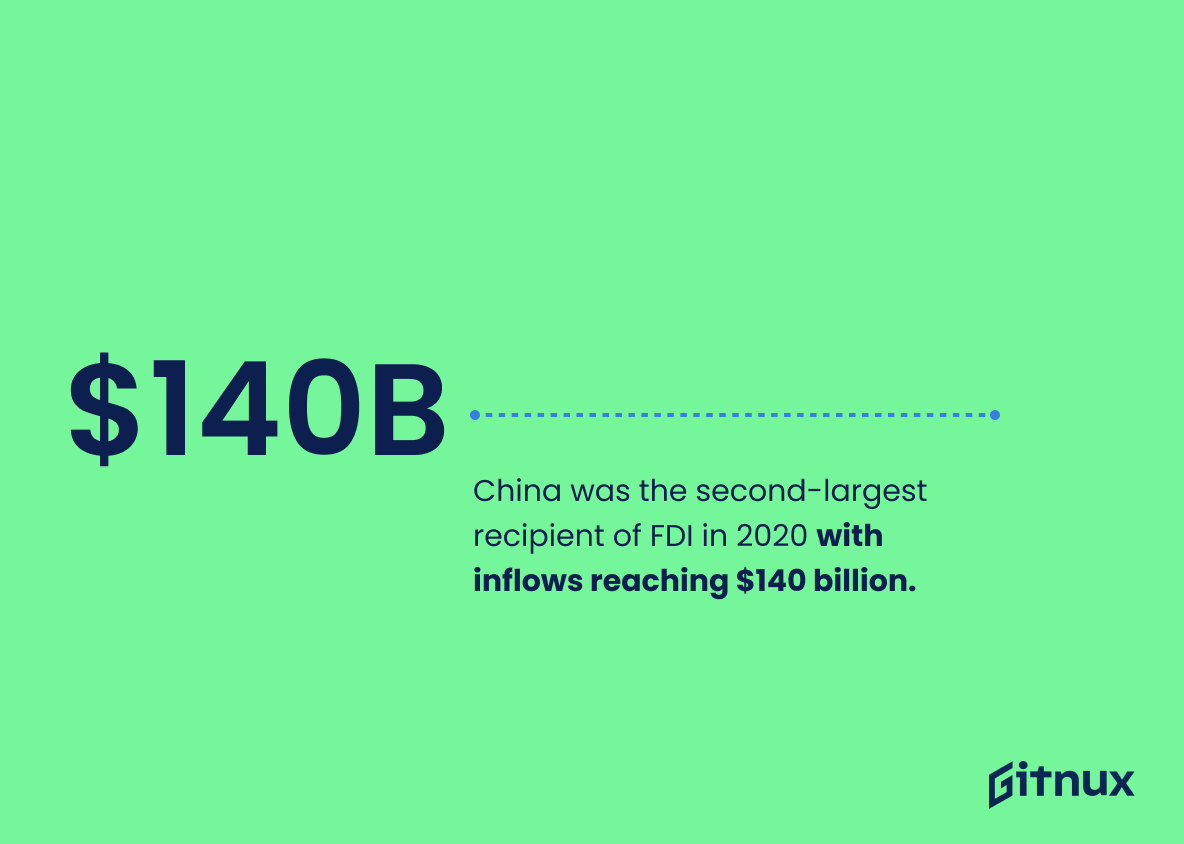
China was the second-largest recipient of FDI in 2020 with inflows reaching $140 billion.
In the dance of global economic currents, the statistic noting China as the second-largest recipient of FDI in 2020, with inflows reaching a staggering $140 billion, is a dazzling pirouette. Highlighting China’s magnetic pull on foreign investment, this figure suggests a robust economic environment and healthy investment potential in the country. It further illuminates the intricate choreography of international economic cooperation. The sturdy position of China in the FDI arena not only reveals the country’s reception to foreign investors, but also adds an interesting shade to the overall foreign direct investment portfolio. It emphasizes China’s role as a vital player on the economic stage, a noteworthy detail within the broader narrative of Foreign Direct Investment statistics. This insight offers an entre into gauging worldwide investment patterns and trends, critical for understanding the larger dance of global economics and power dynamics.
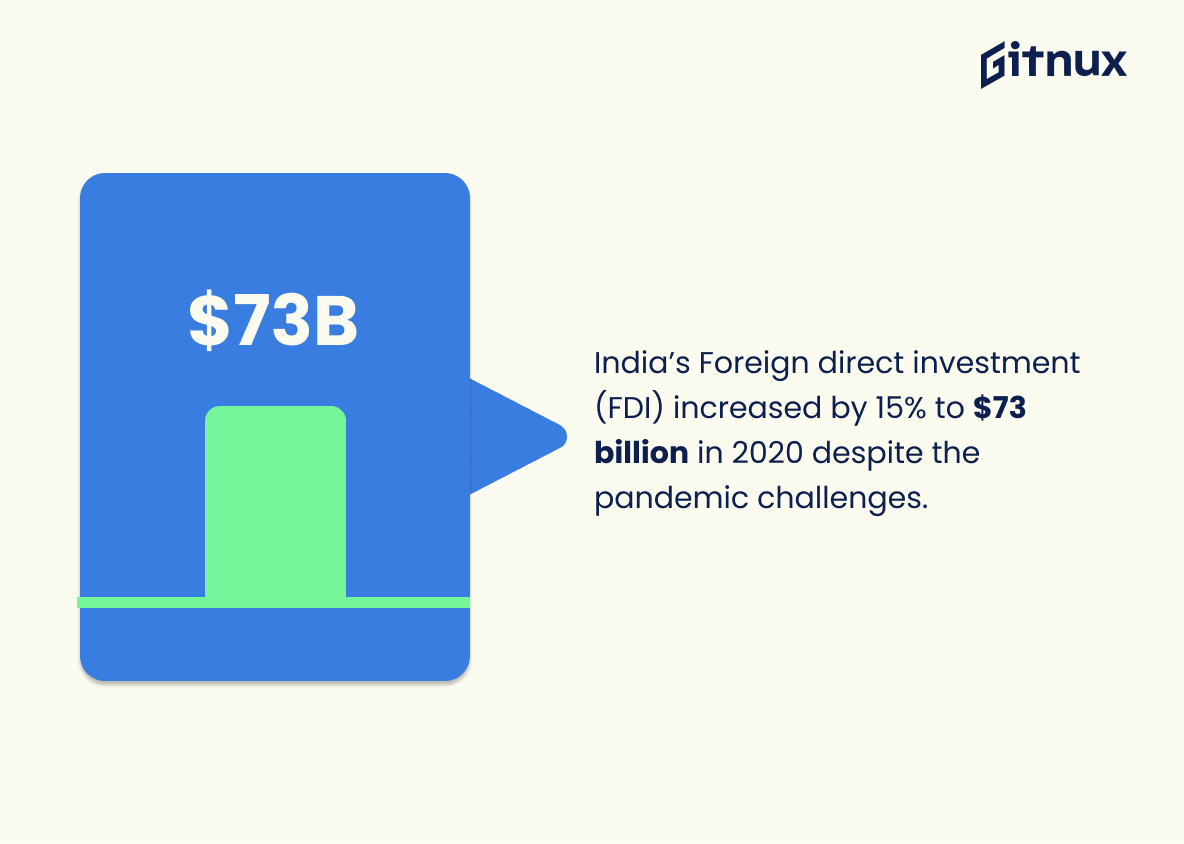
India’s Foreign direct investment (FDI) increased by 15% to $73 billion in 2020 despite the pandemic challenges.
As we delve into the world of Foreign Direct Investments (FDI) statistics, the fact that India’s FDI surged by 15% to $73 billion in 2020, notwithstanding the trials thrown by the pandemic, deserves special attention. This figure is not merely a stand-alone statistic, but plays the lead role in showcasing the resilience and appeal of India’s economy on a global stage. Amid decreased global capital flow, India’s economic performance, evidenced by this increase in FDI, speaks volumes about investor confidence in its market potential and recovery capability.
The above statistic adds a rich dimension to the post by emphasizing the strength of emergent markets, especially under pressing global conditions, and also sets up a dynamic platform to explore factors reinforcing India’s righteous place as a robust investment hub. It opens up avenues for engaging discussions on international investment trends, the attractiveness of the Indian market, and the role of domestic policies in fostering a thriving investment environment.
In Latin America and the Caribbean, FDI inflows fell by 45% to $88 billion in 2020.
Highlighting the drastic 45% drop of FDI inflows to $88 billion in Latin America and the Caribbean for 2020 casts a vivid light on the turbulent economic climate of the region. This nugget of data majorly punctuates our discussion about Foreign Direct Investments, pointing towards the mounting challenges or possible policy alterations faced by these regions, that could have influenced such a significant contraction. Such an insight fuels our deeper exploration of how geopolitical changes, regional growth fluctuations, or even the rampant COVID-19 pandemic might have influenced investment patterns globally. It effectively underscores the importance of understanding FDI fluctuations, not just from an economic standpoint, but also from a socio-political perspective.
FDI inflows to Africa fell by 16% to $40 billion in 2020 from $47 billion in 2019.
The plunge in Foreign Direct Investment (FDI) to Africa — a significant 16% drop from $47 billion in 2019 to $40 billion in 2020 — narrates a tale of shifting tides on the global economic landscape, and carries potential implications for future investment patterns, strategies, and priorities. It paints a vivid picture of the uncertainty and apprehension instigated by the global crisis, which has had profound impacts on investor confidence.
Furthermore, this transformation in FDI inflows establishes a critical benchmark for assessing Africa’s attractiveness as a destination for foreign investments. It underscores the need for investigating the factors that have contributed to this shift, such as changing political climates, shifts in economic policy or even the effects of the global pandemic. Most importantly, it helps in framing prospective measures for strengthening the resilience of Africa’s economy and instituting policies to enhance its appeal to foreign investors.
A piecing together of the numerical jigsaw in a blog post about Foreign Direct Investments Statistics can provide the readers a nuanced understanding of the bigger economic picture, empowering them to make more informed predictions, evaluations, and decisions.
In 2020, FDI inflows into the European Union fell by 71% to $110 billion.
The plummeting waterfall of FDI inflows into the European Union in 2020, a staggering fall of 71% to a mere $110 billion, paints an alarming picture in the landscape of Foreign Direct Investments. This precipitous drop not only underpins the economic turbulence ignited by the global pandemic but also implies reshuffling of strategies by international investors. Reviewing this dramatic shift sheds light on trends worldwide, providing invaluable insights for economists, policy makers, and investors navigating the tumultuous sea of global finance in the post-pandemic world.
In 2020, Australia saw a decrease of 46% in FDI inflows to $22 billion.
Such a dramatic dip in Foreign Direct Investments (FDI) in Australia, specifically a decrease of 46% down to $22 billion, underscores the significant turbulence experienced in 2020 and carries noteworthy implications for the global FDI landscape. It spotlights Australia’s weakened attractiveness or ability to garner international investment, possibly due to factors such as the global pandemic. Moreover, it underlines the challenges and opportunities that present themselves for Australia’s economy as it aims to recapture and enhance FDI inflows. This figure serves as a key indicator of the shifts and trends in international business, which carries substantial weight in the broader discourse around FDI statistics.
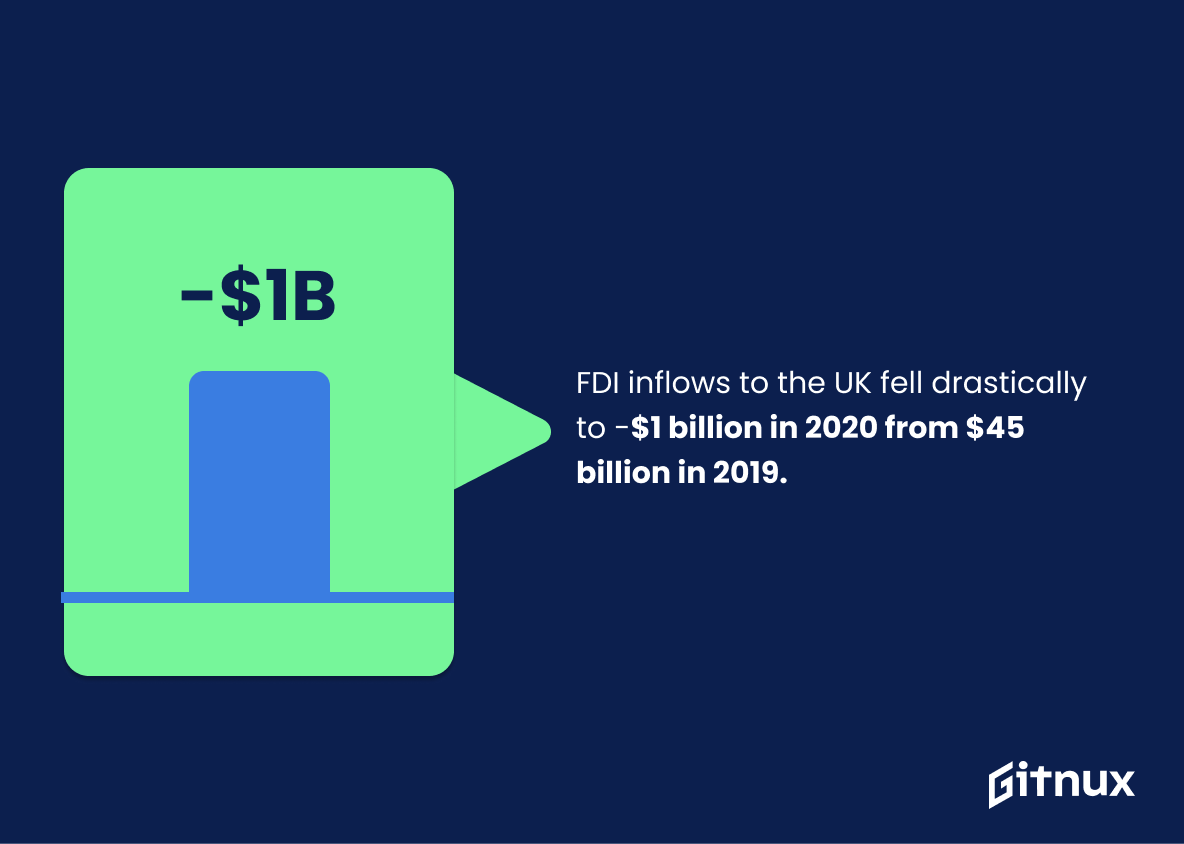
FDI inflows to the UK fell drastically to -$1 billion in 2020 from $45 billion in 2019.
Examining the dramatic plunge of FDI inflows into the UK, from a staggering $45 billion in 2019 to a negative $1 billion in 2020, paints a crucial portrait of the shifting macroeconomic landscape. This dramatic shift provides a window into the volatile dynamics of international investments, reflecting the potential impact of socio-political factors such as Brexit or global phenomena like the COVID-19 pandemic. The sudden descent into negative territory serves as a stark indicator of investor sentiment toward the UK’s economic prospects, signaling a worrying trend, a critical point of discussion in the canvas of foreign direct investment statistics.
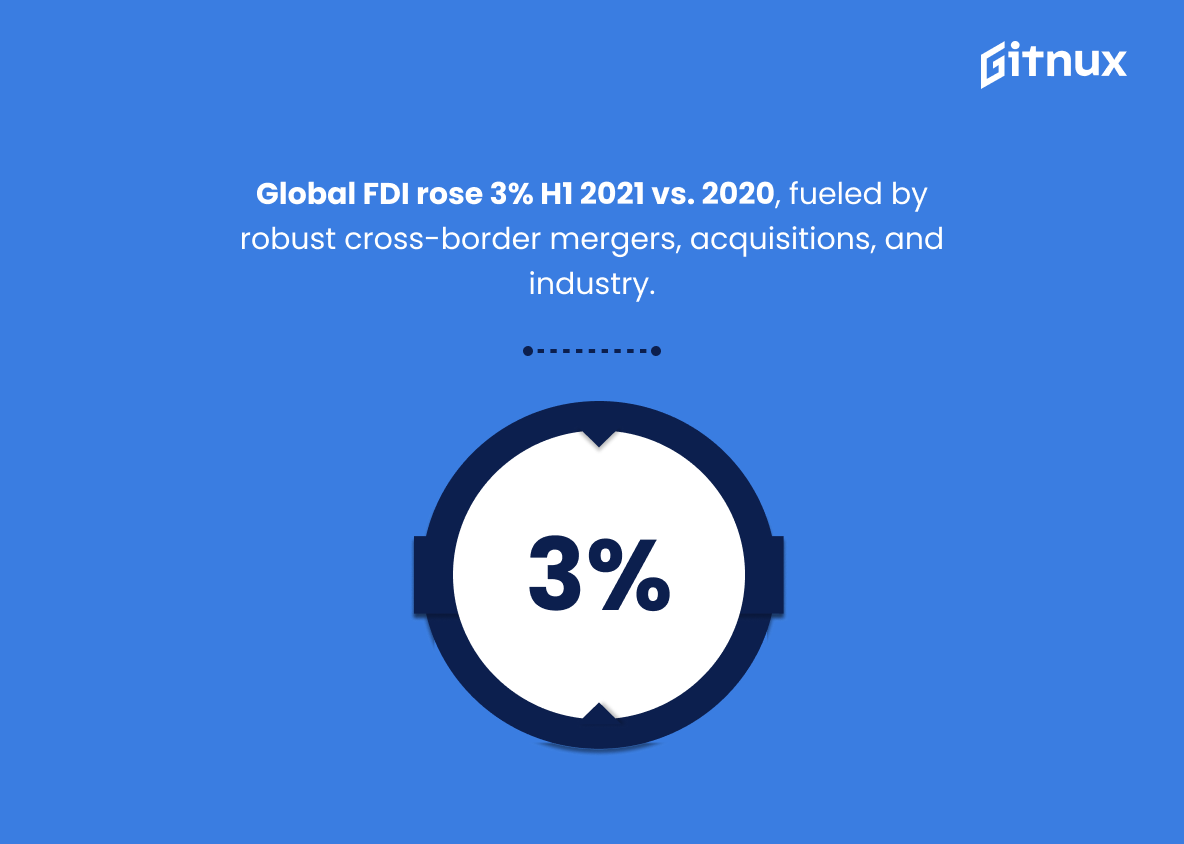
In the first half of 2021, global FDI flows increased by 3% compared to 2020, driven by resilient cross-border mergers and acquisitions and strong industrial activity.
Highlighting the uptick in global FDI flows by 3% in the first half of 2021 offers significant insight into how the world economy is rallying against the effects of the recent global crisis. This stimulates an appreciation of the resilient nature of cross-border mergers and acquisitions and the vibrancy of industrial activity, key drivers of this surge. Such a noticeable increase paints an optimistic picture of a rebounding global economy, and underscores the vital role that Foreign Direct Investments play in forging economic links and facilitating shared prosperity among nations. Therefore, this statistic stands as a beacon of promising outlook within a blog post about Foreign Direct Investment statistics, offering readers an encouraging narrative amidst a global economic landscape that continues to evolve.
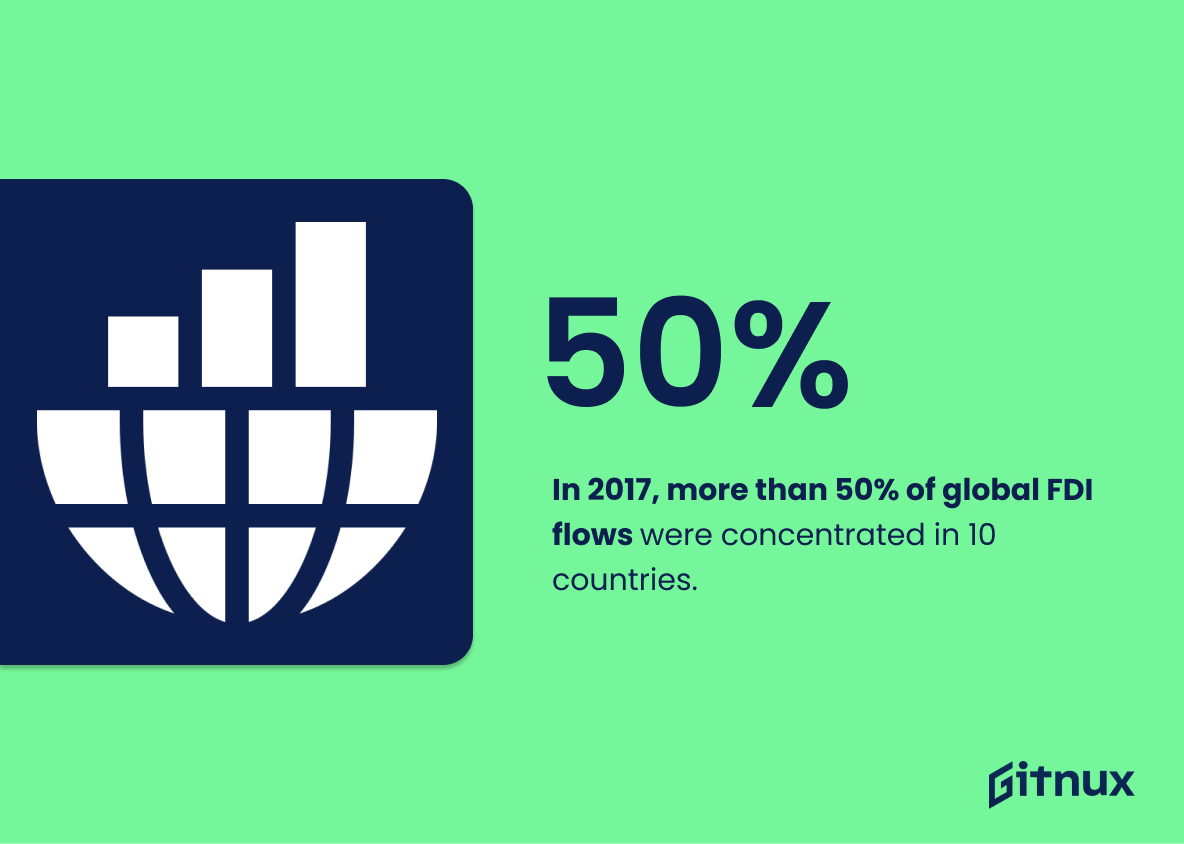
In 2017, more than 50% of global FDI flows were concentrated in 10 countries.
Unraveling the threads of the 2017 Foreign Direct Investments (FDI) tapestry reveals an intriguing pattern – over half of the global FDI flows were densely woven into just 10 countries. Such compelling data fuels curiosity, serving as a launchpad to probe deeper trends and dissect the nuances of global economic behavior.
The concentration of FDI in a handful of nations has implications that echo across continents, revealing both the economic strength of these countries and their enticing attractiveness to foreign capital. This narrative is cornerstone content for any blog post about FDI statistics; it shapes understanding of how global finance ebbs and flows, canalizing towards certain economies while bypassing others.
On the reverse side of the coin, it raises pertinent questions about the FDI landscape in the remaining countries. Is their share minuscule or just scattered across a larger pool? It paints a picture of a world economically polarized, a fascinating cartography of affluence and opportunity that readers of an FDI statistics blog would find invaluable.
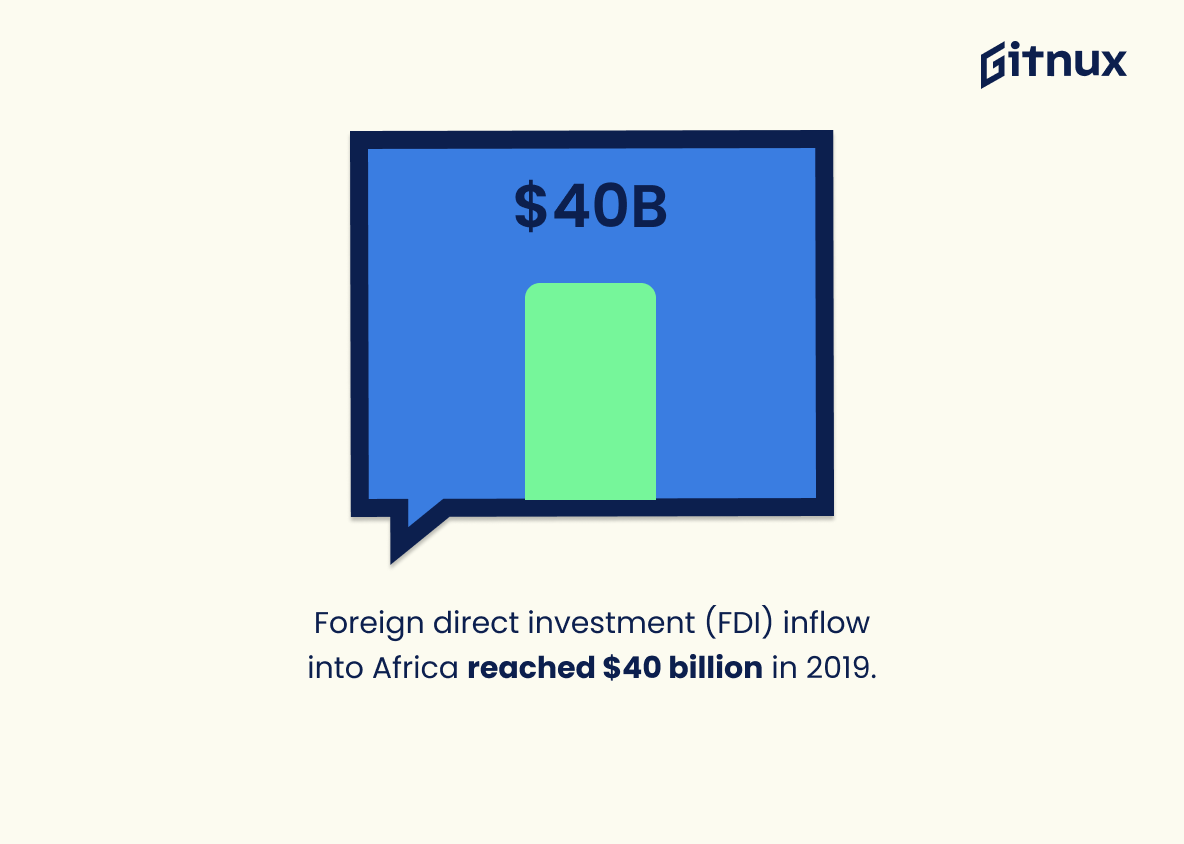
Foreign direct investment (FDI) inflow into Africa reached $40 billion in 2019.
Delving into the realm of Foreign Direct Investment statistics, let’s consider a captivating revelation, Africa drew in a whopping $40 billion of FDI inflow in 2019. This staggering number functions as an economic barometer, indicating the continent’s increasing commercial allure and solidifies its position as a great financial frontier. It underlines the keen interest of foreign investors in African markets due to promising returns on their investments. Furthermore, it plays a pivotal role in shaping conversations around Africa’s market potential, economic stability, and the lucrative opportunities it offers to the global investment community. So, the next time you ponder about the shifting tides of global-scale investments, this figure offers a compelling narrative of Africa’s ascension as a new hub for foreign direct investments.
Cross-border investment in developed and transition economies dropped by 6% and by a whopping 77% in 2019 respectively, with only Asia bucking the trend with a 5% rise in inflows.
Painting a vivid picture of Foreign Direct Investment (FDI) trends around the globe, this statistic underscores the stark contrast between various regions. It dramatically illustrates the declining allure of developed and transition economies for cross-border investors in 2019. A distinct downtrend by 6% and an astounding 77% was seen for these economies.
Simultaneously, the resilience and magnetic attraction of the Asian market surface, manifested in the 5% rise in investment inflows, effectively going against the grain. This reversal of fortunes is a compelling testament to the dynamic and evolving nature of the global investment landscape. Such statistics are not just numbers, but a narration of global economic shifts and trends that are crucial for investors, policymakers, and business strategies.
Global FDI outflows, marking the outward investment by domestically-based companies, slipped by 2.3% to $909 billion in 2019.
To start turning the cogwheels of understanding the global Foreign Direct Investment (FDI) landscape, let’s take a telescopic view of the sobering fact staring at us from 2019. A slight deceleration of 2.3% was witnessed in global FDI outflows, cooling down the thermometer to a $909 billion mark.
Now paint this broader canvas onto a blog about foreign direct investments statistics. The drip in the outflow graph isn’t simply a number or a percentage; it serves as a vital economic barometer, shifting the weather in the realm of global investments. Harnessing this information, researchers, economists, investors and policymakers can adjust their lenses to scrutinize the underlying causes of this slowdown.
Perhaps it could be the result of restrictive trade policies, geopolitical tensions, or the dance of the global economy itself? Whichever the cause, knowledge of this decline sharpens the focus on outbound investment strategies by domestically based companies.
Moreover, this decrease gives us a playing field to find a pattern in the ebb and flow of global FDI outflows. Ergo, adding spicy bites of speculation, analysis and prediction in the foreign investment domain. By understanding dips and peaks, future trends can be anticipated, and investment strategies can be expertly navigated with the compass of knowledge. In the gold-rush of international marketing and finance, such a statistic is nothing less than a treasure map.
Conclusion
In essence, Foreign Direct Investment statistics offer invaluable insights into the global economic landscape, deciphering investment trends, opportunities, and challenges. These facts and figures shed light on market stability, investor confidence, and economic growth prospects of various nations. Understanding them is crucial not just for policymakers and economists, but also for businesses seeking expansion or diversification. The nature, source, and destination of FDI can significantly influence a nation’s economic trajectory and competitive edge. Hence, regular tracking and thoughtful interpretation of FDI statistics are pivotal to respond wisely to the ever-evolving global economic scenarios.
References
0. – https://www.www.unctad.org
1. – https://www.www.worldbank.org
2. – https://www.unctad.org
3. – https://www.www.reuters.com
4. – https://www.www.weforum.org
