In today’s rapidly evolving digital landscape, businesses and content creators are constantly seeking ways to measure and optimize their online presence. As Artificial Intelligence (AI) continues to permeate various sectors and processes, harnessing its immense potential for data-driven insights becomes an essential aspect of success. In this thought-provoking blog post, we delve into the fascinating world of AI Metrics – the sophisticated set of tools, techniques, and strategies that harness the power of AI to analyze, predict, and improve the most essential aspects of our digital world.
Join us as we explore the role of AI Metrics in everything from marketing strategies to user engagement and unveil the secrets behind maximizing online performance through the seamless integration of artificial intelligence.
Ai Metrics You Should Know
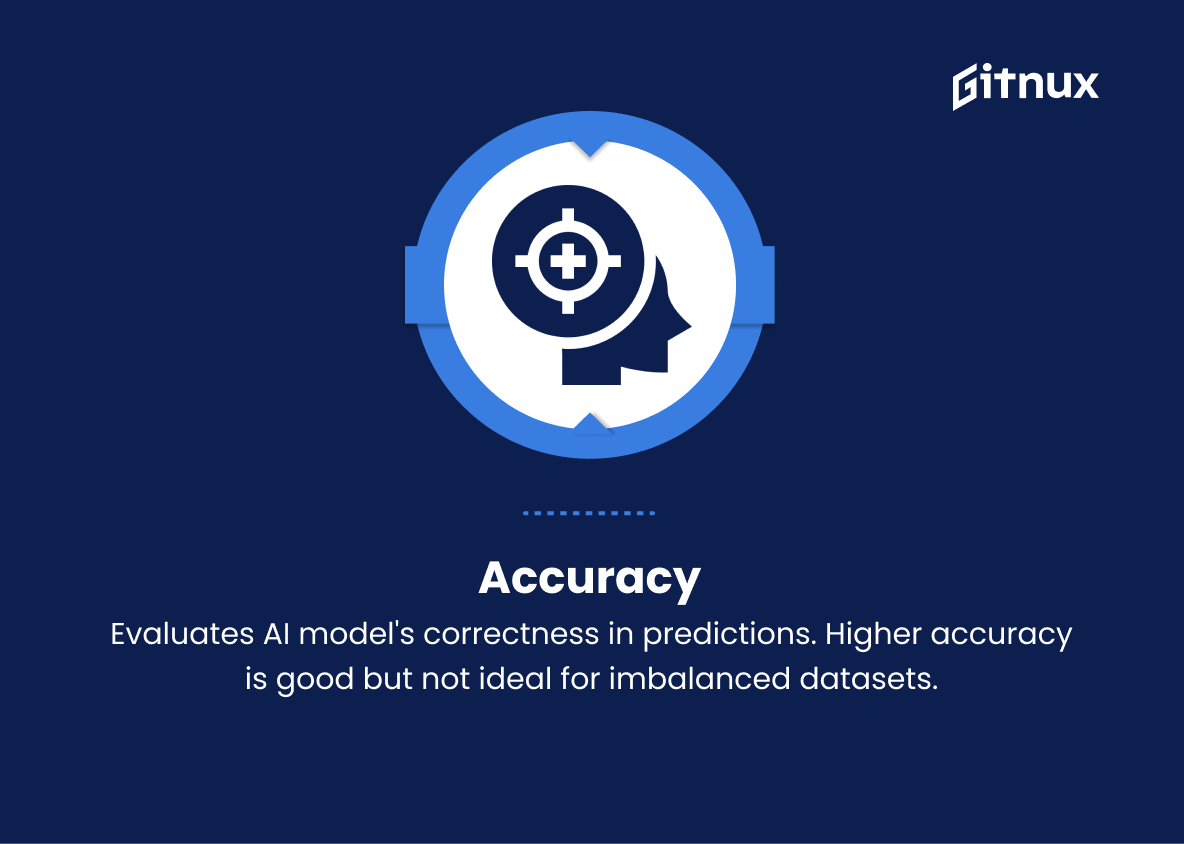
1. Accuracy
Measures the proportion of correct predictions made by the AI model out of the total predictions. Higher accuracy generally means better performance, but it might not be suitable for imbalanced datasets.
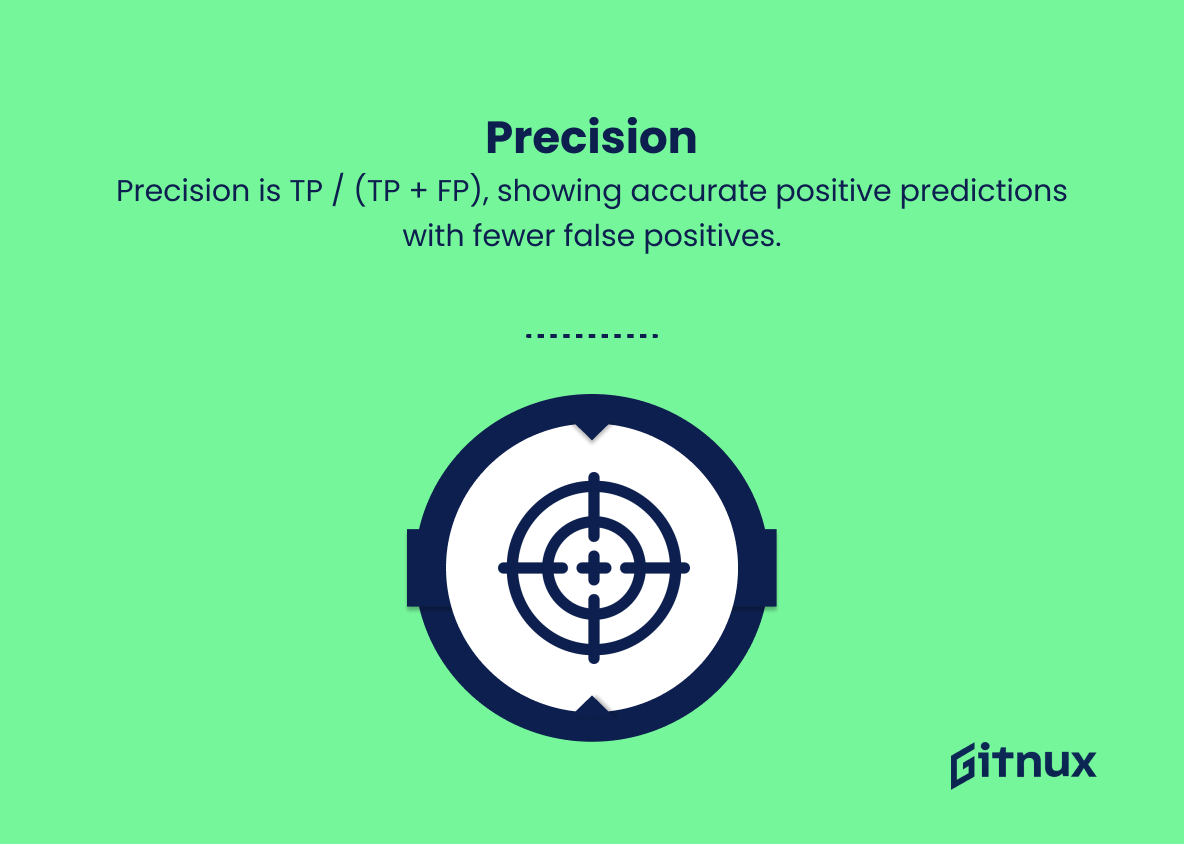
2. Precision
The proportion of true positives (TP) out of the total predicted positives (TP + FP). High precision indicates that the AI model accurately predicts positive instances and produces fewer false positives.
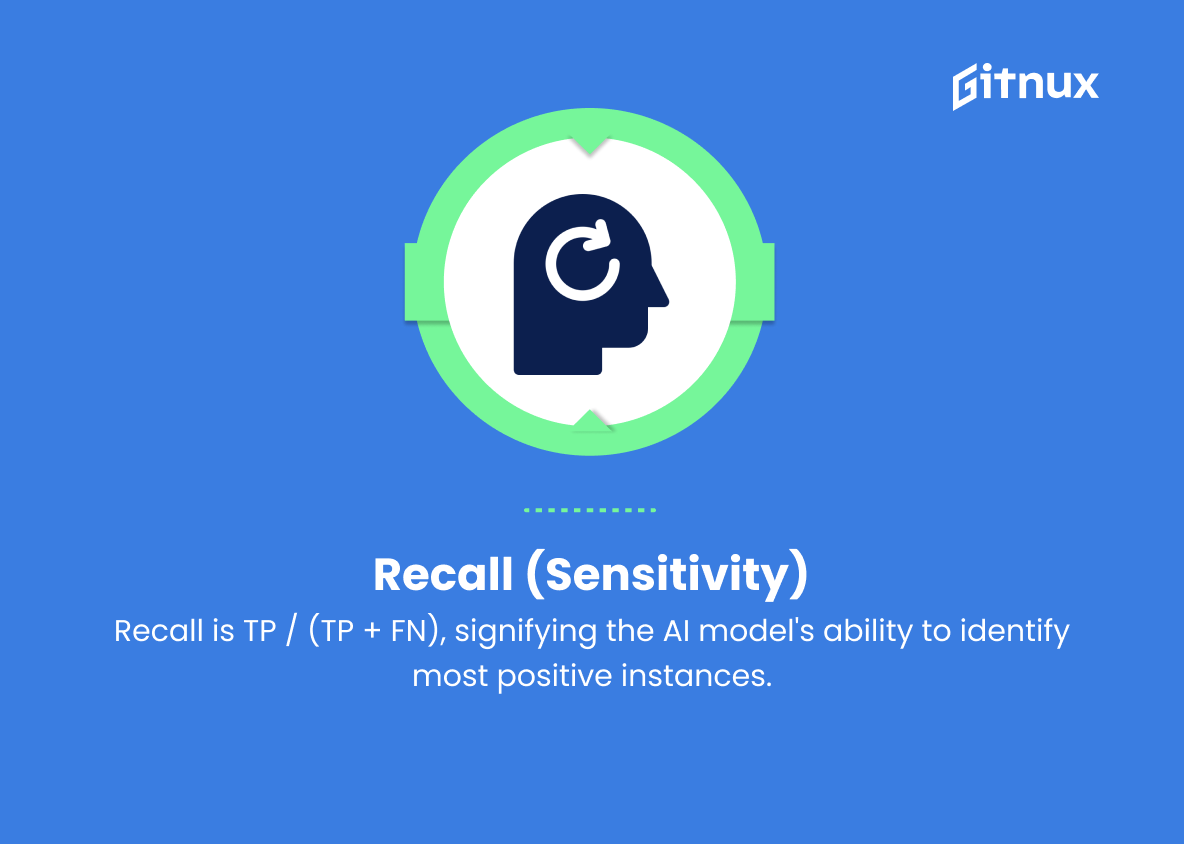
3. Recall (Sensitivity)
The proportion of true positives (TP) out of the total actual positives (TP + FN). High recall means the AI model identifies a high percentage of positive instances in the dataset.
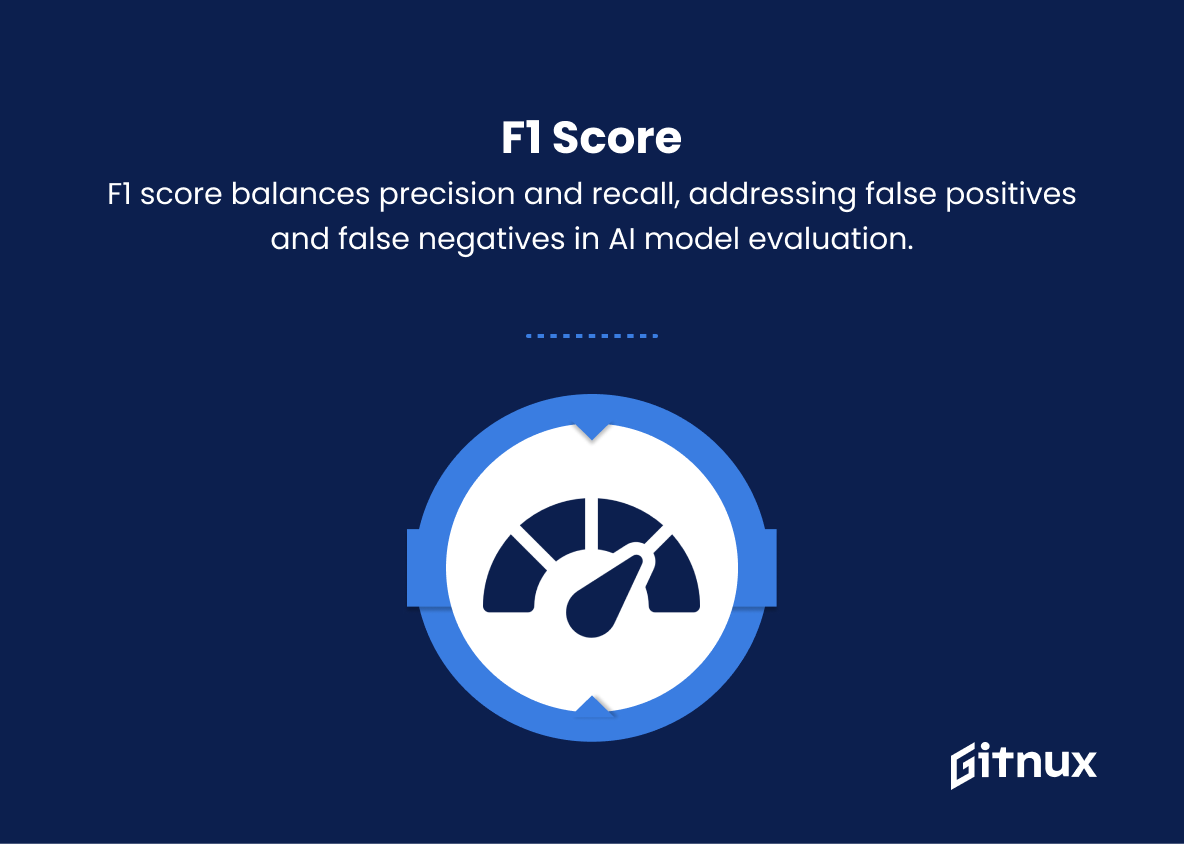
4. F1 Score
The harmonic mean of precision and recall, providing a balance between them. It is used to account for both false positives and false negatives when evaluating the performance of AI models.
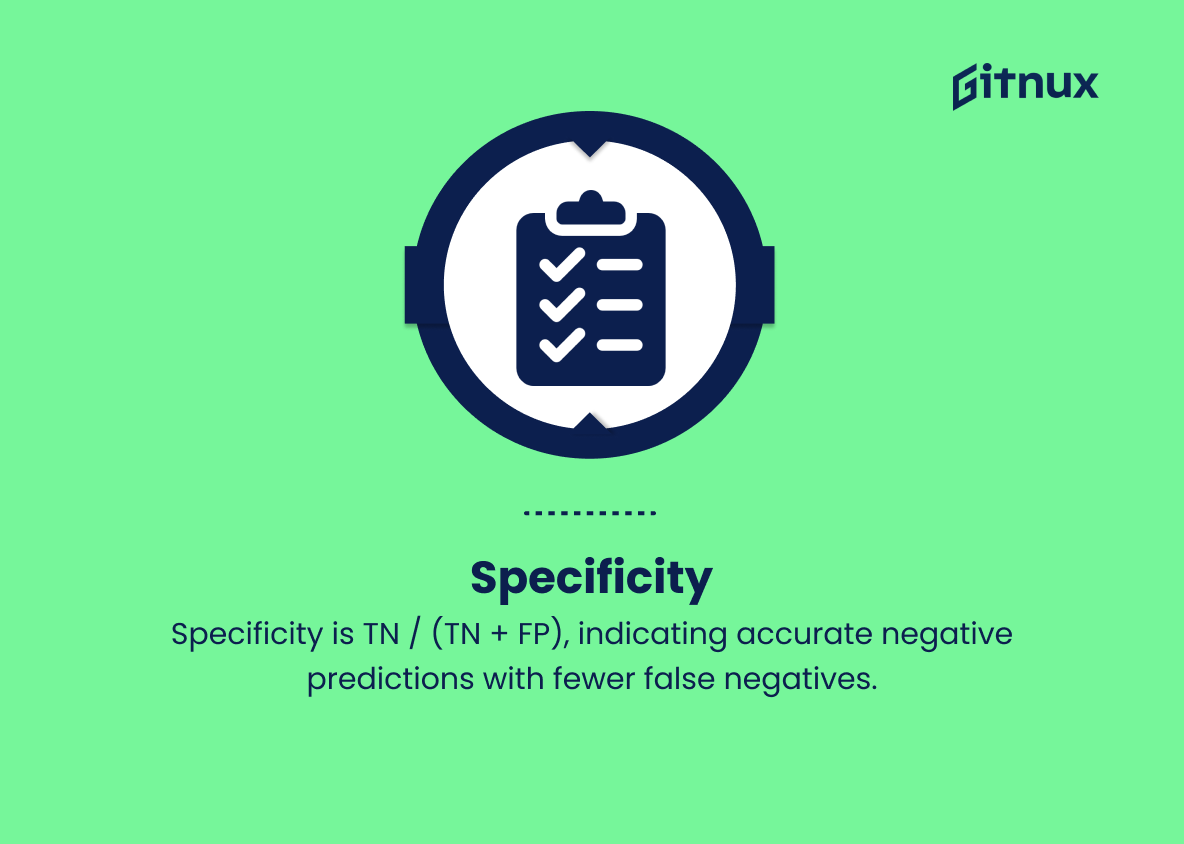
5. Specificity
The proportion of true negatives (TN) out of the total actual negatives (TN + FP). High specificity indicates that the AI model accurately predicts negative instances and produces fewer false negatives.
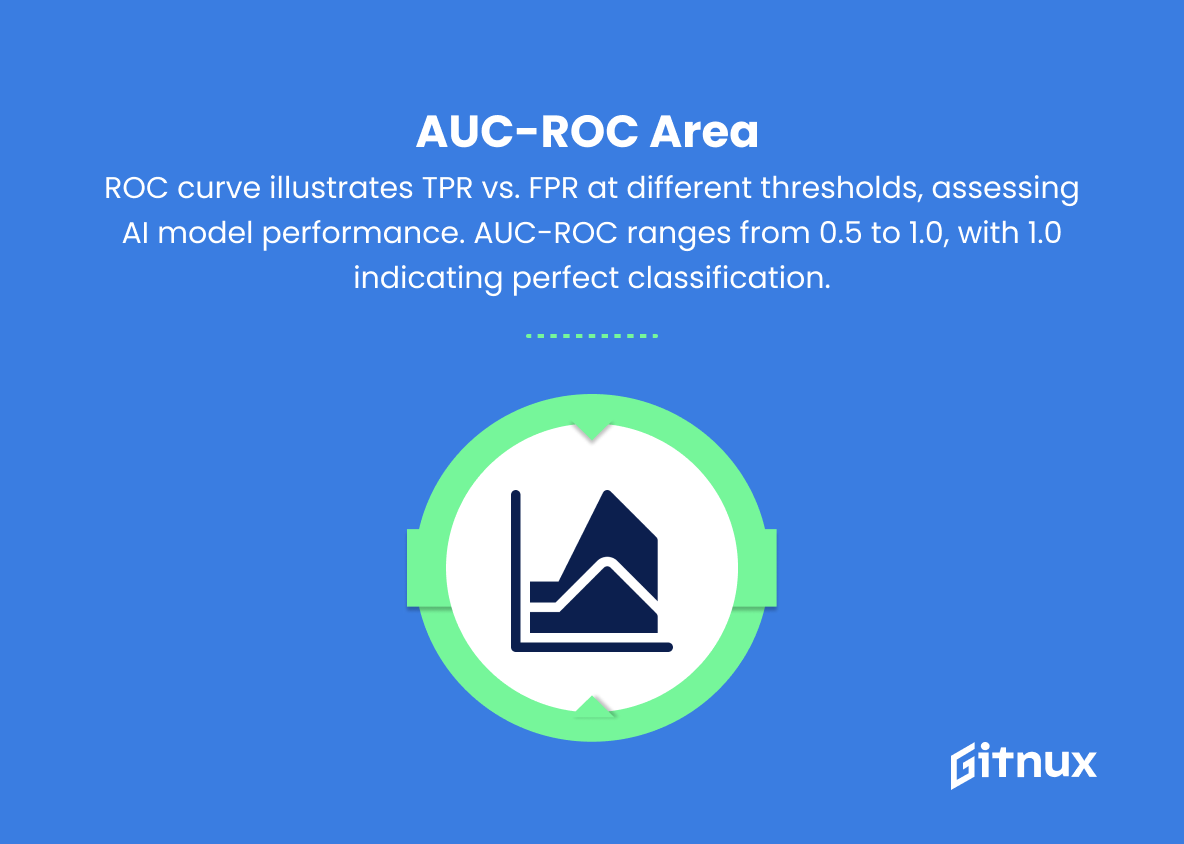
6. Area Under the Receiver Operating Characteristic (ROC) Curve (AUC-ROC)
A plot representing the true positive rate (TPR) against the false positive rate (FPR) at various classification thresholds. It evaluates the performance of an AI model at different decision boundaries. The AUC-ROC value ranges from 0.5 to 1.0, with 1.0 indicating perfect classification.
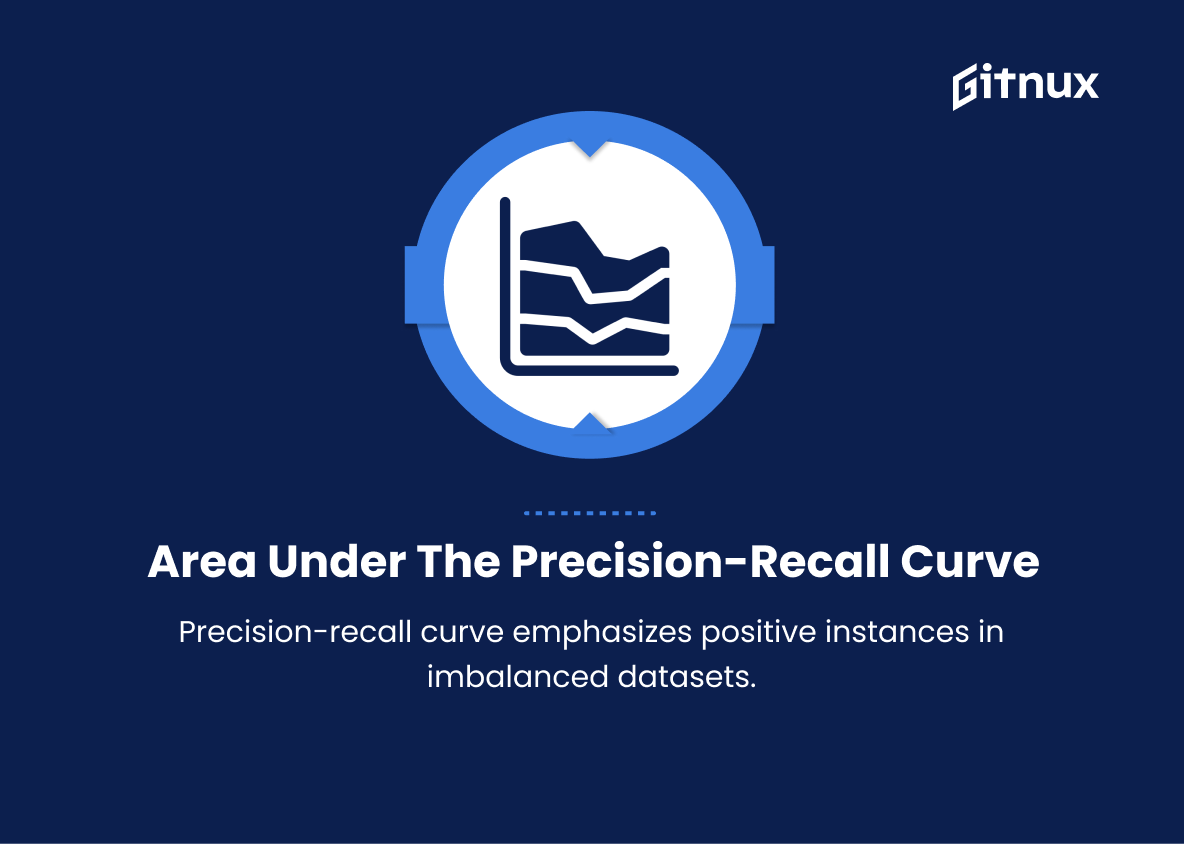
7. Area Under the Precision-Recall Curve (AUC-PR)
A plot showing the relationship between precision and recall at various classification thresholds. It is more relevant than AUC-ROC when dealing with imbalanced datasets, as it focuses on positive instances.
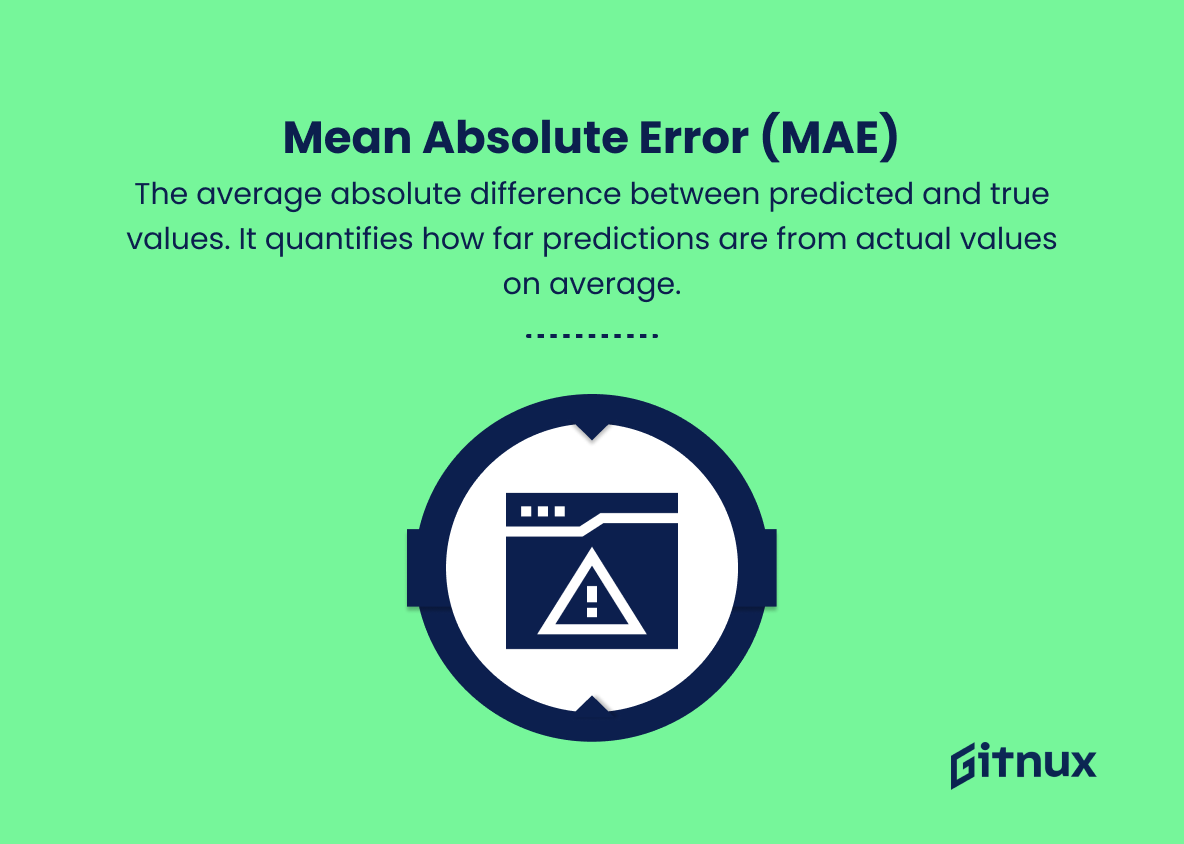
8. Mean Absolute Error (MAE)
The average absolute difference between predicted and true values. It quantifies how far predictions are from actual values on average.
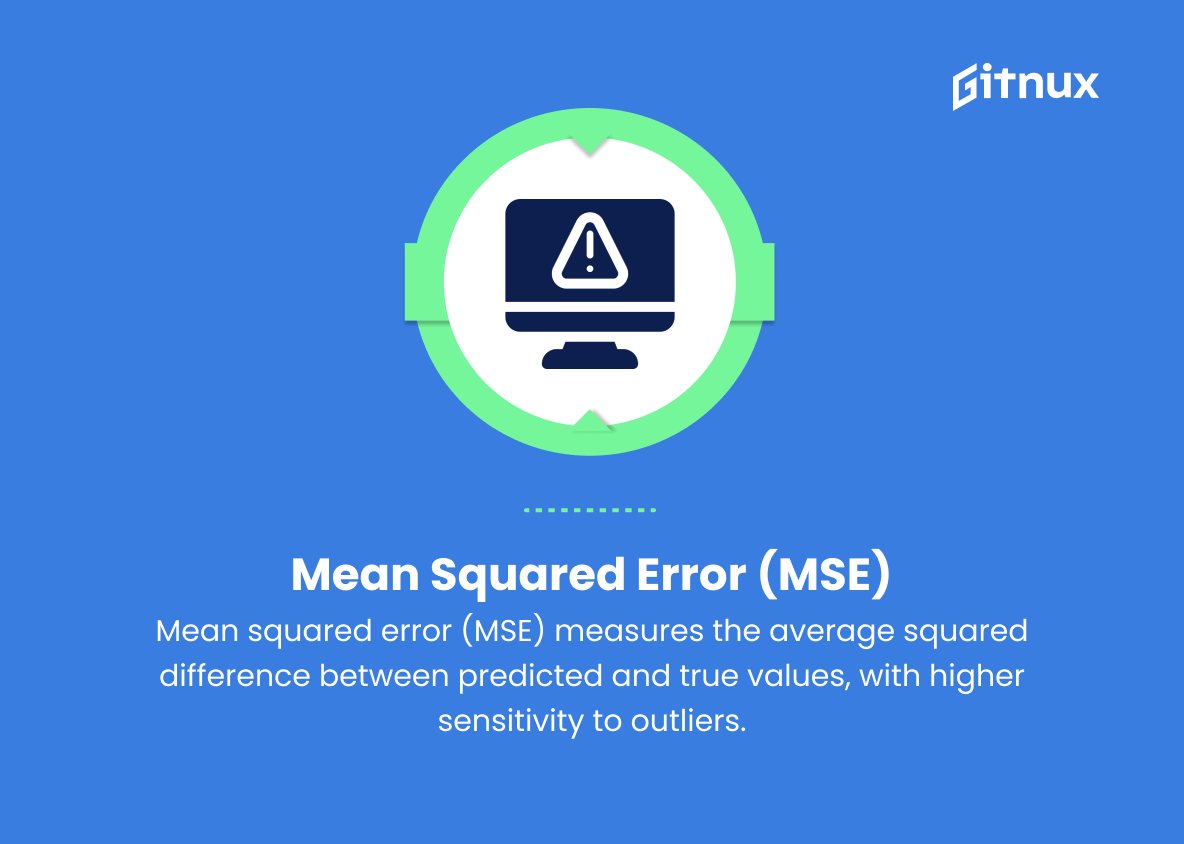
9. Mean Squared Error (MSE)
The average squared difference between predicted and true values. It penalizes larger errors more than smaller errors, making it more sensitive to outliers.
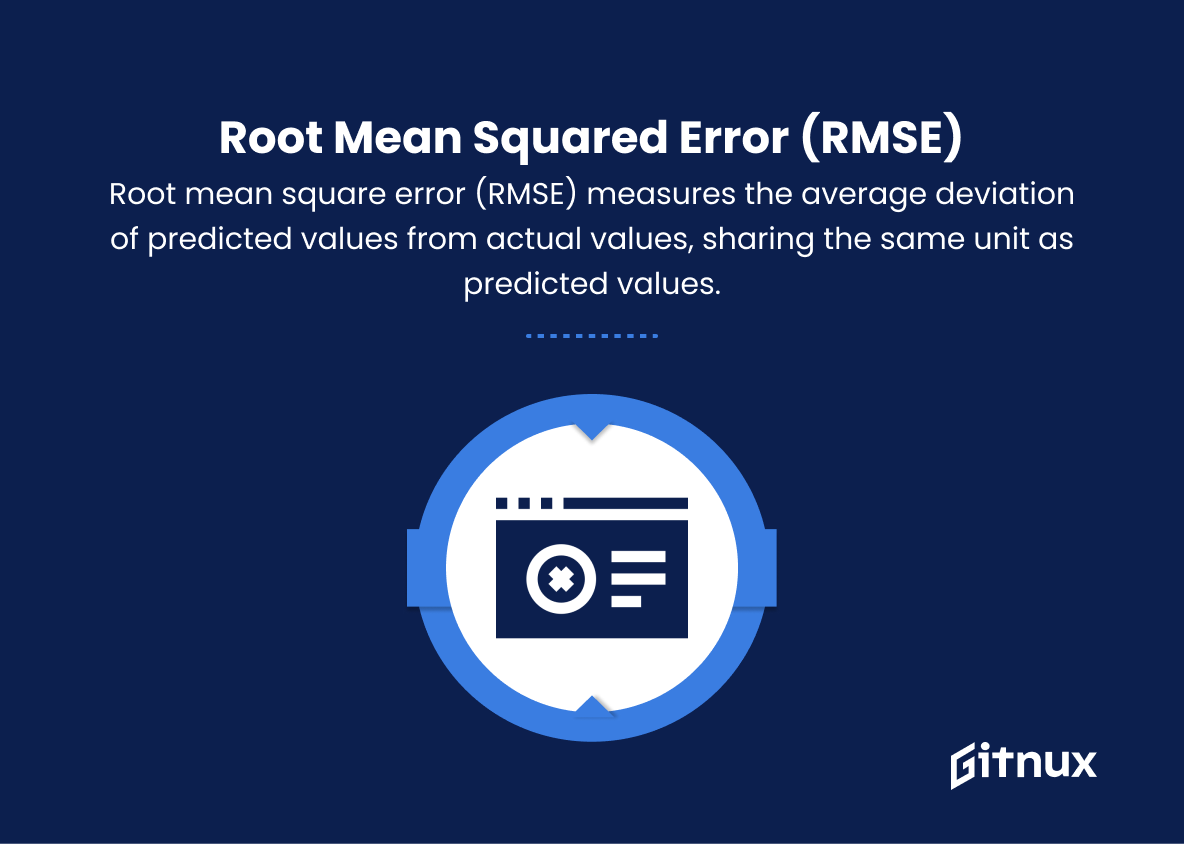
10. Root Mean Squared Error (RMSE)
The square root of the mean squared error. It is used to measure the average deviation of predicted values from actual values and has the same unit as the predicted values.
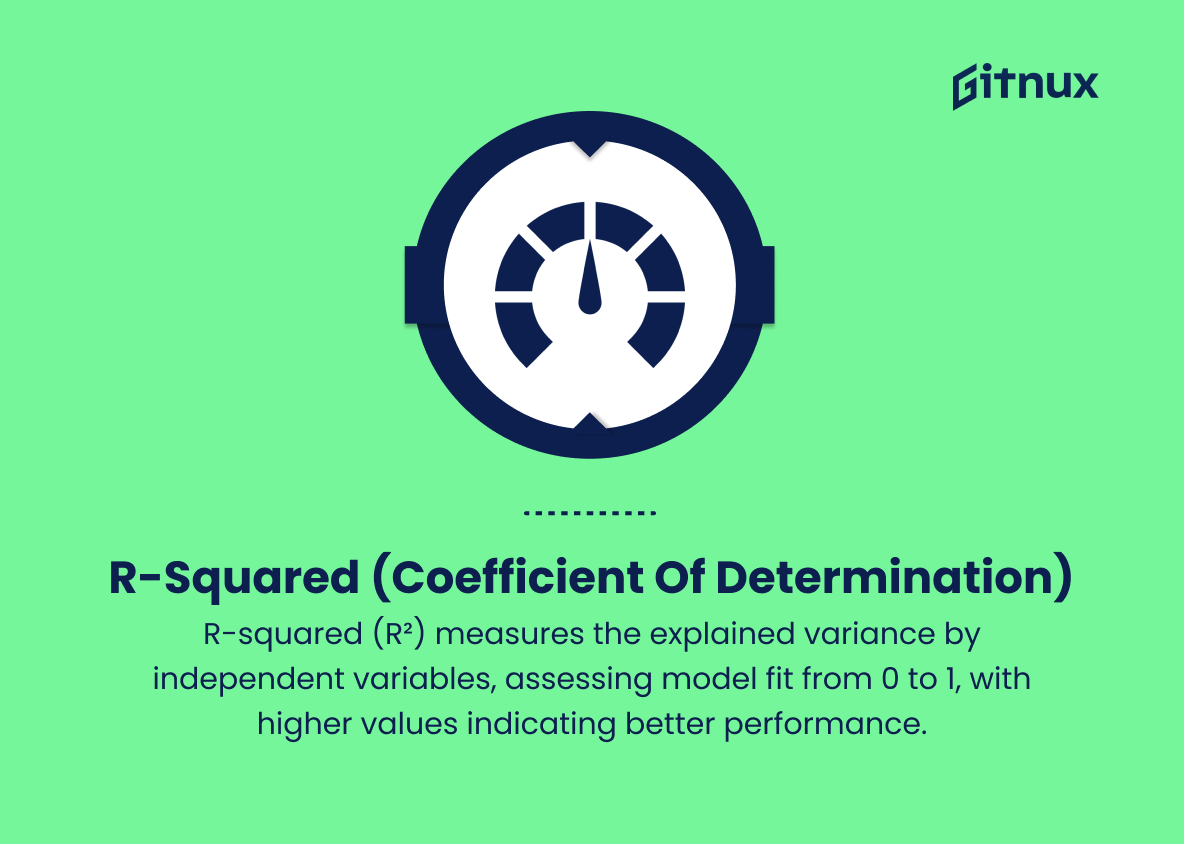
11. R-squared (Coefficient of Determination)
Measures the proportion of the variance in the dependent variable that is predictable from the independent variables. It indicates how well the AI model fits the dataset and ranges from 0 to 1, with higher values suggesting better model performance.
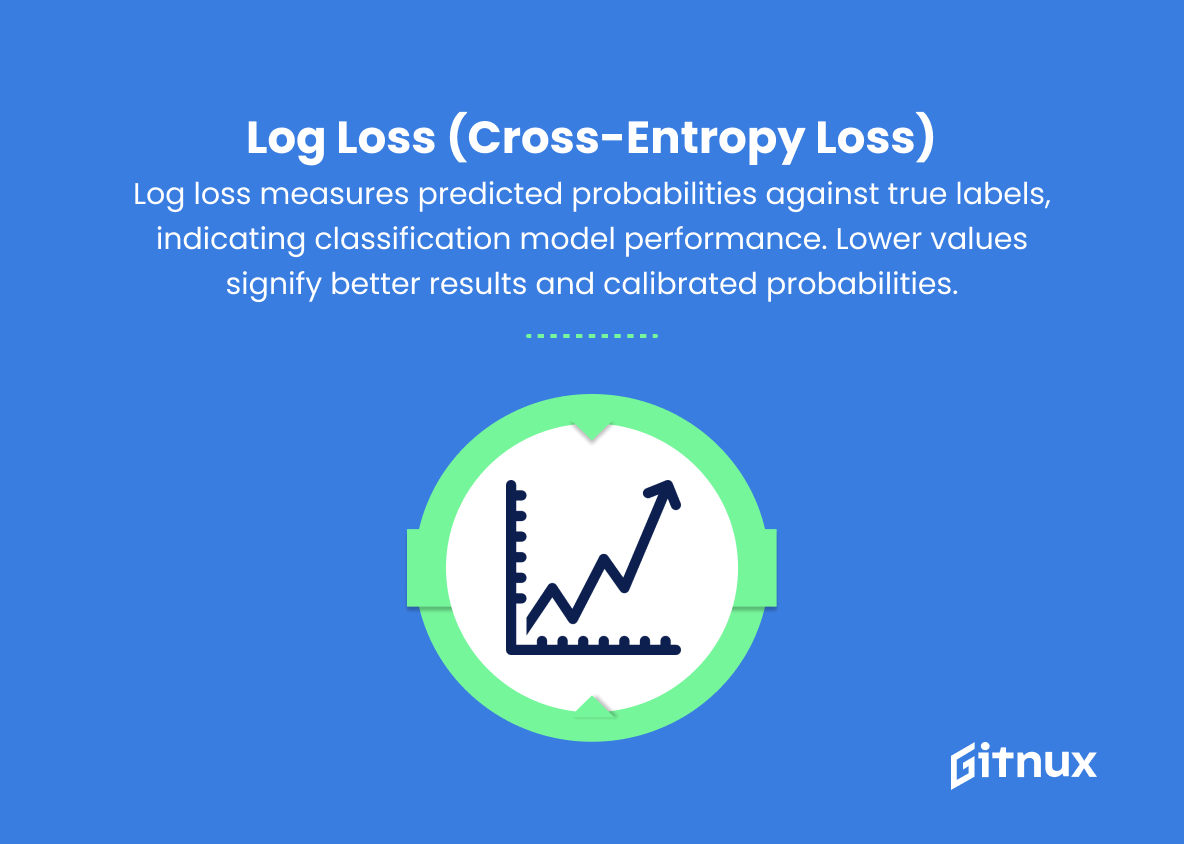
12. Log Loss (Cross-Entropy Loss)
A loss function for classification that measures the difference between predicted probabilities and true class labels. Lower log loss values represent better model performance and well-calibrated probabilities.
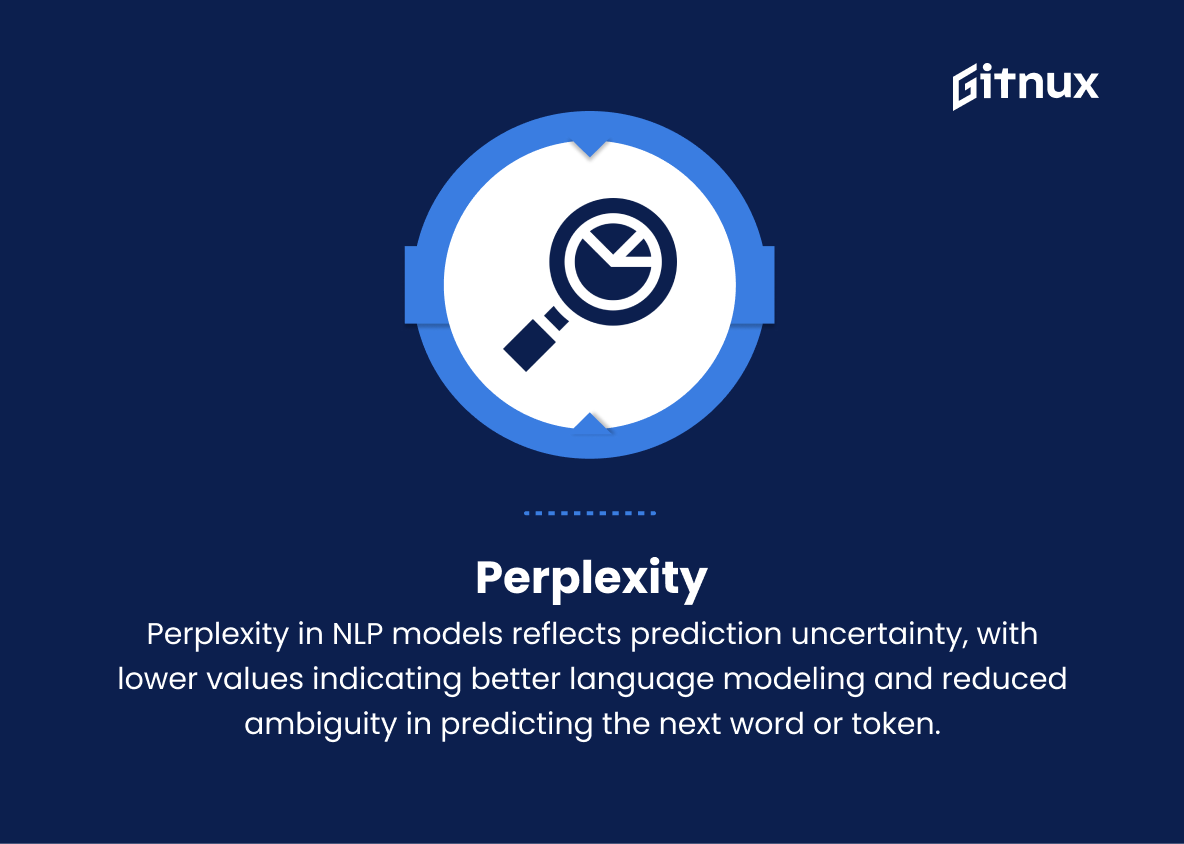
13. Perplexity
A measure of uncertainty in natural language processing (NLP) models related to their predictions. Lower perplexity implies better language modeling as it represents lower ambiguity when predicting the next word or token in a sequence.
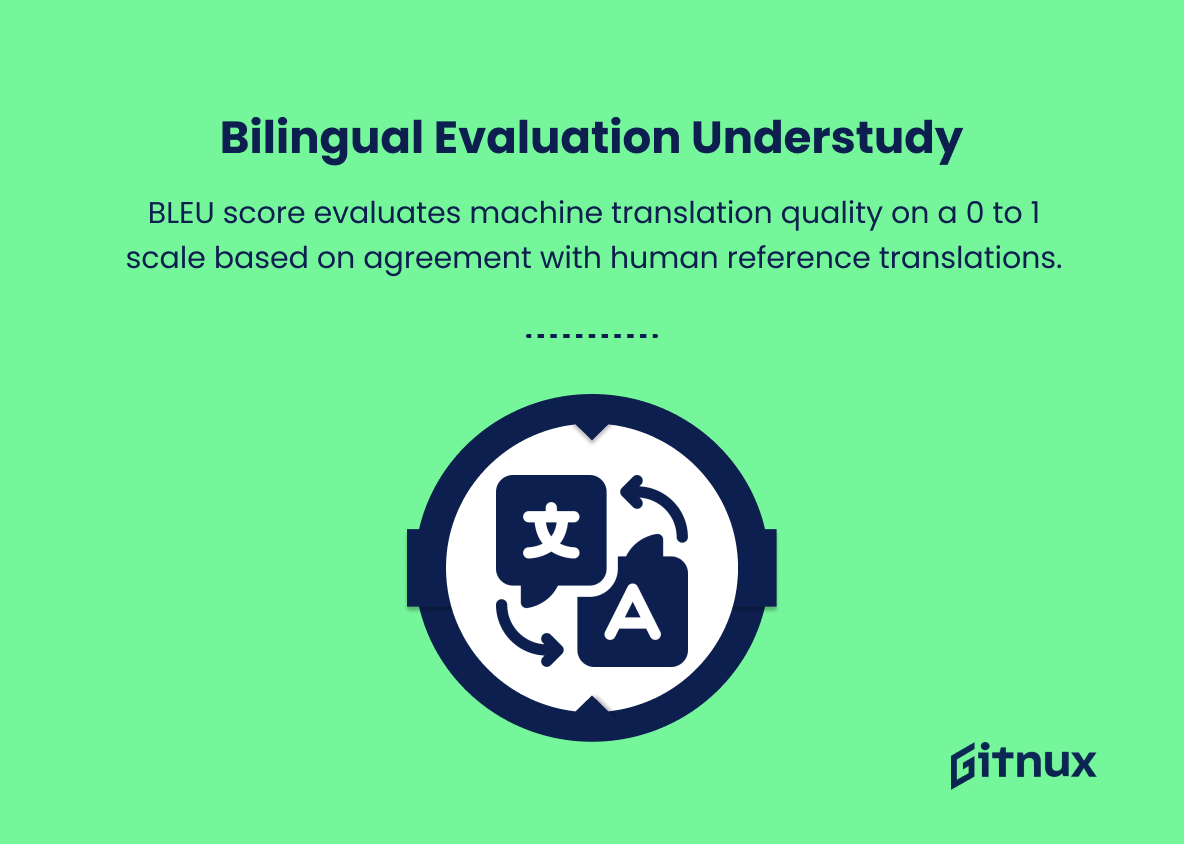
14. BLEU (Bilingual Evaluation Understudy) Score
A metric for evaluating the quality of machine translation output on a scale from 0 to 1, with higher values indicating better translations. It is based on the agreement between the machine-generated translation and human reference translations.
15. Word Error Rate (WER)
Measures the percentage of words in an AI-generated transcript (such as speech-to-text output) that differ from a reference transcript. Lower WER indicates better transcription accuracy.
16. Top-k Accuracy
A variation of accuracy that considers a prediction as correct if the true class label is among the top k predicted classes. It is useful for evaluating the performance of AI models with multiple possible outputs where users may consider more than one option.
17. Matthews Correlation Coefficient (MCC)
A balanced metric for binary classification that accounts for true positives, true negatives, false positives, and false negatives. It ranges from -1 to 1, with higher values indicating better performance, 0 indicating no better than random, and -1 showing complete disagreement.
Ai Metrics Explained
AI metrics play a crucial role in evaluating the performance of AI models across various applications. Accuracy as a measure helps in understanding the proportion of correct predictions, while precision and recall focus on the model’s ability to accurately predict positive instances and identify a high percentage of actual positive instances, respectively. The F1 score balances precision and recall, while specificity and AUC-ROC assess the model’s performance on negative instances and across different decision boundaries. AUC-PR is well-suited for imbalanced datasets, and mean absolute error (MAE), mean squared error (MSE), and root mean squared error (RMSE) quantify the deviation in predicted values.
R-squared evaluates the proportion of predictable variance, log loss compares predicted probabilities with true class labels, and perplexity measures uncertainty in NLP models. BLEU score assesses the quality of machine translations, while word error rate (WER) evaluates transcription accuracy. Top-k accuracy accounts for predictions in the top k predicted classes, and the Matthews correlation coefficient (MCC) offers a balanced metric for binary classification. These varied metrics help AI practitioners optimize their models by providing insights into different aspects of system performance, ultimately leading to well-functioning and reliable AI solutions across domains.
Conclusion
In summary, the evolving landscape of AI metrics showcases the significant advancements in artificial intelligence’s capabilities and understanding. As these metrics continue to improve and become more refined, the implications for various industries, from healthcare to finance, will be enormous. As experts and enthusiasts in the AI field, it’s essential for us to stay updated on these developments, critically analyze their merits, and contribute to the ongoing dialogue surrounding AI’s impact on society. In doing so, we can ensure a more accurate, reliable, and ethical future for AI and its applications.
