
01 Industry overview
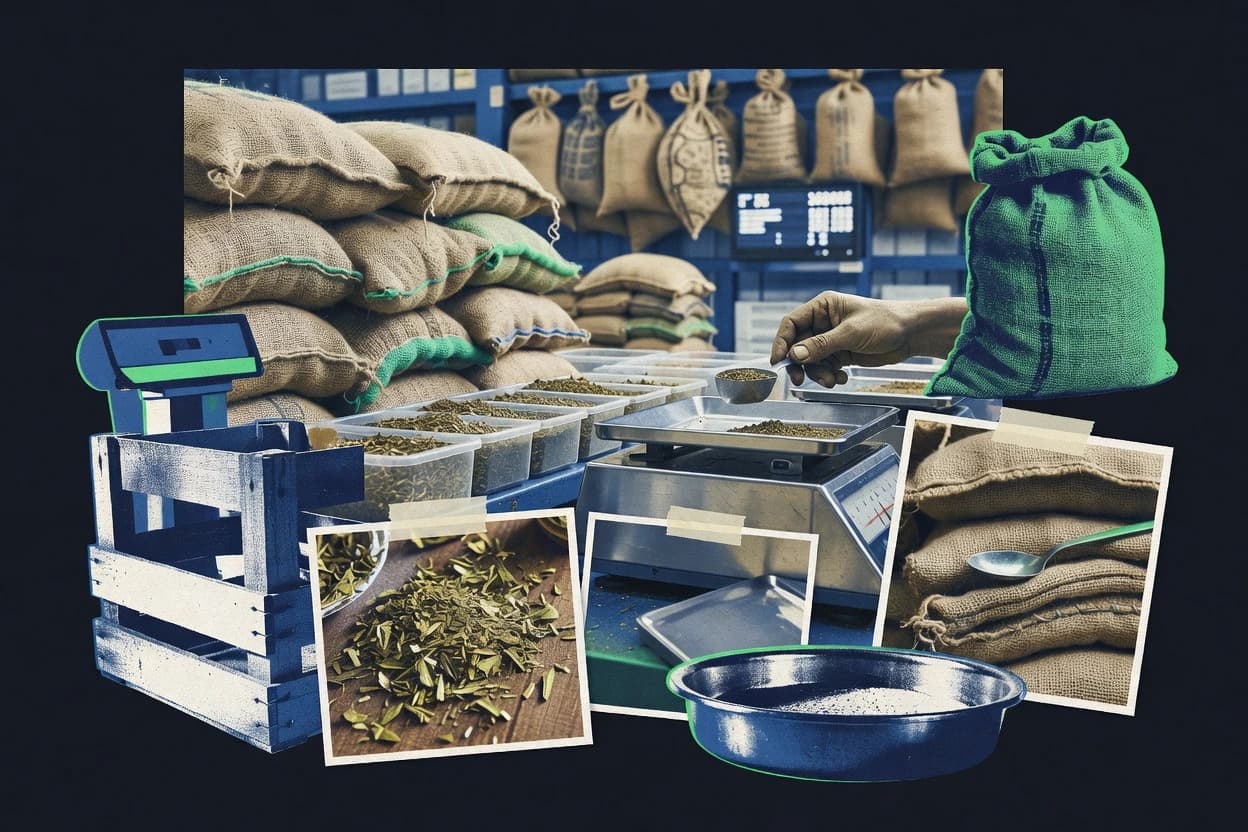
The yerba mate industry at a glance
The global yerba mate market reached an estimated $2.1 billion in 2025, while South American producers remain central to supply and Argentina’s domestic consumption rose to 266.8 million kilograms.
- $2.1B
- Global market size, 2025
- 4.5%
- Forecast CAGR, 2025–2030
- 870,537 tonnes
- Brazil production, 2025
- 266.8M kg
- Argentina domestic consumption, 2025
- Market size
- The global yerba mate market was estimated at $2.1 billion in 2025. Argentina’s yerba mate chain processed 889.3 million kilograms of green leaf during 2025, while Brazil recorded 870,537 tonnes of cultivated production.
- Forecast & CAGR
- The market is forecast to reach $2.62 billion by 2030, implying a 4.5% compound annual growth rate from 2025 to 2030. Longer-range estimates vary by market definition, with one 2026 study projecting $2.6 billion by 2034 and a 4.41% CAGR for 2026–2034.
- Market share & regions
- Production is concentrated in South America. Brazil’s 2025 cultivated output was 870,537 tonnes, while Argentina’s 2024 campaign produced 987,117 tonnes of green leaf; Brazil’s native-forest yerba mate production was also 99% concentrated in southern states in 2023.
- Segmentation
- The market is segmented by product form, distribution channel and application. One 2026 market study identifies powder and liquid concentrate as principal form categories, while offline and online channels are the main distribution segments; Argentina’s industry also distinguishes loose yerba, processed yerba, extracts and beverages.
- Key players & concentration
- Argentina’s 2024–2025 industry data listed 13,965 yerba-mate producers and 108 mills and packers, indicating a broad production base but a much smaller industrial processing tier. Paraguay’s 2025 investment guide reported approximately 21,000 hectares of plantations and about 40,000 tonnes of processed production.
- Pricing
- Argentina’s 2025 regional-industry presentation reported a market price of approximately 190–210 pesos per kilogram for green leaf. The same source reported an average export price of $2,217.2 per tonne of green leaf on a 2024 campaign basis.
- Trends, drivers & challenges
- Demand is supported by health-conscious consumption and beverage innovation, including ready-to-drink formats. Supply-side challenges include climate stress, pressure on producer economics and changing regulation; Argentina processed 889.3 million kilograms of green leaf in 2025, while Paraguay’s industry has reported difficulty expanding export markets.
- Consumer behavior & competition
- Argentina’s domestic consumption reached 266.8 million kilograms in 2025, up 3.1% from 258.8 million kilograms in 2024. Yerba mate is present in more than 90% of Argentine households, with average consumption estimated at 6.4 kilograms per person annually; competition is increasingly extending into exports and packaged beverage formats.
- Regulation
- Argentina removed limits on new yerba-mate planting in April 2025 by repealing the framework that restricted annual plantation expansion. In 2025, Resolution 61/2025 also repealed the mandatory laboratory-analysis certificate for marketing yerba mate and derivatives, while Resolution 50/2025 introduced a more digitalized registration system for industry participants.
- Latest news
- Argentina’s domestic yerba mate consumption increased 3.1% year on year to 266.8 million kilograms in 2025, according to data analyzed in a June 2026 industry report. Paraguay’s 2025 yerba mate exports generated $17.02 million, up from $11.67 million in 2024, but industry reporting in October 2026 highlighted surplus supply and the need to develop additional export markets.
02 Ranking
Top 8 Companies in the Yerba Mate Industry
The leading companies in the yerba mate industry, ranked on market impact, performance, momentum, innovation and brand popularity.
Updated November 20, 2026 · Next review December 20, 2026
Baldo stands out for cross-border manufacturing reach because it controls Uruguay’s Canarias company, while La Cachuera leads in Amanda yerba mate exports since it produces and exports from Misiones.
Ranked by Overall score · How we score ↓
Editor's top 3 picks
Where to start, by need.
#1 Overall · Leader in export brand distribution
Baldo
BR
Ranked #1 · 9.5 · Export brand distribution
Why we picked it: Its Brazilian manufacturing footprint and Uruguay-linked structure support brand supply across national and export channels.
#2 overall
La Cachuera
AR
Ranked #2 · 9.2 · Export brand distribution
Why we picked it: Its Misiones-based Amanda yerba mate output and export focus concentrate execution in one agricultural origin.
Leader in agricultural cultivation
Hreñuk
AR
Ranked #5 · 8.6 · Agricultural cultivation
Why we picked it: Integrated operations link agricultural sourcing to processing and Rosamonte market distribution under one chain.
Pick 1 is the #1 company overall. Pick 2 is the highest-ranked company in the top 5 that adds a new segment; no further segment places in the top 5, so pick 3 follows rank.
Full ranking
| # | Company | Overall ↓ | Impact | Performance | Momentum | Innovation | Company snapshot |
|---|---|---|---|---|---|---|---|
| 1 | Baldo Export brand distribution · BR | 9.5 | 9.9 | 9.6 | 9.5 | 8.7 | |
Company snapshot · Baldo · Data as of November 20, 2026 Baldo operates multiple Brazilian erva-mate factories and controls Uruguay's Canarias company.[16]
| |||||||
| 2 | La Cachuera Export brand distribution · AR | 9.2 | 8.4 | 9.9 | 9.9 | 8.7 | |
Company snapshot · La Cachuera · Data as of November 20, 2026 La Cachuera produces and exports Amanda yerba mate from Misiones.[17]
| |||||||
| 3 | Cooperativa Agrícola de la Colonia Liebig Export brand distribution · AR | 9.1 | 9.8 | 9.2 | 8.8 | 8.2 | |
Company snapshot · Cooperativa Agrícola de la Colonia Liebig · Data as of November 20, 2026 Its Playadito brand leads Argentina and reaches more than 29 countries.[18]
| |||||||
| 4 | Barão Export brand distribution · BR | 8.9 | 7.8 | 9.6 | 9.1 | 9.9 | |
Company snapshot · Barão · Data as of November 20, 2026 Barão has produced erva-mate and mate teas since 1951 for domestic and export markets.[19]
| |||||||
| 5 | Hreñuk Agricultural cultivation · AR | 8.6 | 8.2 | 9.2 | 8.8 | 8.2 | |
Company snapshot · Hreñuk · Data as of November 20, 2026 Hreñuk produces, processes and markets Rosamonte yerba mate.[20]
| |||||||
| 6 | Cordeiro y Cía. Verdeflor yerba mate and herbal infusions · AR | 8.3 | 8.2 | 8.8 | 8.4 | 7.6 | |
Company snapshot · Cordeiro y Cía. · Data as of November 20, 2026 Cordeiro operates Verdeflor and owns a yerba-mate drying facility in Misiones.[21]
| |||||||
| 7 | Molinos Río de la Plata Cruz de Malta and Nobleza Gaucha yerba mate · AR | 7.6 | 8.2 | 7.0 | 7.0 | 8.2 | |
Company snapshot · Molinos Río de la Plata · Data as of November 20, 2026 Molinos markets Cruz de Malta and Nobleza Gaucha yerba mate brands.[22]
| |||||||
| 8 | Cooperativa de Trabajo La Hoja La Hoja yerba mate, Argentina · AR | 7.4 | 7.0 | 8.1 | 7.6 | 7.0 | |
Company snapshot · Cooperativa de Trabajo La Hoja · Data as of November 20, 2026 La Hoja is an operating cooperative listed among Argentina's packaged yerba producers.[23]
| |||||||
How we score
- Impact (30%): scale and weight in the market (revenue, market share, employees, market position).
- Performance (20%): recent revenue growth and operating margin; an analyst assessment where a company does not publish them.
- Momentum (20%): growth trajectory and future potential.
- Innovation (15%): R&D intensity and how technologically advanced the company is.
Popularity (brand search demand, 15%) counts toward Overall but is not published as a column. Overall leaves out what is not known.
Scale Scores are shown on a 7–10 scale with one decimal; bars start at 7.0.
Cadence Recalculated when new figures are published; next review December 20, 2026.
Independence. Rankings are editorially independent. Scores, ranks, picks and the verdict follow the method above; no company can pay to change them.
Cite this ranking
APA
Samuel Norberg. (2026, November 20). Top 8 companies in the yerba mate industry. In Yerba Mate Industry Statistics. Gitnux. https://gitnux.org/yerba-mate-industry-statistics/#top-companies
Yerba mate green-leaf intake at drying facilities (Argentina)
Yerba mate green-leaf intake at drying facilities grew from 690K tonnes in 2017 to 829K tonnes in 2022.
03 Statistics
Market Intelligence
Exports and mill dispatches anchor the 2024 footprint: Argentina exported 43,287 tonnes worth USD 95.21 million FOB and dispatched 258,000 tonnes from mills.
Market size, volume and shipments in the yerba mate industry
- 43,287 tonnes worth USD 95.21 million FOB were exported by Argentina in 2024; customs product scope is yerba mate under the national export series.[1]
- 258,000 tonnes of yerba mate were dispatched from Argentine mills in 2024; the dispatch measure covers processed product leaving mills.[2]
- 982,479 thousand reais was the value of Brazil’s erva-mate production in 2025; this is farm-gate production value, not processed-market revenue.[3]
- 987,117 tonnes of green-leaf yerba mate were produced in Argentina in campaign 2023/24; the agricultural classification measures harvested raw leaf, not processed product.[4]
- 870,537 tonnes of cultivated erva-mate were produced in Brazil in 2025; the Brazilian agricultural series reports physical output from municipal production statistics.[3]
- 45,734 tonnes worth USD 101.4 million were Argentina’s 2024 yerba-mate exports in an official sector summary; the series includes exported processed yerba mate.[1]
Forecast growth and shipments in the yerba mate industry
- The global yerba-mate market is forecast to increase from USD 2.96 billion in 2025 to USD 4.25 billion in 2031 at a 6.2% CAGR.[5]
- The global yerba-mate market is forecast to grow from USD 1.76 billion in 2025 to USD 2.6 billion by 2034, implying the publisher’s stated forward market outlook for packaged yerba-mate products.[6]
- The global yerba-mate market is projected to rise from USD 2.1 billion in 2025 to USD 2.62 billion in 2030 at a 4.5% CAGR.[7]
Company counts and size structure in the yerba mate industry
- 19,003 establishments cultivated erva-mate in Brazil; this establishment count is from the 2017 agricultural census and no newer establishment count was shown on the current IBGE product page.[3]
- 13,965 yerba-mate producers operated in Argentina in campaign 2023/24; the government chain count covers primary producers.[4]
- 108 Argentine millers and fractioners were identified in campaign 2023/24; the count covers downstream processing operators.[4]
Regional split of the yerba mate industry
- Southern Brazil accounted for 99% of national erva-mate production in 2023; the regional scope covers Brazil’s South region rather than the global industry.[8]
- Syria received 31,912 tonnes, or 68% of Argentina’s yerba-mate export volume, in 2024; Chile received 3,649 tonnes, or 9%.[1]
- Misiones produced 837,291 tonnes and Corrientes 149,826 tonnes of Argentine green-leaf yerba mate in campaign 2023/24, representing 88% and 12% of national output respectively.[4]
04 Statistics
Product & Standards
Quality constraints specify measurable thresholds, including 5.00% maximum moisture at canchadora exit and 0.5% maximum seeds-and-drupes content.
Standards, grades and specs for yerba mate
- 5.00% is the maximum moisture at the canchadora exit and 7% in storage under Argentina’s INYM raw-material quality-control regulation, Resolution 287/2022.[9]
- 7.00% is the maximum proportion of leaf material retained on the 420-micrometre sieve that may consist of black points under Argentina’s INYM canchada-quality regulation, Resolution 287/2022.[9]
- 7.00% is the maximum moisture content for Argentine yerba-mate quality-protocol products under Resolution SAGPyA 271/2007; the protocol also specifies IRAM 20.503 for testing.[9]
- 0.5% is the maximum seeds-and-drupes content under Argentina’s Yerba Mate Argentina quality protocol, measured using IRAM 20.531.[9]
05 Statistics
Trade & Footprint
Tariffs are simple for key markets: the European Union’s third-country tariff for yerba mate is 0%, and the United States applies Free under HTS 0903.00.00 with kilograms as the unit.
Tariffs and trade policy for yerba mate
- The European Union’s third-country tariff for yerba mate under TARIC heading 0903 is 0%.[4]
- The United States applies a general duty of Free to maté under HTS 0903.00.00; the unit of quantity is kilograms and the classification is Harmonized System-based.[10]
- Argentina’s export duty for the yerba-mate customs line 09030090 was 0.0% in the June 2024 tariff schedule.[11]
- The United States applies a 10% Column 2 duty to maté under HTS 0903.00.00; the unit of quantity is kilograms.[10]
06 Statistics
Regulation & Risk
Sanitary and labeling risk appears in recalls, including anthraquinone exceedances and a caffeine-warning labelling recall in 355-mL cans.
Recalls and safety notices for yerba mate
- 1 recall affected Piporé yerba mate sold in France on August 6, 2025, after sanitary inspection found anthraquinone above the authorized limit.[12]
- 2 Mateína yerba-mate sparkling infusion products in 355-mL cans were recalled in Quebec on August 11, 2023, for non-compliant caffeine-warning labelling; no consumer reactions were reported.[13]
- 1 recall affected 250-g Amanda yerba mate lots sold across 18 French departments on April 8, 2026, because anthraquinone exceeded permitted pesticide limits.[12]
07 Statistics
Sustainability
Reported footprints distinguish drying and logistics: a 2022 Misiones life-cycle assessment shows 0.927 kg CO₂e per kilogram from drying, and 1.24 kg CO₂e per kilogram total across stages plus 1,200-km transport.
Energy use and emissions in the yerba mate industry
- 0.927 kg CO₂e per kilogram of yerba mate came from drying, including 0.866 kg from drying machinery and 0.061 kg from operating energy, in a 2022 Misiones life-cycle assessment.[14]
- 1.24 kg CO₂e per kilogram of packaged yerba mate was emitted across cultivation, processing, packaging and 1,200-km transport to Buenos Aires in a 2022 Misiones life-cycle assessment.[14]
- 0.85 kg CO₂e per kilogram is the reported farm-stage footprint for yerba mate in South America in CarbonCloud’s verified climate-footprint dataset.[15]
Key questions about the yerba mate industry
What was the global yerba mate market size in 2025?
How fast is the market growing into 2030?
Which companies lead the yerba mate industry?
What technology or format shifts are showing up in this industry?
How is the production base structured across the industry?
What 2025 regulatory changes affect market participation?
Cite This Report
This report is designed to be cited. We maintain stable URLs and versioned verification dates. Copy the format appropriate for your publication below.
Samuel Norberg. (2026, November 20). Yerba Mate Industry Statistics. Gitnux. https://gitnux.org/yerba-mate-industry-statistics
Samuel Norberg. "Yerba Mate Industry Statistics." Gitnux, 20 Nov 2026, https://gitnux.org/yerba-mate-industry-statistics.
Samuel Norberg. 2026. "Yerba Mate Industry Statistics." Gitnux. https://gitnux.org/yerba-mate-industry-statistics.
Sources & references
23 sources cited across this report
- alimentosargentinos.magyp.gob.ar
- indec.gob.ar
- ibge.gov.br
- magyp.gob.ar
deepmarketinsights.com
theinsightpartners.com
thebusinessresearchcompany.com
- publicacoes-snif.florestal.gov.br
- argentina.gob.ar
learning.usitc.gov
- consejoagroindustrialargentino.org.ar
- rappel.conso.gouv.fr
recalls-rappels.canada.ca
mdpi.com
apps.carboncloud.com
- loja.baldo.com.br
- yerbamanda.com.ar
- cooperativaliebig.com.ar
- baraoervamate.com.br
- rosamonte.com.ar
- grupocordeiro.com.ar
molinos.com.ar
- yerbamateargentina.org.ar