
01 Industry overview
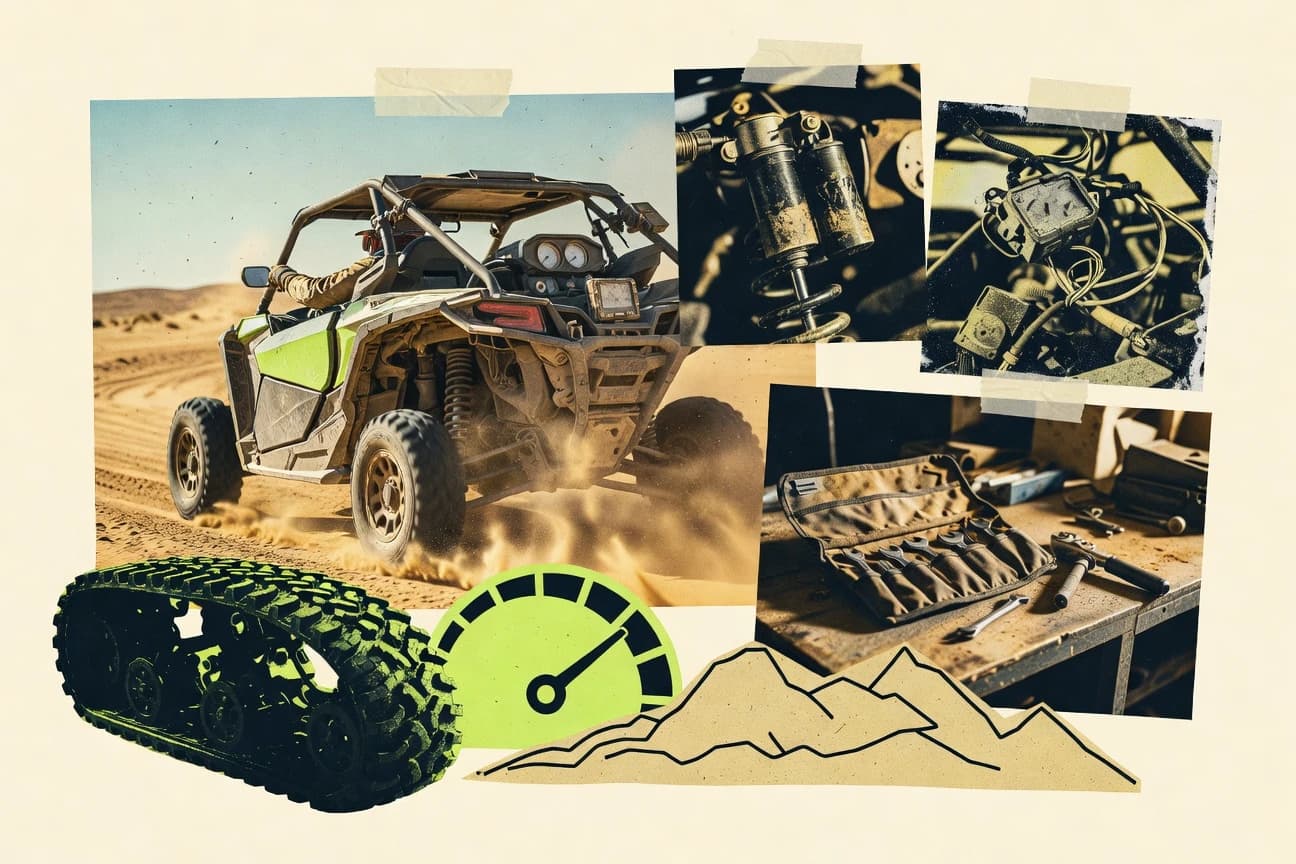
The utv industry at a glance
The global UTV market was valued at $9.6 billion in 2025 and is forecast to reach $10.2 billion in 2026, as utility demand, recreational use and premium vehicle pricing support continued growth.
- $9.6B[3]
- Global market size, 2025
- 5.3%[3]
- Forecast CAGR, 2026–2035
- 47.6%[4]
- North America revenue share, 2024
- $1.82B[2]
- Polaris Powersports sales, Q3 2026
- Market size
- The global utility terrain vehicle market was valued at $9.6 billion in 2025, based on an estimated 575,141 units and an average selling price of $16,800. A separate estimate placed the market at $9.26 billion in 2025, illustrating variation caused by differences in market definitions and coverage.[3][9]
- Forecast & CAGR
- Global UTV revenue is forecast to rise from $10.2 billion in 2026 to $16.1 billion by 2035, representing an approximately 5.3% CAGR. Grand View Research forecasts a 5.7% CAGR from 2025 to 2030, with the market reaching $9.8 billion in 2030.[3][4]
- Market share & regions
- North America held 47.6% of global UTV market revenue in 2024, making it the largest regional market. Global Market Insights also identifies North America as the leading region in 2025, supported by established agricultural, commercial and recreational demand.[4][3]
- Segmentation
- Utility/work UTVs generated $5.2 billion in 2025 and accounted for 54.06% of global revenue, while sport UTVs generated $2.6 billion and represented 26.95%. By propulsion, gasoline vehicles held 68.9% of the market in 2024, while the 400–800 cc displacement segment held 54.8%.[3][4]
- Key players & concentration
- The principal global manufacturers include Polaris, BRP, Honda, Yamaha, Kawasaki, CFMOTO, Suzuki, Textron and other regional producers. Polaris describes RANGER as the number-one-selling utility side-by-side brand for 27 years, while BRP reported that Can-Am held the number-two position in the global recreational side-by-side vehicle market in season 2025.[10][11]
- Pricing
- Global Market Insights estimated an average UTV selling price of $16,800 in 2025 and projects it to reach $20,095 by 2035. Polaris introduced the 2026 RANGER 500 with a U.S. manufacturer suggested retail price of $9,999, indicating a lower-priced entry point below the market average.[3][10]
- Trends, drivers & challenges
- Growth is being supported by demand from agriculture, construction, commercial work, outdoor recreation, defense and public-safety users, alongside higher-value features such as advanced suspension, electronic controls and accessory customization. Challenges include affordability pressures, higher financing costs, tariffs and the safety risks associated with off-highway vehicle use.[4][2][8]
- Consumer behavior & competition
- UTV demand spans farm and ranch operators, commercial fleets, trail riders and recreational buyers; utility models compete on payload, towing, durability and dealer support, while sport models compete on power, suspension and technology. Polaris reported that North American ORV industry retail sales were flat year over year in the third quarter of 2026, while its utility ORV retail sales increased 6%.[2][3]
- Regulation
- In the United States, the Consumer Product Safety Commission requires covered ATV products to comply with applicable safety standards and requires manufacturers or importers to issue a General Certificate of Compliance for general-use products. CPSC recorded 53 reported UTV-related fatalities in its 2025 off-highway vehicle report, covering 2020–2024 data.[8]
- Latest news
- Polaris reported third-quarter 2026 sales of $2.043 billion, including $1.822 billion from its Powersports segment, up 18% year over year. The company said North American ORV retail sales were up by low single digits and that it recorded its sixth consecutive quarter of ORV market-share gains.[2]
02 Ranking
Top 10 Companies in the Utv Industry
The leading companies in the utv industry, ranked on market impact, performance, momentum, innovation and brand popularity.
Updated November 21, 2026 · Next review December 21, 2026
CFMOTO stands out for export-scale value UTV and side-by-sides because it accounted for 74% of China’s 2025 all-terrain vehicle export value, while Yamaha Motor focuses on outdoor land vehicle revenue since FY2025 Outdoor Land Vehicle revenue reached JPY 148.5 billion including Wolverine UTVs.
Ranked by Overall score · How we score ↓
Editor's top 3 picks
Where to start, by need.
#1 Overall · Leader in utility and recreational UTVs
CFMOTO
CN
Ranked #1 · 9.0 · Utility and recreational UTVs
Why we picked it: Its value-oriented ATV and side-by-side scale is reflected in 74% of China’s 2025 export value.
#2 overall
Yamaha Motor
JP
Ranked #2 · 8.6 · Utility and recreational UTVs
Why we picked it: Its outdoor land vehicle revenue base includes Wolverine UTVs, totaling JPY 148.5 billion in FY2025.
#3 overall
BRP
CA
Ranked #3 · 8.5 · Utility and recreational UTVs
Why we picked it: Can-Am side-by-side and Defender and Maverick platforms; #2 global recreational SSV share
Pick 1 is the #1 company overall. No other segment places in the top 5, so picks 2 and 3 follow rank.
Full ranking
| # | Company | Overall ↓ | Impact | Performance | Momentum | Innovation | Company snapshot |
|---|---|---|---|---|---|---|---|
| 1 | CFMOTO Utility and recreational UTVs · CN | 9.0 | 8.0 | 9.9 | 9.9 | 8.3 | |
Company snapshot · CFMOTO · Data as of November 21, 2026 74% of China's 2025 all-terrain vehicle export value; top-5 global UTV value share.[12]
| |||||||
| 2 | Yamaha Motor Utility and recreational UTVs · JP | 8.6 | 9.0 | 7.8 | 7.9 | 9.9 | |
Company snapshot · Yamaha Motor · Data as of November 21, 2026 FY2025 Outdoor Land Vehicle revenue JPY 148.5 billion including Wolverine UTVs.[13]
| |||||||
| 3 | BRP Utility and recreational UTVs · CA | 8.5 | 9.1 | 8.4 | 8.2 | 8.1 | |
Company snapshot · BRP · Data as of November 21, 2026 Can-Am holds #2 global recreational SSV share with Defender and Maverick platforms.[2]
| |||||||
| 4 | Polaris Utility and recreational UTVs · US | 8.5 | 9.9 | 7.7 | 7.3 | 8.1 | |
Company snapshot · Polaris · Data as of November 21, 2026 North America off-road vehicle market share leader in 2025; gained share in all segments.[2]
| |||||||
| 5 | Kawasaki Heavy Industries Utility and recreational UTVs · JP | 8.3 | 8.0 | 8.6 | 8.9 | 7.4 | |
Company snapshot · Kawasaki Heavy Industries · Data as of November 21, 2026 Kawasaki sells TERYX side-by-side vehicles.[14]
| |||||||
| 6 | Textron Tracker Off-Road and Arctic Cat UTV/ATV maker, North America · US | 8.2 | 8.0 | 9.0 | 8.6 | 7.0 | |
Company snapshot · Textron · Data as of November 21, 2026 Named among primary recreational SSV manufacturers (Tracker Off-Road, Arctic Cat).[2]
| |||||||
| 7 | Hisun Side-by-side utility and recreational vehicles, global · CN | 8.0 | 7.0 | 8.6 | 8.8 | 7.9 | |
Company snapshot · Hisun · Data as of November 21, 2026 Hisun offers utility and recreational side-by-side vehicles.[15]
| |||||||
| 8 | Club Car Utility and golf-oriented UTV maker, North America · US | 7.9 | 7.0 | 8.6 | 7.9 | 8.9 | |
Company snapshot · Club Car · Data as of November 21, 2026 Club Car ranked among top-ten North American UTV purveyors by 2024 volume.[16]
| |||||||
| 9 | Kubota RTV diesel utility vehicle manufacturer, global · JP | 7.9 | 7.8 | 8.2 | 8.0 | 7.6 | |
Company snapshot · Kubota · Data as of November 21, 2026 Third in North American UTV production with 10.5% share; RTV-X diesel utility range.[17]
| |||||||
| 10 | Honda Pioneer side-by-sides, global · JP | 7.8 | 8.0 | 7.7 | 7.3 | 8.1 | |
Company snapshot · Honda · Data as of November 21, 2026 Honda markets Pioneer side-by-side vehicles.[18]
| |||||||
How we score
- Impact (30%): scale and weight in the market (revenue, market share, employees, market position).
- Performance (20%): recent revenue growth and operating margin; an analyst assessment where a company does not publish them.
- Momentum (20%): growth trajectory and future potential.
- Innovation (15%): R&D intensity and how technologically advanced the company is.
Popularity (brand search demand, 15%) counts toward Overall but is not published as a column. Overall leaves out what is not known.
Scale Scores are shown on a 7–10 scale with one decimal; bars start at 7.0.
Cadence Recalculated when new figures are published; next review December 21, 2026.
Independence. Rankings are editorially independent. Scores, ranks, picks and the verdict follow the method above; no company can pay to change them.
Cite this ranking
APA
Marcus Engström. (2026, February 13). Top 10 companies in the utv industry. In Utv Industry Statistics. Gitnux. https://gitnux.org/utv-industry-statistics/#top-companies
North American UTV market share by product category
Utility Crossover Vehicles (UCV) holds the largest share at 48%.
03 Trends & forecasts
Top 10 Utv Industry Trends & Forecasts 2027
What is changing in the utv industry, with the evidence behind each trend and a forecast for 2027.
Forecasts were generated by an AI model from the cited evidence. They are estimates, not guarantees.
01Utility demand outpaces recreational demand
High confidenceUtility applications remain the industry's largest demand pool, while Polaris reported that North American utility ORV retail sales increased 6% year over year in the third quarter of 2026. The 2026 RANGER 500 is explicitly positioned for landowners, farmers and small-property work at a value-oriented price point.[19][10]
Forecast 2027: Utility UTVs should continue to grow faster than sport models in 2027, supported by agriculture, property maintenance, construction and commercial fleets. Entry-level and mid-size work vehicles are likely to capture most incremental volume.
02Value models expand the addressable market
High confidencePolaris launched the 2026 RANGER 500 at a U.S. MSRP of $9,999, describing it as a value-segment vehicle with a roof, winch, LED headlights and accessory compatibility. The same model remains listed for the 2027 model year at $9,999.[10]
Forecast 2027: Manufacturers will keep using lower-priced two- and mid-size UTVs to address affordability concerns in 2027. Promotional financing and simplified trims should become more important as borrowing costs continue to influence discretionary purchases.
03Premium features lift average transaction values
High confidenceManufacturers continue to add enclosed cabs, heating and air conditioning, integrated displays, GPS trail mapping, advanced suspension and high-capacity towing to upper trims. Polaris lists the 2026 RANGER XP 1000 NorthStar above $20,000 and the extreme-duty RANGER XD 1500 NorthStar Edition above $40,000.[10]
Forecast 2027: Revenue growth should continue to exceed unit growth in 2027 as buyers trade up to comfort, suspension, connectivity and extreme-duty packages. Premiumization will be strongest in recreational sport and commercial fleet configurations.
04Electric UTV availability accelerates
High confidencePolaris lists the 2027 RANGER XP Kinetic as an all-electric utility UTV with a starting MSRP of $37,499, up to 80 miles of range and a 29.8-kWh battery in the Ultimate trim. Polaris also states that the vehicle has 70% less scheduled maintenance than a comparable gas-powered vehicle.[10]
Forecast 2027: Electric UTVs should gain share in 2027, particularly for farms, campuses, resorts, municipalities and other predictable-duty applications. Gasoline vehicles will still dominate total industry volume because of purchase price, range and charging constraints.
05Electric capability narrows the performance gap
Medium confidenceThe 2027 RANGER XP Kinetic is specified with a 110-horsepower electric motor, 140 lb-ft of torque, 1,250-pound box capacity and 2,500-pound towing capacity. Its published range reaches 80 miles in the highest-capacity configuration.[10]
Forecast 2027: In 2027, electric launches will increasingly compete on torque, towing and maintenance economics rather than only emissions. The main constraint will shift from basic capability to charging access, battery cost and cold-weather performance.
06Accessory customization becomes a larger revenue pool
High confidencePolaris says the RANGER 500 launched with 30 accessories and highlights accessory integration as a way to tailor vehicles to work and recreational use. Its broader RANGER lineup also promotes integrated accessories, displays and seasonal equipment.[10]
Forecast 2027: In 2027, OEMs and dealers will place greater emphasis on bundled accessories, attachments and service plans. Accessories should help manufacturers defend margins when base-vehicle price competition intensifies.
07Connectivity moves from premium to mainstream
Medium confidencePolaris describes RIDE COMMAND displays with GPS navigation covering more than 1.2 million miles of verified trails, alongside Bluetooth and integrated audio on selected RANGER models. These features are being offered within mainstream utility families rather than only specialist racing vehicles.[10]
Forecast 2027: By 2027, digital displays, navigation, smartphone connectivity and vehicle diagnostics should become standard or optional across more mid-range UTVs. Connectivity will increasingly support fleet tracking, maintenance scheduling and theft recovery.
08Safety engineering faces continued scrutiny
High confidenceThe CPSC's 2025 OHV report identified 53 reported UTV-related fatalities for 2020–2022 and cited overturns and collisions as common fatality hazards across OHVs. The report also estimated 578,700 emergency-department-treated OHV injuries during 2020–2024.[8]
Forecast 2027: Safety systems will receive greater product and regulatory attention in 2027, including improved occupant restraints, rollover protection, visibility, speed management and training. Safety-related recalls and compliance costs will remain material risks for manufacturers.
09Public-land access remains a demand constraint
High confidenceThe Bureau of Land Management says OHV use is subject to state rules, route designations, resource protections and public-safety requirements. In California's West Mojave planning area, routes in specified critical habitats were closed to OHV recreation beginning March 24, 2026.[20]
Forecast 2027: In 2027, demand for recreational UTVs will remain sensitive to trail access, environmental litigation and local permitting. Manufacturers and dealer groups will likely increase investment in organized riding areas, route advocacy and responsible-use programs.
10Regulatory management becomes more politically variable
Medium confidenceBLM interim guidance issued in July 2026 kept existing OHV regulations and route designations in force while directing rulemaking related to federal-land access. The guidance reflects a policy shift toward reviewing whether existing restrictions impose unnecessary burdens while retaining environmental and safety controls.[20]
Forecast 2027: Federal and state OHV policy will remain uneven in 2027, creating different market conditions by region. Greater access could support recreational sales in some western markets, while habitat, noise and safety rules will continue to limit use in others.
04 Statistics
Market Intelligence
Market intelligence quantifies the unit and value path: $9.6B in 2025, $10.2B in 2026, and revenue projected to $16.1B by 2035.
Market size, volume and shipments in the utv industry
- USD 6.66 billion was the global utility terrain vehicle market value in 2025; the study reports gasoline, diesel and battery-electric UTVs within the market definition.[1]
- 565,000 North American side-by-side vehicles were estimated sold at retail in 2024, within Polaris’s broader off-road vehicle industry definition that includes UTV-type side-by-sides.[2]
- USD 9.6 billion and 575,141 units represented the global UTV market in 2025; the study defines UTVs as utility terrain vehicles and reports an average selling price of USD 16,800.[3]
- USD 7.2 billion was the global utility terrain vehicle market value in 2024; the category covers UTVs by displacement, propulsion, application and region.[4]
Forecast growth and shipments in the utv industry
- Global UTV unit demand is forecast to increase from 595,271 units in 2026 to 803,357 units in 2035, equivalent to approximately 3.39% annual growth.[3]
- The global utility terrain vehicle market is forecast to grow at a 5.7% CAGR from 2025 through 2030, reaching USD 9.8 billion in 2030.[4]
- Global UTV revenue is projected to rise from USD 10.2 billion in 2026 to USD 16.1 billion in 2035, representing approximately 5.3% compound annual growth.[3]
05 Statistics
Product & Standards
Product and standards section connects engineering constraints to compliance inputs, including ANSI/OPEI B71.9-2022 width limits and US Army Corps cargo tie-down rules.
Standards, grades and specs for utv
- 80 inches (2,030 mm) is the maximum overall width for multipurpose off-highway utility vehicles under ANSI/OPEI B71.9-2022, the U.S. industry standard published in 2022.[5]
- Loads exceeding 50 lb (22.7 kg) must be securely strapped to cargo tie-downs under the U.S. Army Corps of Engineers’ EM 385-1-1, effective March 15, 2024.[6]
- 4,000 lb (1,814 kg) is the maximum gross vehicle weight rating for multipurpose off-highway utility vehicles under ANSI/OPEI B71.9-2022, the U.S. industry standard published in 2022.[5]
06 Statistics
People & Workforce
People and workforce data covers U.S. transportation equipment manufacturing employment, wages used in UTV production under NAICS 336999, and injury and illness rates.
Employment and hiring in the utv industry
- 1.77 million employees worked in U.S. transportation equipment manufacturing in October 2026; UTV manufacturing is included within NAICS 336999, All Other Transportation Equipment Manufacturing.[7]
- 1.18 million production and nonsupervisory employees worked in U.S. transportation equipment manufacturing in October 2026, including the UTV-manufacturing classification NAICS 336999.[7]
- 3.0% was the unemployment rate in October 2026 for people previously employed in U.S. transportation equipment manufacturing, which includes UTV manufacturing under NAICS 336999.[7]
Wages and labour costs in the utv industry
- $26.32 was the 2025 mean hourly wage for U.S. team assemblers in transportation equipment manufacturing, an occupation used in UTV production under NAICS 336999.[7]
- $45.06 was the average hourly wage in October 2026 for U.S. transportation equipment manufacturing employees, including workers in UTV manufacturing under NAICS 336999.[7]
- $39.28 was the average hourly wage for U.S. production and nonsupervisory transportation-equipment-manufacturing employees in October 2026, including the UTV-manufacturing classification NAICS 336999.[7]
Workplace safety in the utv industry
- 2.3 recordable occupational injury and illness cases occurred per 100 full-time workers in U.S. all-other transportation-equipment manufacturing in 2024; NAICS 336999 includes all-terrain-vehicle manufacturing.[7]
- 0.8 cases involving days away from work occurred per 100 full-time workers in U.S. NAICS 336999 transportation-equipment manufacturing in 2024, including ATV/UTV manufacturing.[7]
- 1.5 cases involving days away from work, job restriction or transfer occurred per 100 full-time workers in U.S. NAICS 336999 transportation-equipment manufacturing in 2024, including ATV/UTV manufacturing.[7]
07 Statistics
Regulation & Risk
Regulation and risk adds concrete incident signals through CPSC-related reporting and recall volumes, including overheating, engine-start fires, and brake-line hazards.
Recalls and safety notices for utv
- 24,700 Huffy Torex UTV ride-on toys were recalled in the United States on April 24, 2025, for overheating and fire hazards caused by improper wiring.[8]
- Three engine-start fires were reported for the recalled Kawasaki Mule PRO 1000 utility vehicles in the United States by July 25, 2024.[8]
- 19,100 Kawasaki Mule PRO 1000 utility vehicles were recalled in the United States on July 25, 2024, for an engine-start fire hazard.[8]
- 40 incident reports, including 12 involving brake-line impacts, were reported for the recalled Intimidator and Mahindra UTVs in the United States by April 11, 2024.[8]
- 19,075 Intimidator and Mahindra UTVs were recalled in the United States on April 11, 2024, for a universal-joint brake-line crash hazard.[8]
Key questions about the Utv Industry
What was the global UTV market size in 2025?
How fast is the UTV market expected to grow through 2035?
Which companies lead the utv industry?
What technology shifts are showing up in UTV demand?
How is the market split between utility/work and sport UTVs?
What regulatory items affect UTV and related off-highway product compliance in the U.S.?
Cite This Report
This report is designed to be cited. We maintain stable URLs and versioned verification dates. Copy the format appropriate for your publication below.
Marcus Engström. (2026, February 13). Utv Industry Statistics. Gitnux. https://gitnux.org/utv-industry-statistics
Marcus Engström. "Utv Industry Statistics." Gitnux, 13 Feb 2026, https://gitnux.org/utv-industry-statistics.
Marcus Engström. 2026. "Utv Industry Statistics." Gitnux. https://gitnux.org/utv-industry-statistics.
Sources & references
20 sources cited across this report
mordorintelligence.com
sec.gov
gminsights.com
grandviewresearch.com
blog.ansi.org
publications.usace.army.mil
bls.gov
cpsc.gov
fortunebusinessinsights.com
polaris.com
ir.brp.com
growthmarketreports.com
global.yamaha-motor.com
kawasaki.com
hisunmotors.com
powersportsbusiness.com
powersys.com
powersports.honda.com
blm.gov