The trucking industry is an integral part of the US economy, responsible for transporting goods across the country. It is also a major employer, with over 3.5 million truck drivers and other workers employed in the industry.
With such a large and important industry, it is important to understand the latest statistics and trends in the US trucking industry. In this blog post, we will take a look at the latest US trucking industry statistics and explore the implications for the industry and the economy.
US Trucking Industry: The Most Important Statistics
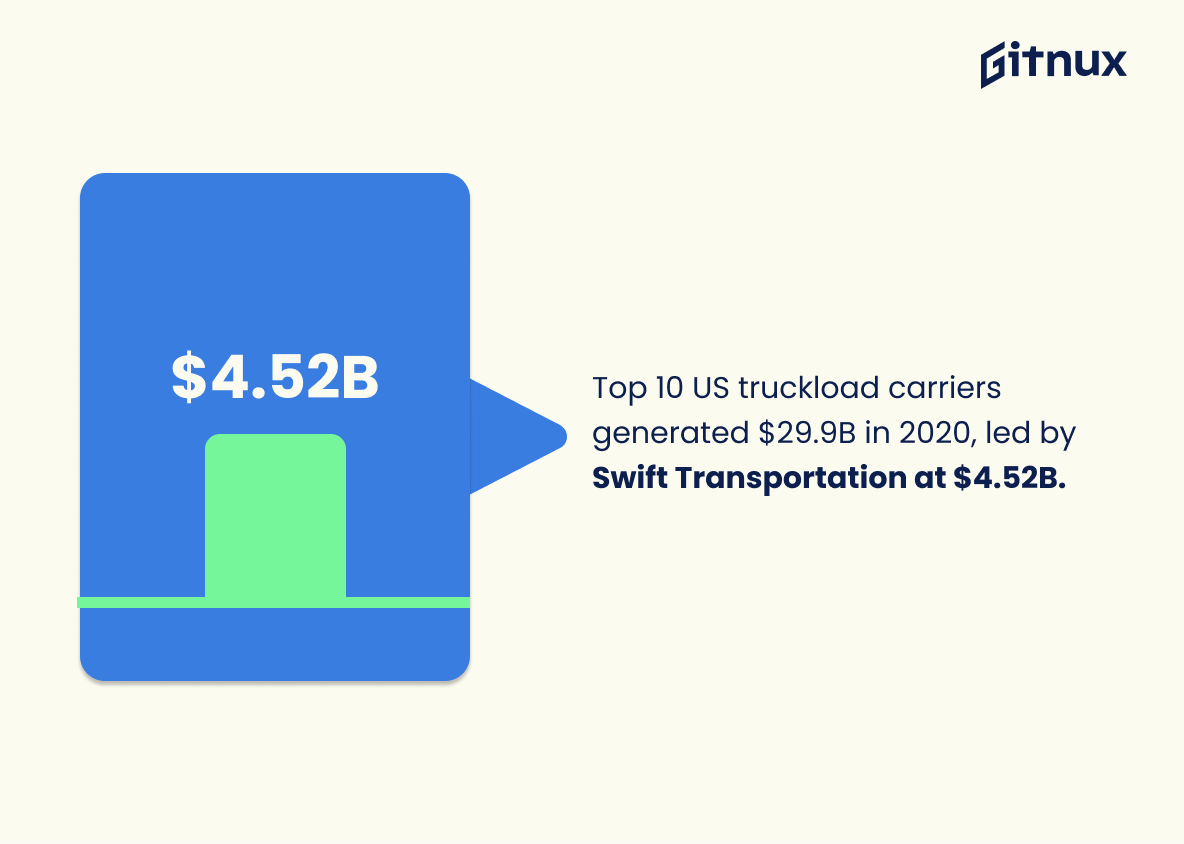
In 2020, the top 10 truckload carriers in the US generated a combined revenue of $29.9 billion, with Swift Transportation leading the pack at $4.52 billion.
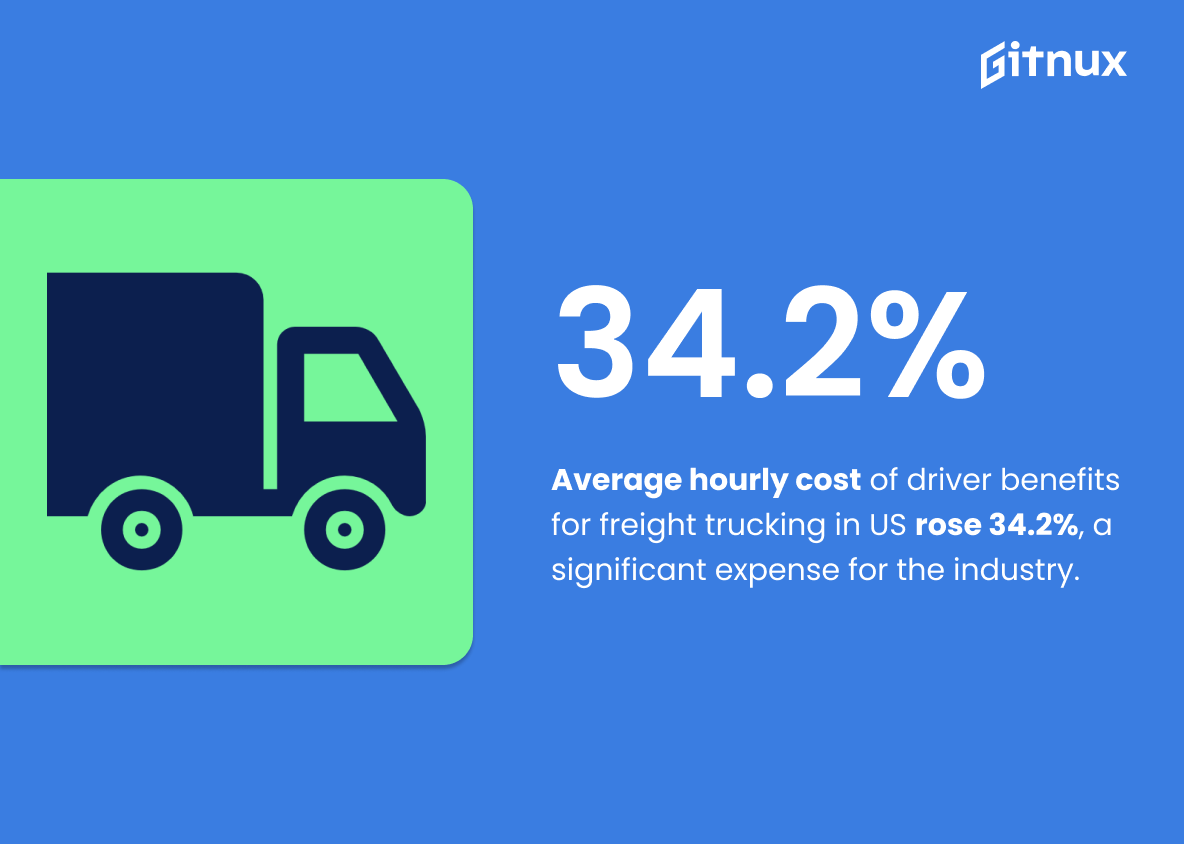
The average hourly cost of driver benefits for freight trucking in the United States increased from $3.89 in 2006 to $5.19 in 2020, representing a significant expense for the industry.
US Trucking Industry Statistics Overview
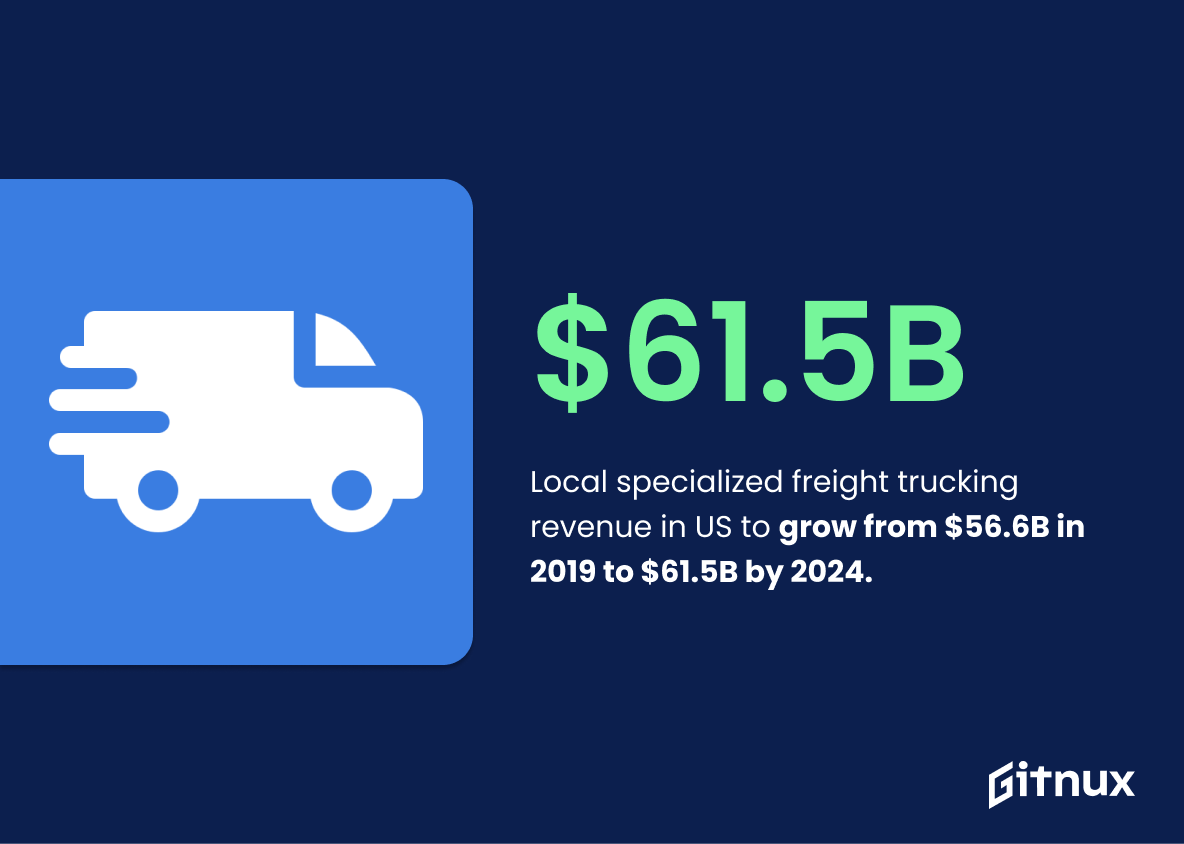
The revenue of local specialized freight trucking in the US increased from $56.6 billion in 2019 to an estimated $61.5 billion by 2024.
This shows the growth of the specialized freight trucking industry in the US, which is driven by increased demand for transportation services in sectors such as construction, manufacturing, and energy. It is indicative of a healthy trucking industry, which is essential for the US economy.
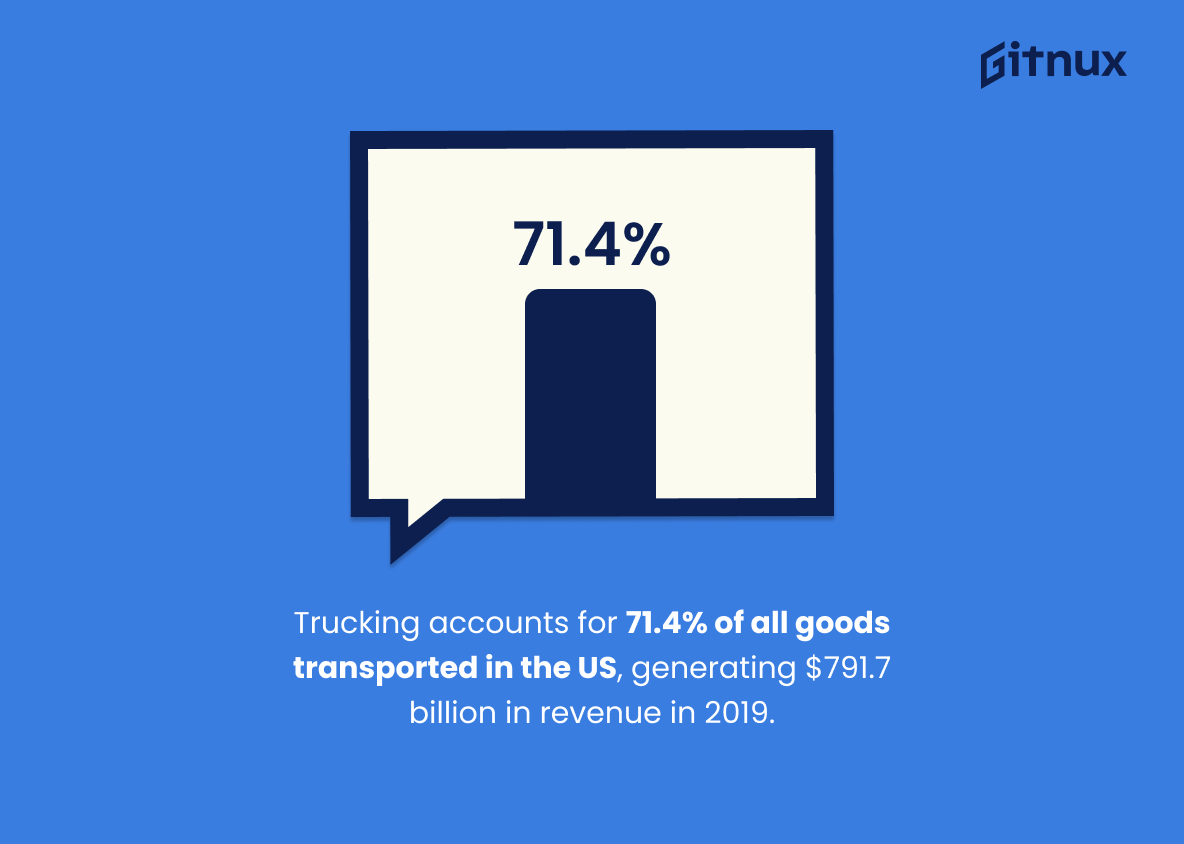
Trucking accounts for 71.4% of all goods transported in the US, generating $791.7 billion in revenue in 2019.
It highlights the significance of the trucking industry to the US economy, as well as the challenges it faces, such as driver shortages and rising fuel costs.
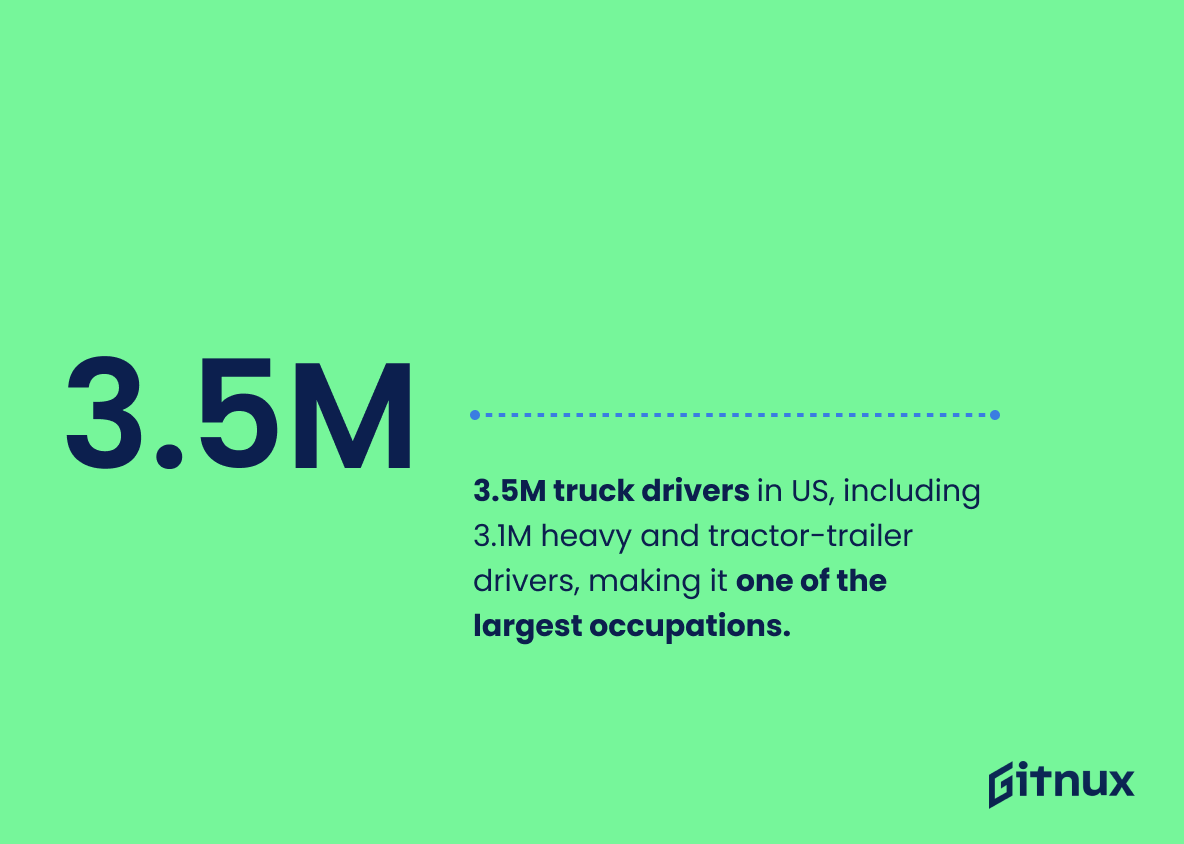
There are 3.5 million truck drivers in the US, with 3.1 million being heavy and tractor-trailer truck drivers, making it one of the largest occupations in the country.
As of December 2021, the truck transportation industry employed around 1.5% of the total nonfarm employment in the US, with 1.42 million people employed in the long-distance truck transportation segment and 432,000 people employed in the specialized freight trucking segment.
In 2020, the top 10 truckload carriers in the US generated a combined revenue of $29.9 billion, with Swift Transportation leading the pack at $4.52 billion.
FedEx Freight was the leading LTL carrier in the United States in 2020, with revenue of approximately 7.86 billion U.S. dollars.
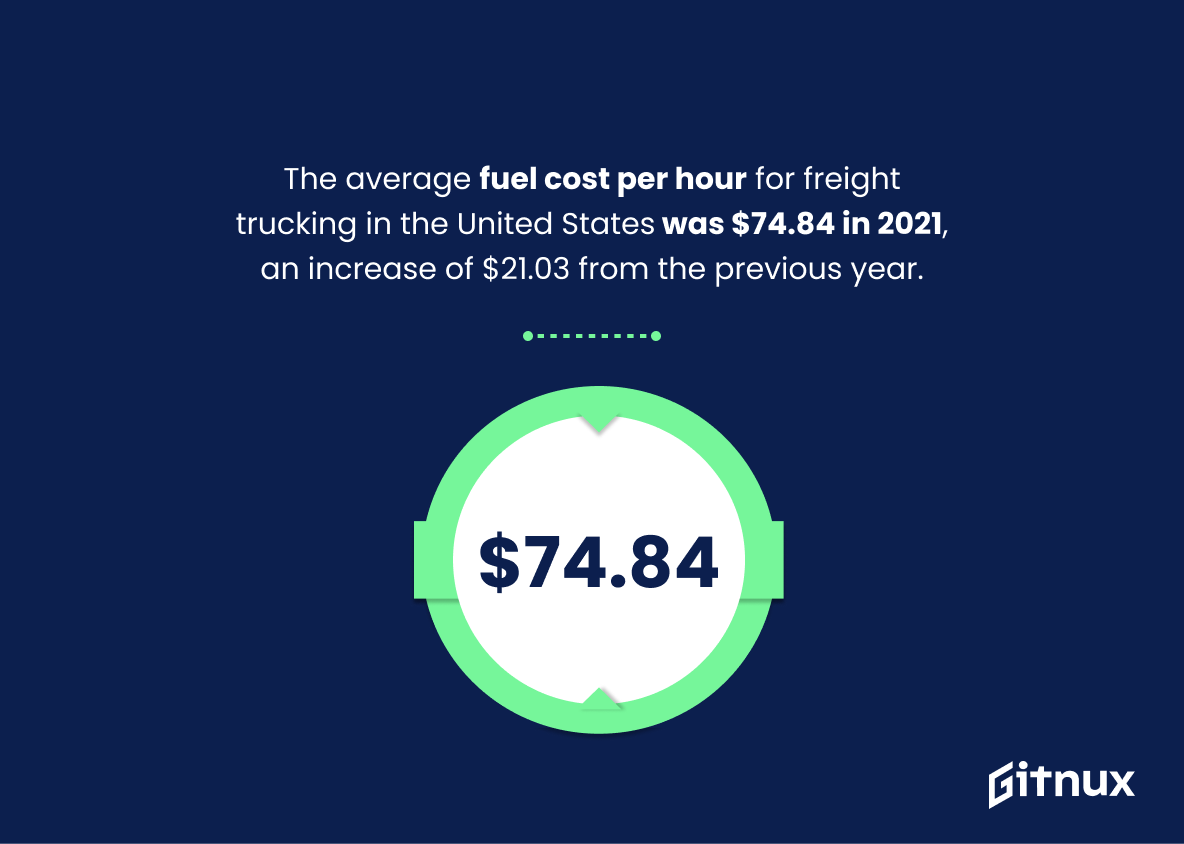
The average fuel cost per hour for freight trucking in the United States was $74.84 in 2021, an increase of $21.03 from the previous year.
Fuel costs are a major expense and fluctuations in oil prices can have a significant impact on their profitability.
The average hourly cost of driver benefits for freight trucking in the United States increased from $3.89 in 2006 to $5.19 in 2020, representing a significant expense for the industry.
Thus, the cost of driver benefits has increased significantly over the past 14 years, which has a direct impact on the industry’s bottom line. This has likely led to higher prices for freight trucking services, which could have a negative effect on the industry’s competitiveness.
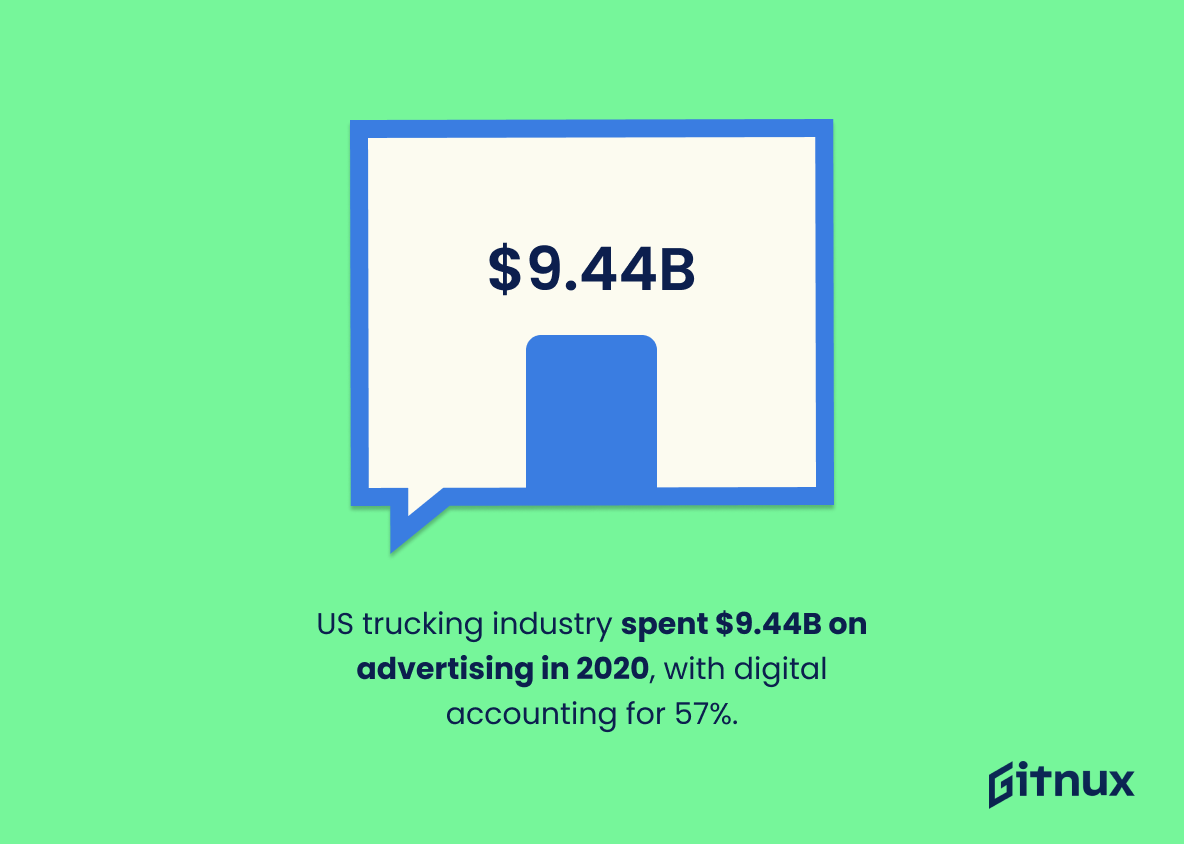
The trucking industry in the US spent $9.44 billion on advertising in 2020, with digital advertising accounting for 57% of total ad spend.
The trucking and courier services industry spent approximately 3.67 billion U.S. dollars on advertising in the United States in 2019, with the majority of spending on local advertising and the leading advertisers being FedEx and UPS.
Thus, the trucking and courier services industry must be investing in advertising in order to remain competitive.
Conclusion
The US trucking industry is an important part of the economy, and its statistics show that it is growing and changing.
The industry is facing challenges such as driver shortages, rising fuel costs, and increasing regulations, but it is also seeing growth in areas such as freight volume and technology. The industry is an important part of the US economy, and its future looks bright.
References
1 – https://www.statista.com/statistics/294884/revenue-of-local-specialized-freight-trucking-in-the-us/
2 – https://www.statista.com/statistics/922817/trucking-industry-united-states-total-revenue/
3 – https://www.statista.com/statistics/537834/number-of-truck-drivers-in-the-us-by-type/
4 – https://www.statista.com/statistics/940018/employment-in-us-truck-transportation-by-segment/
5 – https://www.statista.com/statistics/1126365/leading-us-truckload-carriers-revenue/
6 – https://www.statista.com/statistics/255085/leading-us-less-than-truckload-carriers-based-on-revenue/
7 – https://www.statista.com/statistics/916142/freight-trucking-fuel-costs-per-hour-us/
8 – https://www.statista.com/statistics/916149/freight-trucking-driver-benefits-costs-per-hour-us/
9 – https://www.statista.com/statistics/470561/trucking-industry-ad-spend-usa/
10 – https://www.statista.com/statistics/470557/trucking-and-courier-services-industry-ad-spend-usa/
