

Stanford University is one of the most prestigious universities in the world, and its admission process is highly competitive. To gain a better understanding of what it takes to get accepted into Stanford, let’s take a look at some key statistics about their admissions requirements and student body.
The statistic of Stanford University’s overall acceptance rate of 4.3% is a crucial piece of information for anyone considering applying to the university. It provides a clear indication of the level of competition for admission and the likelihood of being accepted. This statistic is a valuable insight into the admissions process and can help prospective students make an informed decision about their application.
The middle 50% SAT range for admitted Stanford students is between 1460-1560.
This statistic is a key indicator of the academic caliber of Stanford’s admitted students. It reveals that the majority of admitted students have achieved a score within the range of 1460-1560 on the SAT, indicating that they are among the top academic performers in the nation. This statistic is a testament to the high standards of excellence that Stanford upholds in its admissions process.
Stanford Admission Statistics Overview
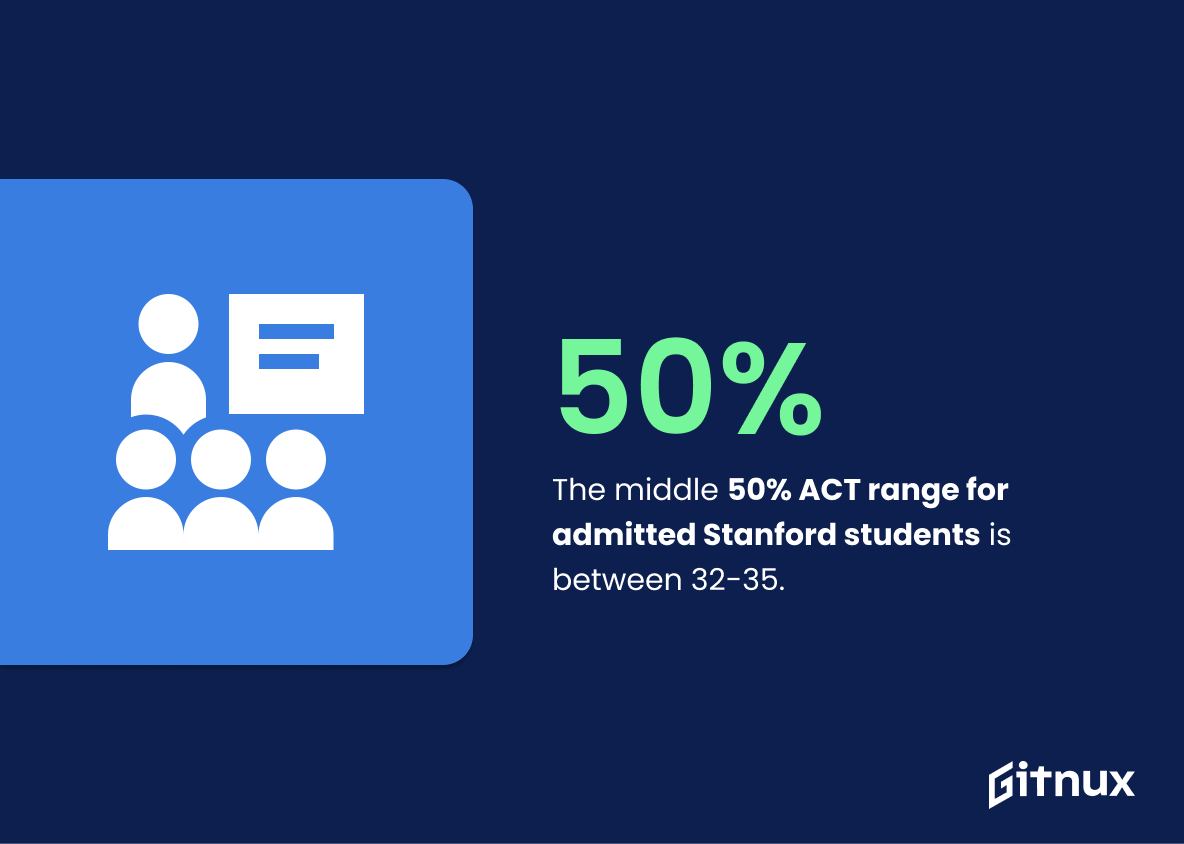
The middle 50% ACT range for admitted Stanford students is between 32-35.
This statistic is a key indicator of the level of academic excellence expected of Stanford applicants. It provides a clear indication of the range of scores that the majority of admitted students achieved on the ACT, demonstrating the high standards of the university. It also serves as a benchmark for prospective students to gauge their own performance against, helping them to determine their chances of admission.
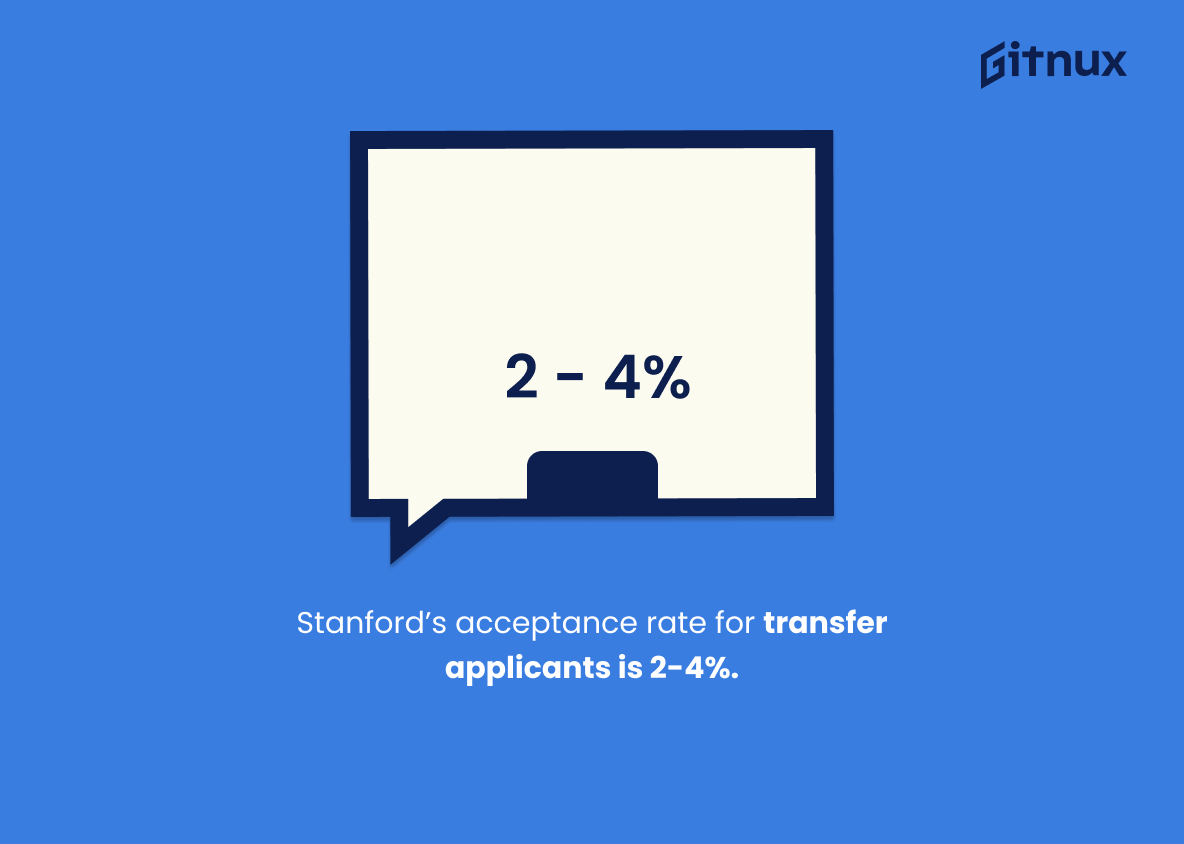
Stanford’s acceptance rate for transfer applicants is 2-4%.
The statistic of Stanford’s acceptance rate for transfer applicants being 2-4% is a crucial piece of information for anyone considering applying to the university. It serves as a reminder that the competition for admission is fierce and that applicants should be prepared to put forth their best effort in order to stand out from the crowd.
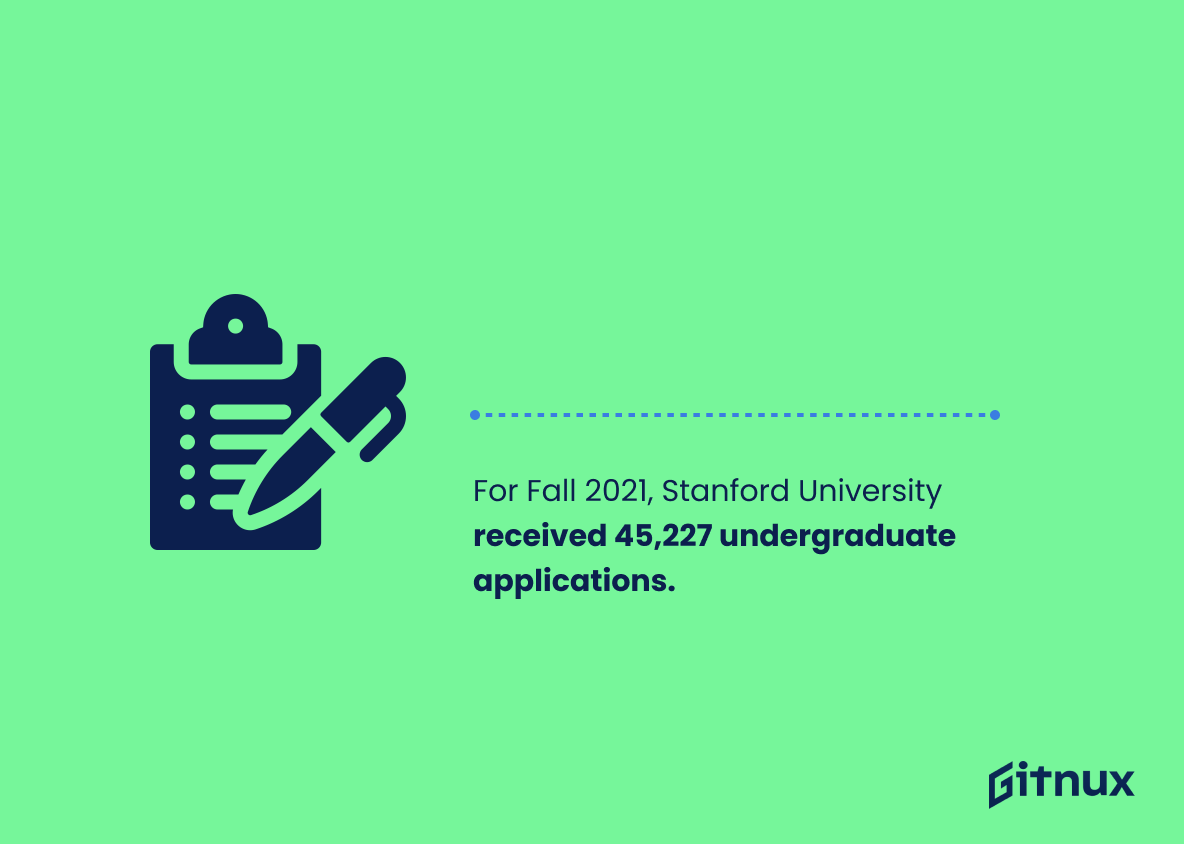
For Fall 2021, Stanford University received 45,227 undergraduate applications.
This statistic is a testament to the immense popularity of Stanford University, with a staggering 45,227 undergraduate applications for Fall 2021. It speaks to the university’s reputation as a world-renowned institution of higher learning, and its ability to attract a large number of applicants from around the world. This statistic is a clear indication of the university’s success in providing a quality education and a desirable college experience.
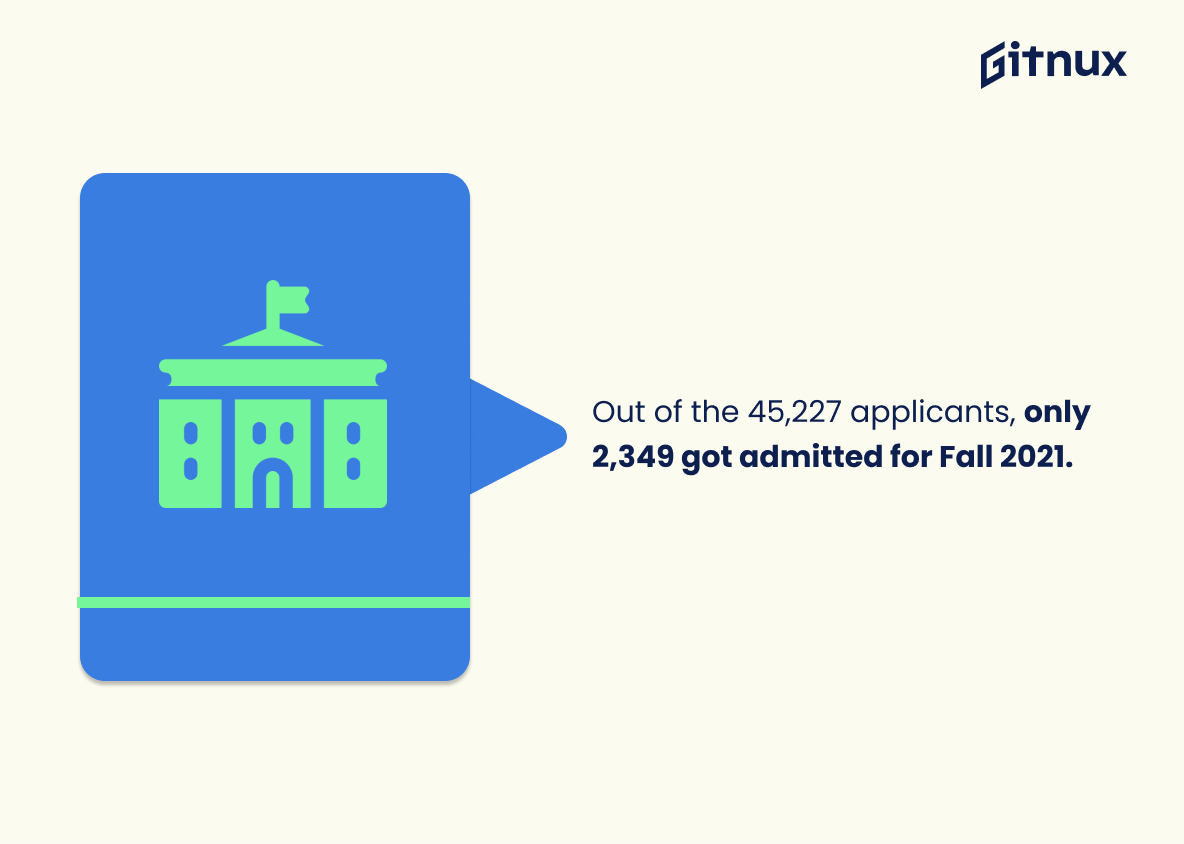
Out of the 45,227 applicants, only 2,349 got admitted for Fall 2021.
This statistic paints a vivid picture of the competitive nature of Stanford admissions. With only 5.2% of applicants being accepted, it is clear that the university is highly selective and that the admissions process is rigorous. This statistic serves as a reminder that the admissions process is not easy and that students should strive to make their applications stand out.
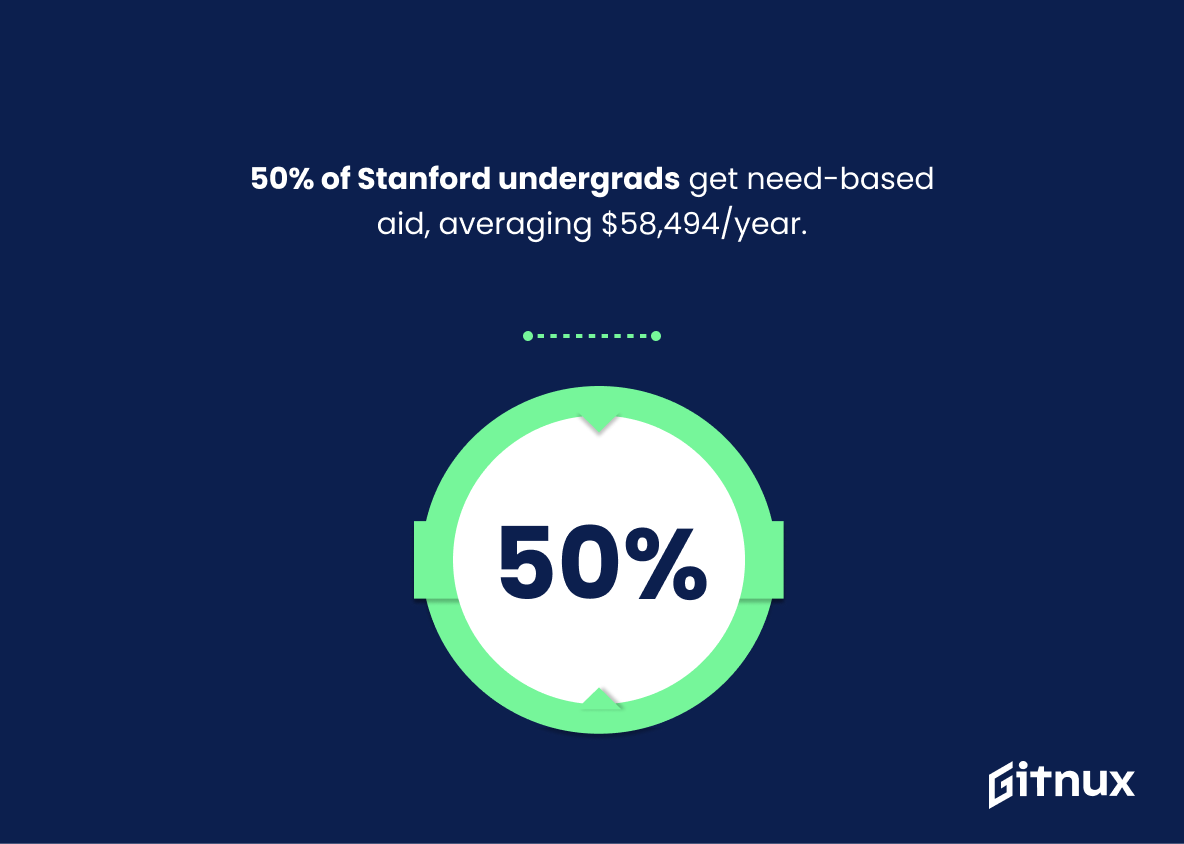
Around 50% of Stanford undergraduate students receive need-based financial aid, with an average awarded amount of around $58,494 per student per year.
This statistic is a testament to Stanford’s commitment to providing access to higher education for students from all backgrounds. It demonstrates that Stanford is dedicated to making sure that financial barriers do not prevent students from achieving their educational goals. This statistic is also important in highlighting the fact that Stanford is a place where students from all walks of life can come together and learn from each other.
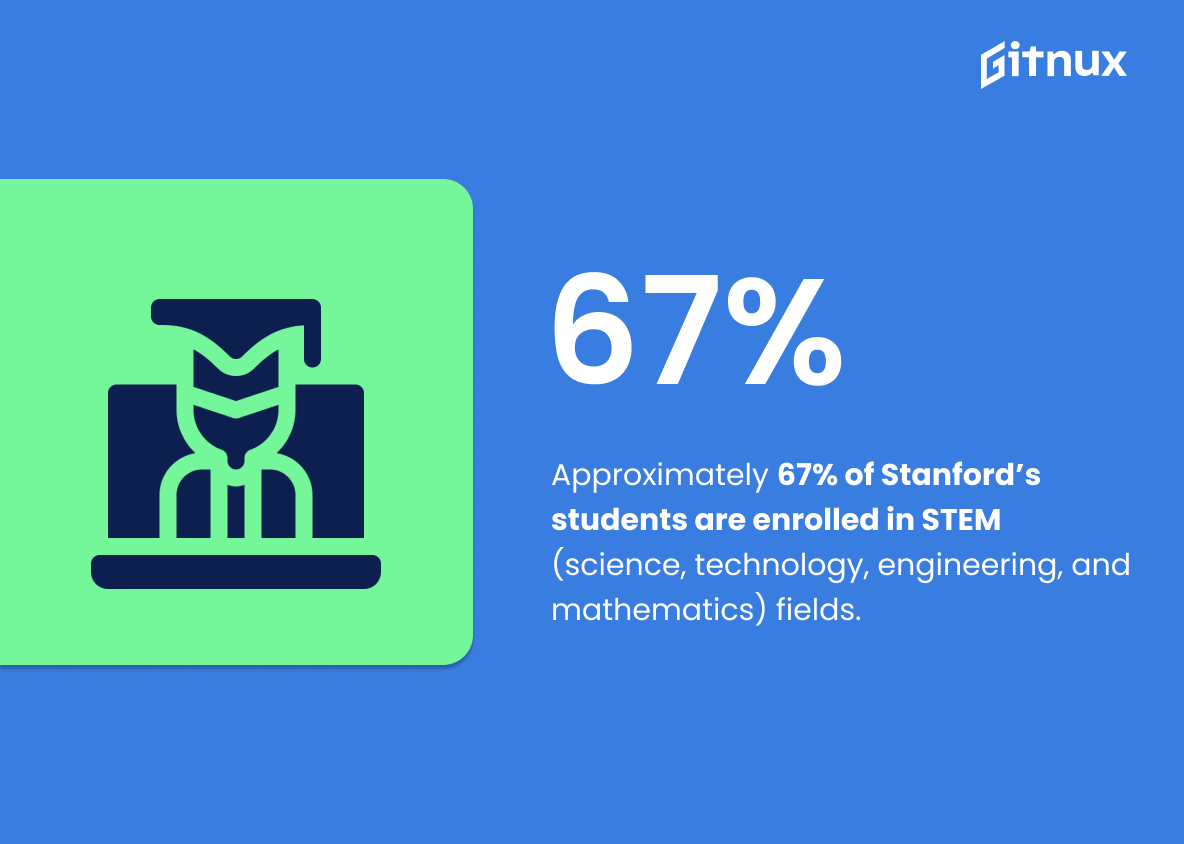
Approximately 67% of Stanford’s students are enrolled in STEM (science, technology, engineering, and mathematics) fields.
This statistic is indicative of the fact that Stanford is a leader in STEM education, with a majority of its students enrolled in these fields. It speaks to the university’s commitment to providing students with the best possible education in these areas, and the opportunities available to those who choose to pursue a STEM degree at Stanford. This statistic is also important in understanding the overall academic landscape of the university, and the types of students that are attracted to the school.
Stanford admits international students from around 66 countries each year, accounting for about 11% of the undergraduate student population.
This statistic is a testament to Stanford’s commitment to fostering a diverse and inclusive environment. By admitting students from 66 countries, Stanford is creating a campus community that is enriched by a variety of perspectives and experiences. This helps to create an atmosphere of learning and growth, where students can learn from each other and gain a better understanding of the world.
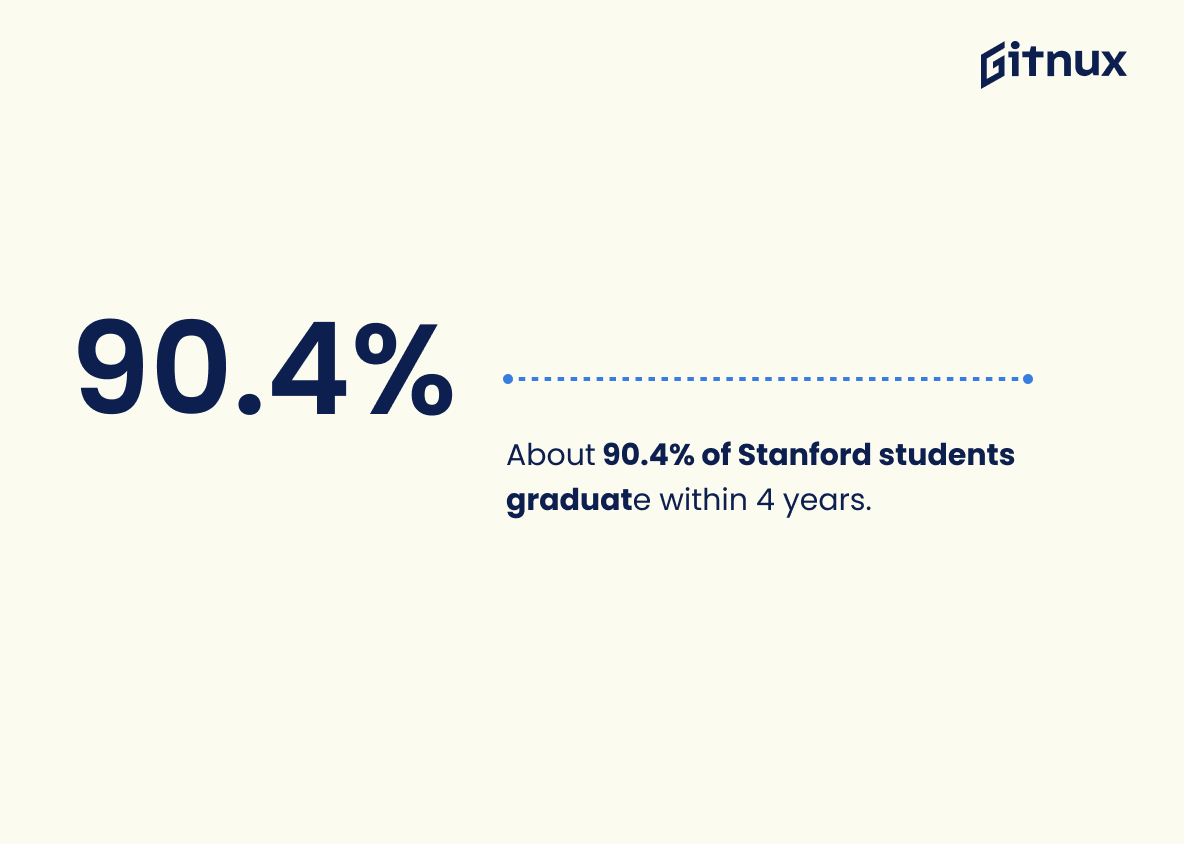
About 90.4% of Stanford students graduate within 4 years.
This statistic is a testament to the quality of education that Stanford provides, as it shows that the vast majority of students are able to complete their degree in a timely manner. It also speaks to the dedication of the faculty and staff, who are committed to helping students succeed. This statistic is an important indicator of the success of Stanford’s admissions process, as it shows that the university is able to select students who are capable of completing their degree in a timely manner.
Stanford University has around 100 undergraduate majors and minors.
The fact that Stanford University offers around 100 undergraduate majors and minors is significant in the context of Stanford Admission Statistics because it speaks to the university’s commitment to providing a wide range of educational opportunities for its students. With such a diverse selection of majors and minors, students can explore their interests and find the perfect program to pursue their academic goals.
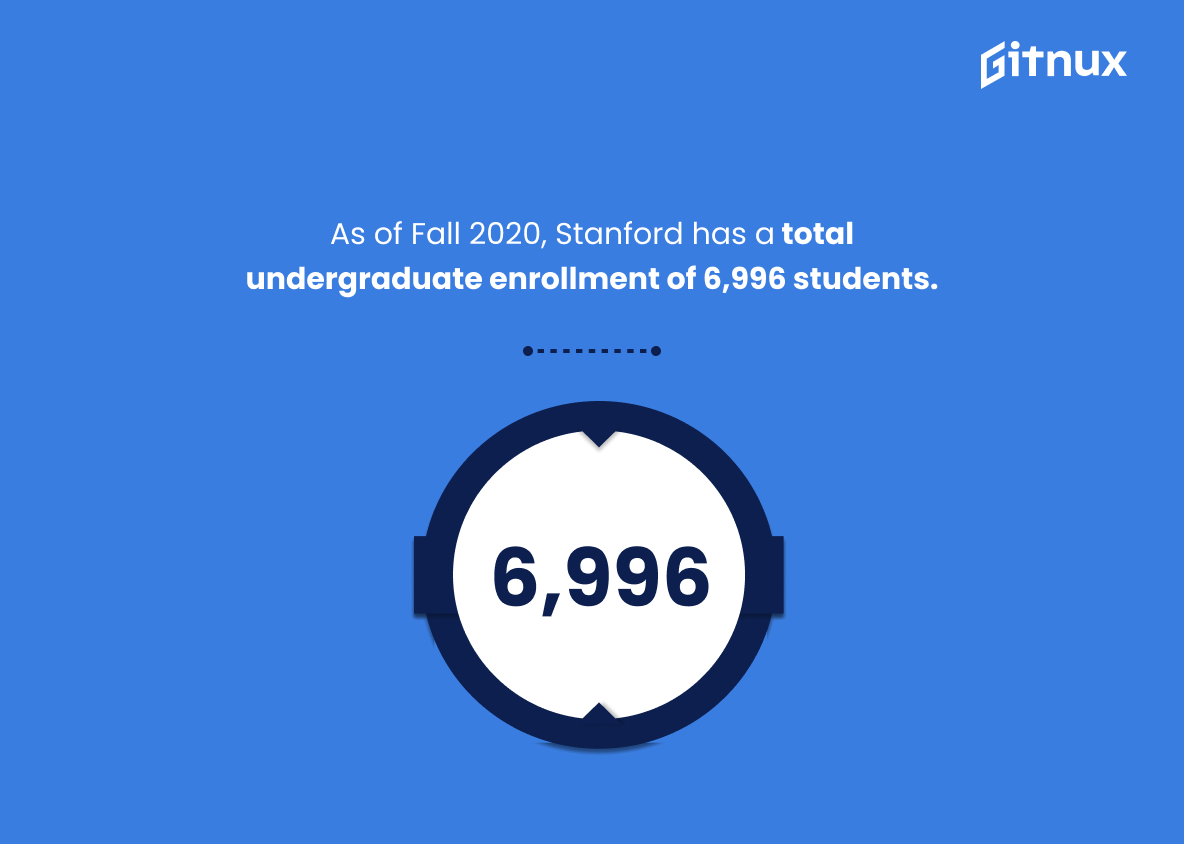
As of Fall 2020, Stanford has a total undergraduate enrollment of 6,996 students.
This statistic is a testament to the sheer number of students vying for a spot at Stanford. It speaks to the university’s immense popularity and the level of competition for admission. It also serves as a reminder of the importance of standing out in the application process in order to be accepted.
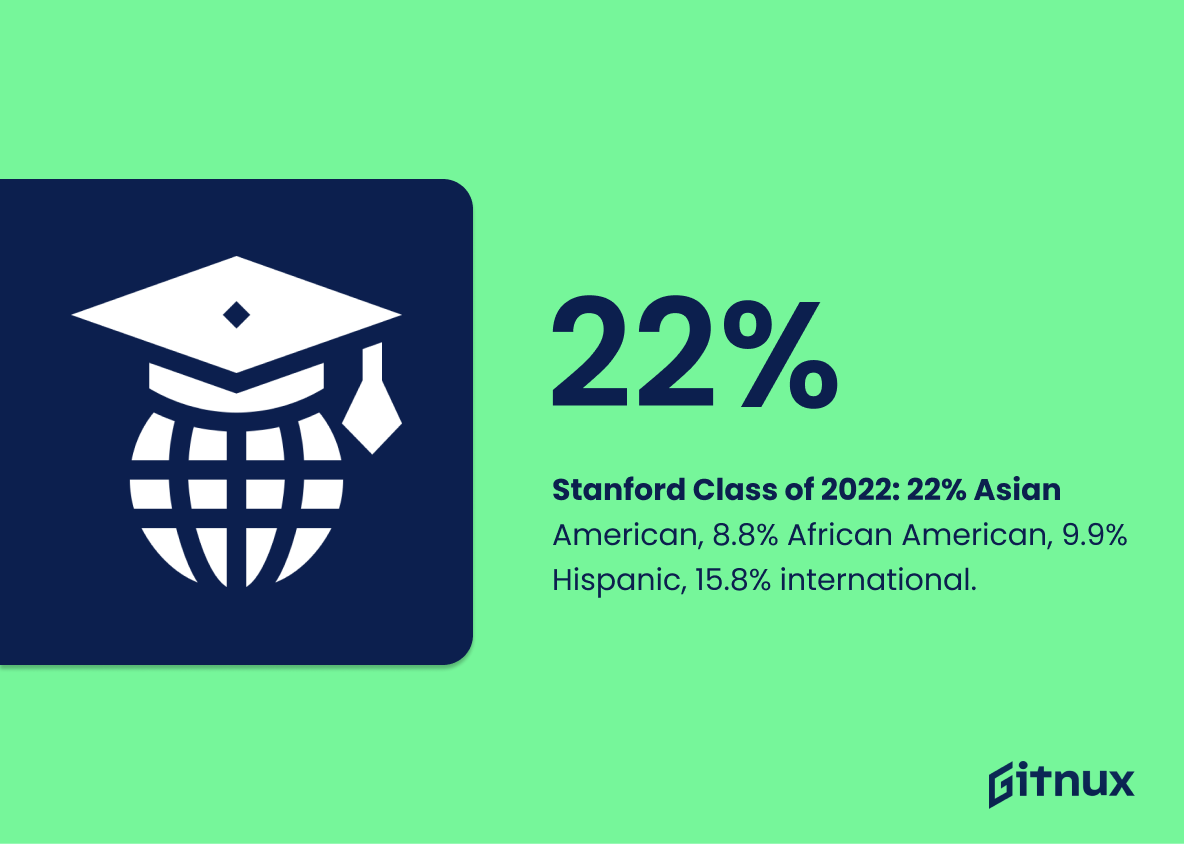
Approximately 22% of Stanford’s admitted students for the class of 2022 identified as Asian American, 8.8% African American, 9.9% Hispanic, and 15.8% international.
This statistic is a powerful indicator of the diversity of the incoming class of 2022 at Stanford. It shows that the university is committed to creating an inclusive and welcoming environment for students of all backgrounds, from Asian American to African American to Hispanic to international. This is an important step in creating a campus culture that celebrates and embraces diversity, and it is a testament to Stanford’s commitment to creating a safe and equitable learning environment for all.
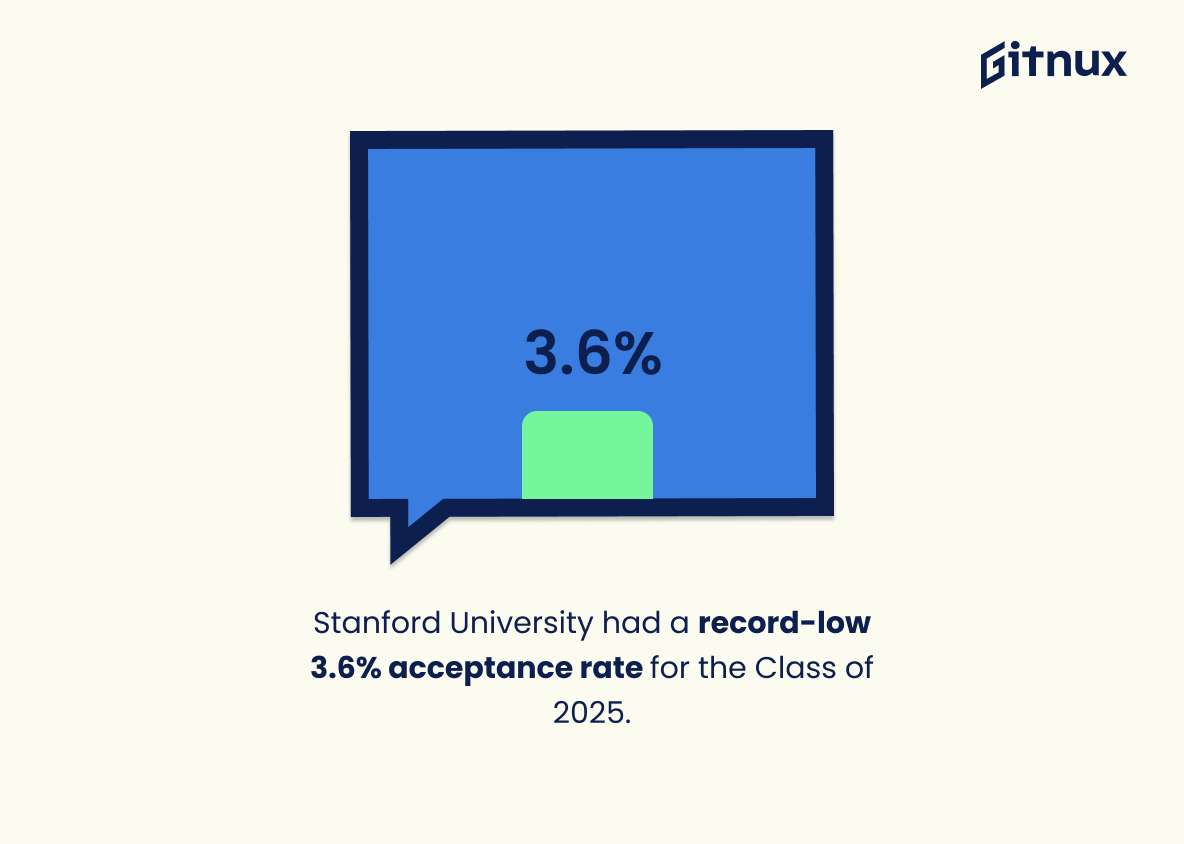
Stanford University had a record-low 3.6% acceptance rate for the Class of 2025.
The statistic that Stanford University had a record-low 3.6% acceptance rate for the Class of 2025 is a testament to the university’s rigorous admissions process and the high caliber of applicants vying for a spot in the prestigious institution. It is a clear indication of the immense competition for a place at Stanford, and serves as a reminder of the hard work and dedication required to be accepted into the university.
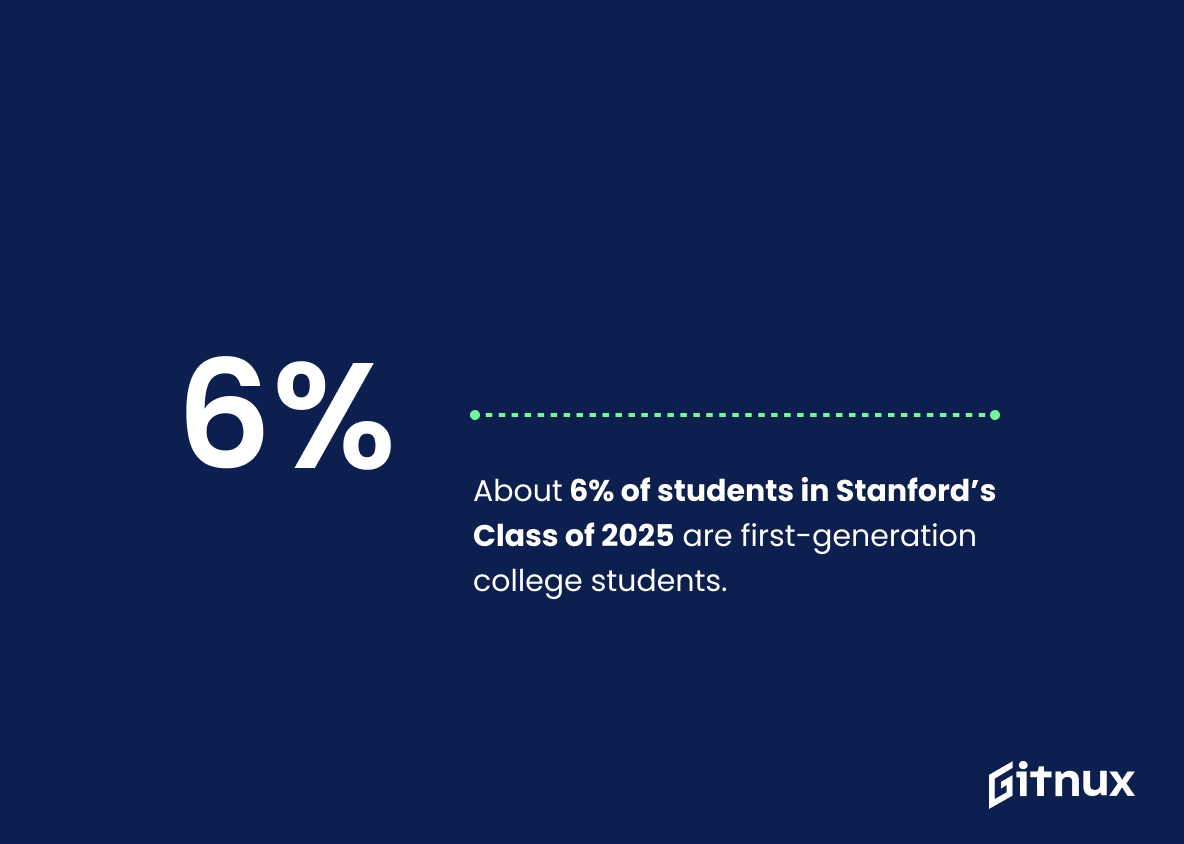
About 6% of students in Stanford’s Class of 2025 are first-generation college students.
This statistic is a testament to Stanford’s commitment to providing access to higher education for students from all backgrounds. It demonstrates that the university is actively working to create a diverse and inclusive student body, and that it is making progress in its efforts to ensure that first-generation college students have the opportunity to pursue their educational goals.
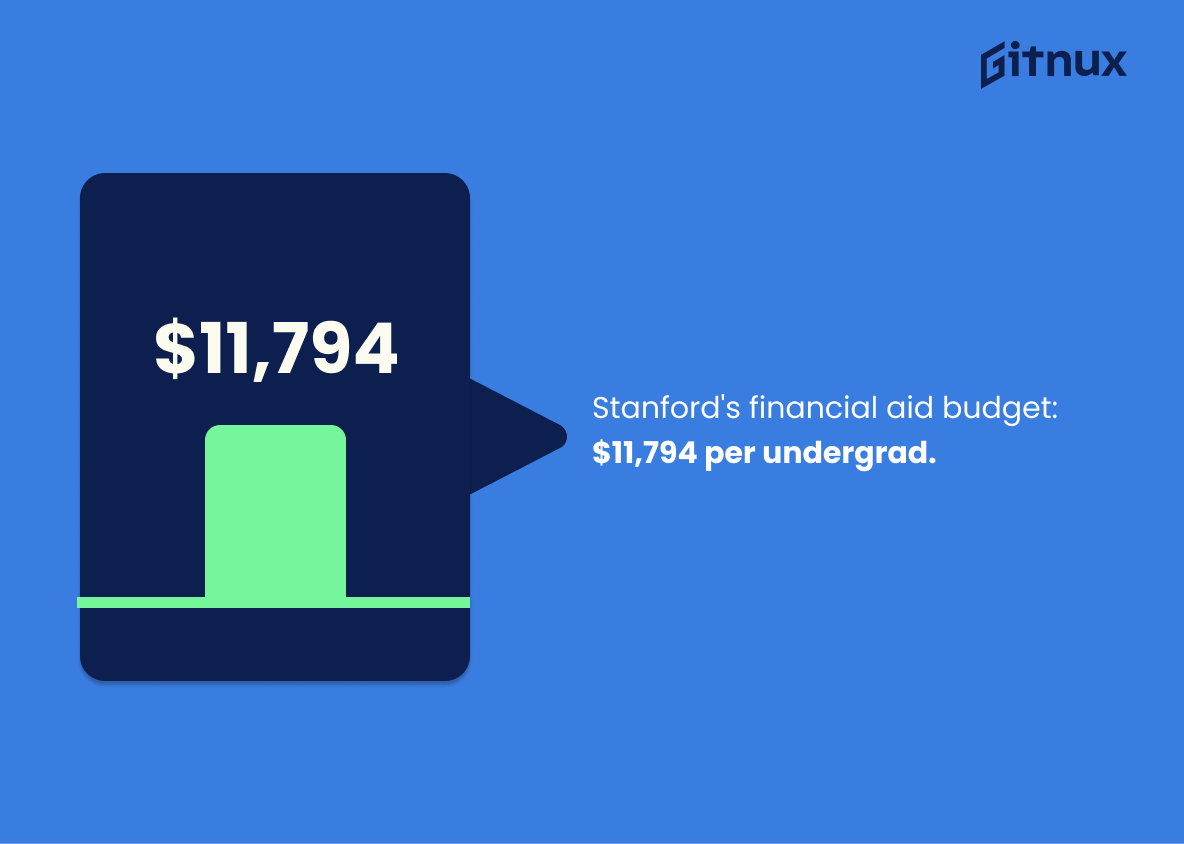
Stanford’s Supplementary Education Expenses (SEE) budget for providing financial aid resources to meet students’ needs is $11,794 per undergraduate student.
The fact that Stanford’s Supplementary Education Expenses (SEE) budget is $11,794 per undergraduate student is a testament to the university’s commitment to providing financial aid resources to meet students’ needs. This generous budget ensures that students from all backgrounds have access to the same quality education, regardless of their financial situation. This statistic is an important part of the overall picture of Stanford’s admission statistics, as it demonstrates the university’s dedication to making its education accessible to all.
Conclusion
Stanford University is one of the most prestigious universities in the world, and its admission statistics reflect this. With an overall acceptance rate of 4.3%, Stanford has a highly selective admissions process that requires applicants to have strong academic credentials such as SAT scores between 1460-1560 or ACT scores between 32-35, and rank in the top 5% of their high school class. The Restricted Early Action program offers slightly higher chances for admission with an acceptance rate of 10.3%. Transfer students also have a chance at being admitted with an acceptance rate ranging from 2-4%.
In addition to having rigorous academic requirements, Stanford’s undergraduate student population reflects diversity across many different backgrounds including race/ethnicity, international status, first generation college students and more. Approximately 11% are international students coming from 66 countries around the world while 22%, 8.8%, 9.9% identify as Asian American African American or Hispanic respectively; 6% are first generation college students; 67 % study STEM fields; 50 % receive need based financial aid averaging $58 494 per year; 97 % retain after freshman year and 90 4 % graduate within four years . Furthermore , there are 100 majors available for undergraduates who make up 6996 total enrolled members .
Overall , it is clear that gaining admittance into Stanford University requires hard work , dedication ,and excellent grades but can be achieved by those willing to put forth effort towards achieving their goals .
References
0. – https://www.exploredegrees.stanford.edu
1. – https://www.stanfordguide.org
2. – https://www.prepscholar.com
3. – https://www.admission.stanford.edu
4. – https://www.parchment.com
5. – https://www.facts.stanford.edu
6. – https://www.stanforddaily.com
7. – https://www.fingate.stanford.edu
