
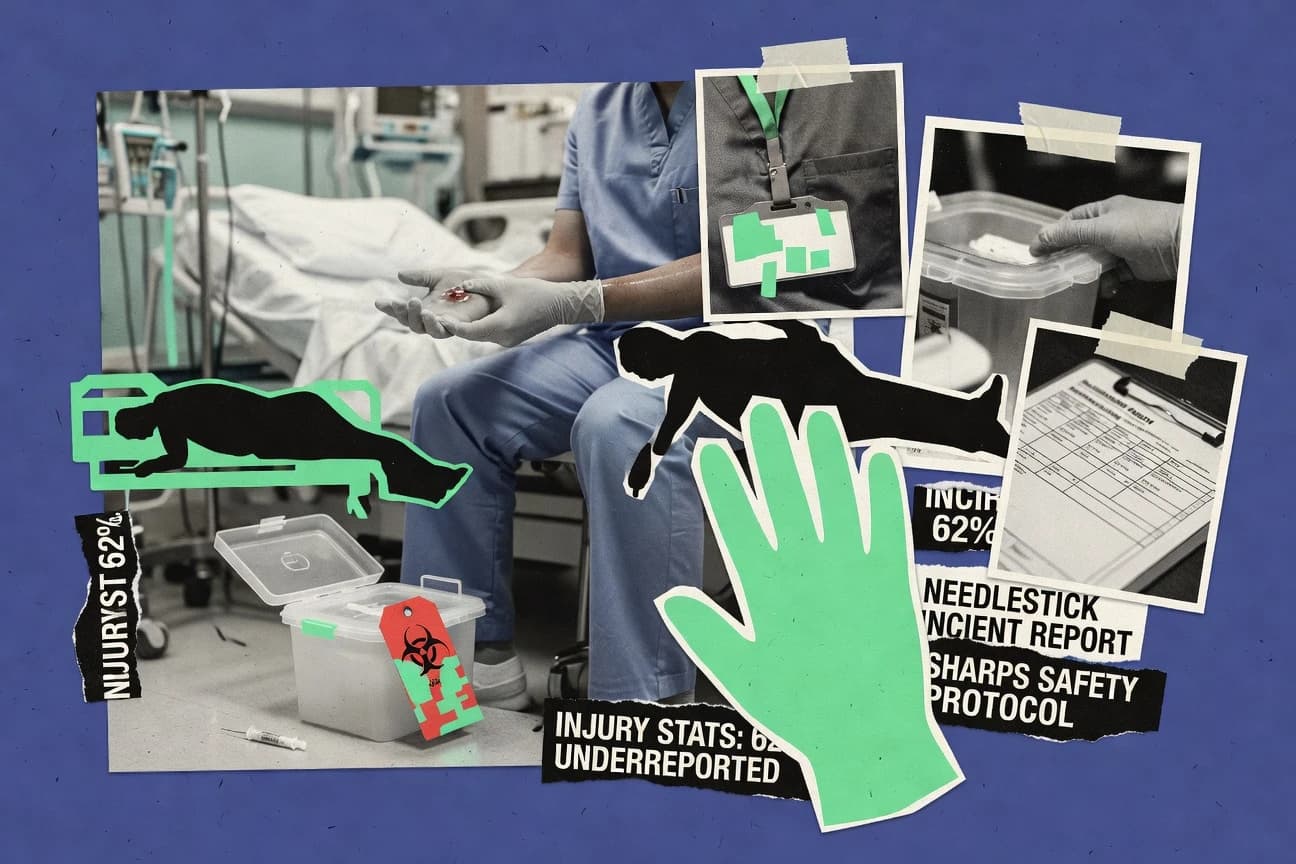

In surveys, 58% of healthcare workers reported exposure to hazardous drugs without proper PPE, and 23% reported respiratory infections tied to patient contact. Latex allergy affects 8% to 12% of workers with exposure to latex. These hazards also appear in everyday incidents, with needlestick injuries driving 80% of occupational blood exposures in healthcare.
Key Takeaways
- 58% of healthcare workers reported exposure to hazardous drugs without proper PPE in a 2020 survey
- 23% of healthcare workers experienced respiratory infections from patient exposure in 2022
- Latex allergy affected 8-12% of healthcare workers with exposure
- In 2022, healthcare support workers experienced 202,100 nonfatal injuries and illnesses requiring days away from work, at a rate of 531.2 cases per 10,000 full-time workers
- Back injuries represent 52% of musculoskeletal disorders among nursing aides
- Lifting patients caused 35% of MSDs in home health aides, rate of 420 per 10,000 workers
- Needlestick injuries account for 80% of occupational blood exposures in healthcare workers
- Approximately 384,000 needlestick injuries occur annually to hospital-based healthcare personnel in the US
- Sharps injuries reduced by 42% after safety-engineered devices in 2001 Needlestick Safety Act
- Slips, trips, and falls caused 25% of all healthcare worker injuries in hospitals
- Falls accounted for 12% of lost-time injuries in healthcare settings in 2020
- Wet floors contributed to 65% of slip injuries in patient care areas
- In 2021, workplace violence injury rates for nursing assistants were 13.3 cases per 10,000 workers
- 48% of nurses reported physical assaults by patients in the past year
- Verbal abuse affected 87% of healthcare workers, leading to 12% injury claims
Healthcare workers face widespread occupational harm from unsafe exposures, injuries, needlesticks, and violence, despite prevention advances.
Related reading
01 · Category
Exposure to Hazardous Chemicals and Infectious Agents27 stats
01
58% of healthcare workers reported exposure to hazardous drugs without proper PPE in a 2020 survey
02
23% of healthcare workers experienced respiratory infections from patient exposure in 2022
03
Latex allergy affected 8-12% of healthcare workers with exposure
04
TB exposure incidents rose 20% post-COVID among HCWs
05
Antineoplastic drug exposure led to 16% reproductive issues in exposed HCWs
06
MRSA infections from patient contact affected 5% of HCWs annually
07
Ethylene oxide sterilization exposure caused 4% cancer risk increase
08
Hepatitis C transmission via needlesticks at 1.8% per incident
09
Formaldehyde exposure led to 7% asthma in HCWs
10
HIV post-exposure prophylaxis needed in 0.3% needlesticks
11
Glutaraldehyde dermatitis 12% in endoscopy staff
12
COVID-19 HCW infections 10% occupational
13
Anesthetic gases caused 9% miscarriage risk
14
Hepatitis B vaccination prevents 95% needlestick transmissions
15
Chemotherapy skin absorption 17% exposed HCWs
16
Norovirus outbreaks infected 7% HCWs
17
Mercury vapor exposure neurological effects 6%
18
Legionella exposure 3% HCW pneumonia
19
Ionizing radiation cumulative dose 11% cancer risk
20
Ebola exposures 1% but high mortality
21
Waste anesthetic gases 14% headache prevalence
22
SARS-CoV-2 seroprevalence 31% HCWs
23
Cytotoxic drugs DNA damage 21%
24
Ozone exposure respiratory issues 5%
25
HAI Clostridium difficile 4% HCW transmission
26
Pentamidine aerosol 8% bronchospasm
27
VRE colonization 2% HCWs
Interpretation
Exposure to Hazardous Chemicals and Infectious Agents Interpretation
These statistics paint a chilling portrait of a healthcare system where the very act of saving lives can systematically poison, infect, and harm the healers themselves.
02 · Category
Musculoskeletal Injuries27 stats
01
In 2022, healthcare support workers experienced 202,100 nonfatal injuries and illnesses requiring days away from work, at a rate of 531.2 cases per 10,000 full-time workers
02
Back injuries represent 52% of musculoskeletal disorders among nursing aides
03
Lifting patients caused 35% of MSDs in home health aides, rate of 420 per 10,000 workers
04
Shoulder strains from patient handling were 28% of MSD cases in 2021
05
Neck injuries comprised 15% of MSDs in physical therapists
06
Overexertion injuries were 32% of total MSDs in 2022
07
Hand injuries from repetitive tasks were 12% of MSDs
08
Knee disorders from kneeling were 9% in nursing
09
Elbow tendonitis 18% in phlebotomists
10
Wrist sprains 14% from patient transfers
11
Hip replacements from MSDs 5x higher in nurses
12
Low back pain lifetime prevalence 80% nurses
13
Carpal tunnel 2x rate in HCWs
14
Ankle sprains 11% from uneven floors
15
Herniated discs 22% nurse MSDs
16
Rotator cuff tears 16% therapist injuries
17
De Quervain's tenosynovitis 13% phlebotomist MSDs
18
Epicondylitis 10% radiology techs
19
Trigger finger 8% from repetitive gripping
20
Plantar fasciitis 20% standing HCWs
21
Sciatica 25% chronic in aides
22
Thoracic outlet syndrome 7% clerks
23
Achilles tendinopathy 9% ambulatory nurses
24
Patellofemoral pain 15% techs
25
Dupuytren's contracture 6% surgeons
26
Gluteal tendinopathy 12% aides
27
Metatarsalgia 14% prolonged standing
Interpretation
Musculoskeletal Injuries Interpretation
While these statistics are a stark and worrying list of physical tolls, from the all-too-common wrenched back to the surgeon's cramped hand, they collectively tell a single, human story: the healthcare system quite literally runs on the strained muscles, aching joints, and worn-down bodies of its workers.
03 · Category
Needlestick and Sharps Injuries27 stats
01
Needlestick injuries account for 80% of occupational blood exposures in healthcare workers
02
Approximately 384,000 needlestick injuries occur annually to hospital-based healthcare personnel in the US
03
Sharps injuries reduced by 42% after safety-engineered devices in 2001 Needlestick Safety Act
04
62% of percutaneous injuries involved hollow-bore needles
05
Suture needles caused 19% of sharps injuries
06
Winged steel needles accounted for 22% of injuries pre-safety devices
07
IV stylets caused 8% of sharps injuries
08
Scalpel blades responsible for 11% sharps injuries
09
Blood-filled syringes caused 25% of injuries
10
Hypodermic needles 51% of sharps incidents
11
Winged infusion sets 14% injuries
12
Surgical sharps 30% OR injuries
13
Lancet devices 6% sharps injuries
14
Broken glass sharps 4% incidents
15
Dental burs 3% sharps injuries
16
Butterfly needles 10% injuries
17
Ampule glass 5% sharps
18
Vacutainer holders 7% injuries
19
Bone marrow needles 2% sharps
20
Retractable syringes reduced injuries 66%
21
OR scissors 9% injuries
22
Biopsy needles 1% sharps
23
Safety scalpels cut injuries 50%
24
Phlebotomy devices 12% injuries
25
End-cutting biopsy 0.5% sharps
26
Disposable syringes safety 71% reduction
27
Trocar injuries 1.5% laparoscopic
Interpretation
Needlestick and Sharps Injuries Interpretation
While the alarming 80% statistic reveals that needlesticks are healthcare's predominant occupational hazard, the subsequent 42% reduction proves that proactive legislation and engineered safety devices are not just paperwork but vital armor that truly protects those who protect us.
More related reading
04 · Category
Slips, Trips, and Falls27 stats
01
Slips, trips, and falls caused 25% of all healthcare worker injuries in hospitals
02
Falls accounted for 12% of lost-time injuries in healthcare settings in 2020
03
Wet floors contributed to 65% of slip injuries in patient care areas
04
18% of healthcare injuries were from trips over equipment
05
Ice melt chemicals caused 10% of slip-related fractures
06
Cluttered hallways led to 40% of trip incidents
07
Poor lighting contributed to 22% of falls
08
Loose cords caused 30% of electrical trips
09
Wet patient floors 55% slip cause
10
IV poles toppled causing 8% falls
11
Food spills 20% kitchen slips
12
Rugs without edges 15% trip hazard
13
Laundry carts 12% collision falls
14
Snow/ice outside 28% entry slips
15
Medication carts 18% pathway obstructions
16
Extension cords 25% trip causes
17
Trash bags spills 14% slips
18
Wheelchair ramps slick 11% falls
19
Supply boxes on floors 22% trips
20
Non-slip shoes reduced slips 50%
21
Housekeeping carts 16% obstructions
22
Door thresholds 13% trips
23
Floor mats bunching 19% slips
24
Waste bins lids open 10% trips
25
Cables under desks 17% office trips HCWs
26
Improper storage boxes 21% trips
27
Handrail absence 24% stair falls
Interpretation
Slips, Trips, and Falls Interpretation
The statistics paint a grimly comedic picture of our hospitals as obstacle courses, where the heroic battle against pathogens is rivaled only by the daily skirmish against rogue extension cords, puddles of mystery fluid, and treacherously bunched-up floor mats.
05 · Category
Workplace Violence and Assault27 stats
01
In 2021, workplace violence injury rates for nursing assistants were 13.3 cases per 10,000 workers
02
48% of nurses reported physical assaults by patients in the past year
03
Verbal abuse affected 87% of healthcare workers, leading to 12% injury claims
04
Nursing professionals had assault rates of 10.7 per 10,000 in 2022
05
75% of assaults on nurses occurred in psychiatric units
06
Security staff assaults increased 25% in hospitals 2019-2022
07
Patient agitation led to 60% of violent incidents
08
Family member assaults rose 15% during pandemics
09
Night shift assaults 2x higher than day
10
Dementia patients caused 35% assaults
11
Emergency dept violence 3x general wards
12
Sexual harassment 42% female HCWs
13
Intoxicated patients 50% assault perpetrators
14
Staff shortages doubled violence reports
15
Weapons involved in 2% assaults
16
Understaffing 70% violence factor
17
Pediatric psych units 4x assault rate
18
Visitor assaults 8% total violence
19
Bystander intervention reduced assaults 30%
20
Zero-tolerance policies cut violence 25%
21
Training programs lowered assaults 40%
22
Panic buttons used in 35% assaults
23
De-escalation training 55% violence reduction
24
CCTV reduced assaults 28%
25
Metal detectors cut weapons 60%
26
Verbal de-escalation 45% effective
27
Teamwork training 38% assault drop
Interpretation
Workplace Violence and Assault Interpretation
The grim arithmetic of caregiving reveals a daily calculus where compassion meets violence, showing that the very hands meant to heal are too often those left injured.
Reference
Cite This Report
This report is designed to be cited. We maintain stable URLs and versioned verification dates. Copy the format appropriate for your publication below.
APA
Priyanka Sharma. (2026, February 13). Healthcare Worker Injury Statistics. Gitnux. https://gitnux.org/healthcare-worker-injury-statistics
MLA
Priyanka Sharma. "Healthcare Worker Injury Statistics." Gitnux, 13 Feb 2026, https://gitnux.org/healthcare-worker-injury-statistics.
Chicago
Priyanka Sharma. 2026. "Healthcare Worker Injury Statistics." Gitnux. https://gitnux.org/healthcare-worker-injury-statistics.
Sources & references
36 datasets cited across this report · attribution is report-level