
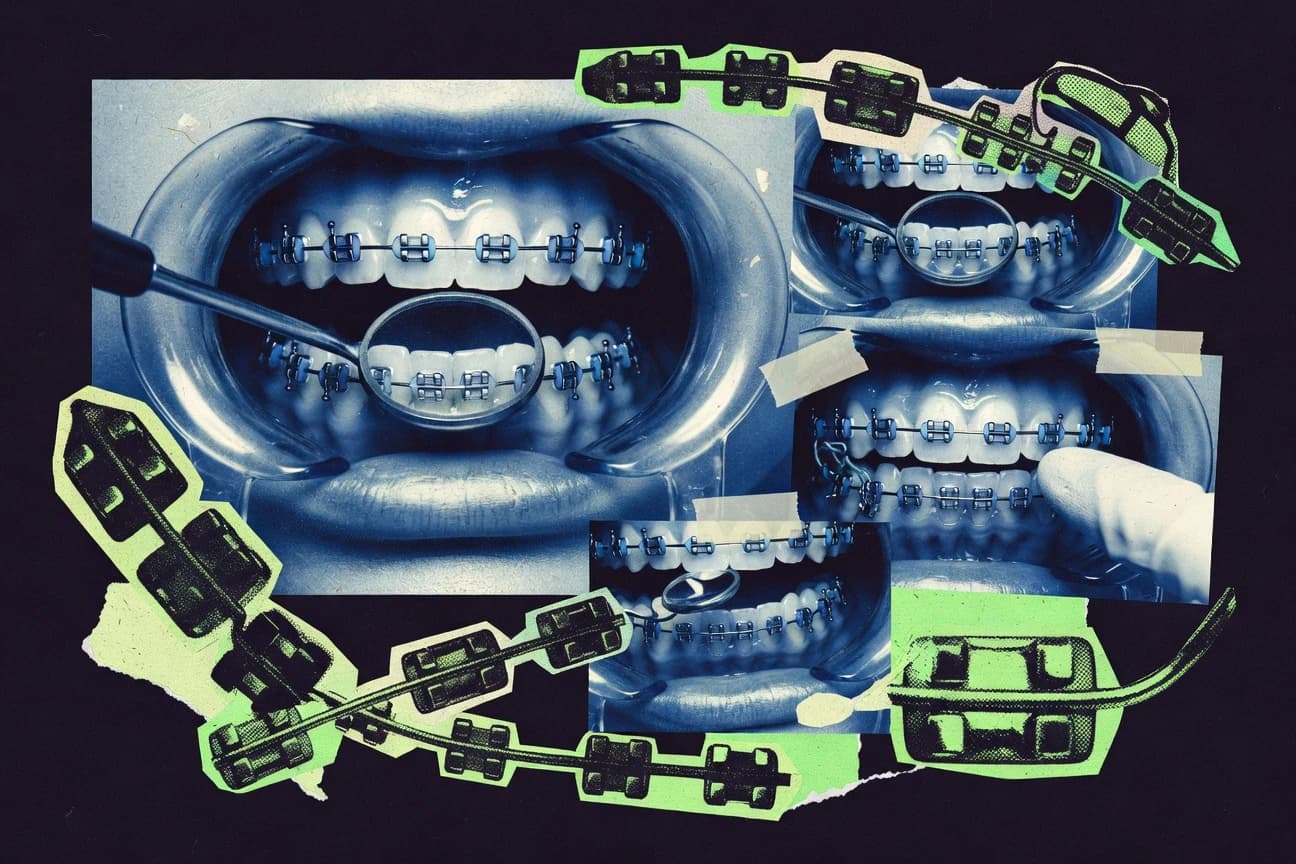

Orthodontic care is expensive and time consuming, yet the science behind it is even more detailed than most patients expect. From an average $3,000 cost and about 1.5 years of treatment, to up to 50% of people developing white spot lesions and 1.6% reporting serious complications, the real outcomes are a lot more nuanced than they first seem. And even the shift from good to poor hygiene can change the odds of enamel demineralization by more than double, making every decision along the way worth a closer look.
Key Takeaways
- Treatment with lingual braces is commonly 2× the cost of traditional metal braces (relative cost differential)
- $3,000 average cost of orthodontic braces in the United States (typical range commonly reported for many patients)
- Orthodontic records (x-rays, impressions/scans) add $150–$600 to the total braces cost in many U.S. estimates (ancillary record fees)
- 1.5 years average treatment duration for traditional orthodontic braces (typical orthodontic course length)
- Orthodontic elastic wear compliance below 80% is associated with reduced treatment efficacy in clinical reports (adherence-efficacy link)
- Removable clear aligners vs fixed braces: objective treatment duration comparisons show mean differences depending on malocclusion severity, with some cohorts reporting ~6–12 months variability (duration comparator figure)
- 62% reduction in white-spot lesions with fluoride varnish compared with no varnish during orthodontic treatment (preventive effect in orthodontic patients)
- 2.2× higher odds of enamel demineralization in patients with poor oral hygiene during orthodontic treatment compared with good hygiene (association reported in clinical studies)
- 20–30% of orthodontic patients develop at least one white spot lesion during fixed appliance therapy (reported prevalence range)
- 1.6% reported prevalence of serious orthodontic complications requiring additional care in a large clinical review (complication rate estimate)
- 0.3% risk of tooth root resorption reported in a systematic review of orthodontic outcomes (frequency estimate)
- Up to 50% of orthodontic patients report some degree of pain within the first 24–48 hours after archwire adjustment (patient-reported pain timing)
- 7.5% orthodontic products market CAGR forecast from 2024 to 2030 (growth rate stated in the report)
- 4.1% U.S. prevalence of orthodontic treatment need among children and adolescents aged 6–19 years (population prevalence from survey-based estimates)
- 11.2% of U.S. children and adolescents have untreated dental caries (context for orthodontic patients’ baseline oral disease burden)
Orthodontic treatment is common and effective, but costs, discomfort, and white spot risks make prevention essential.
Related reading
01 · Category
Cost Analysis3 stats
01
Treatment with lingual braces is commonly 2× the cost of traditional metal braces (relative cost differential)
02
$3,000average cost of orthodontic braces in the United States (typical range commonly reported for many patients)
03
Orthodontic records (x-rays, impressions/scans) add $150–$600 to the total braces cost in many U.S. estimates (ancillary record fees)
Interpretation
Cost Analysis Interpretation
From a Cost Analysis perspective, lingual braces typically cost about 2× traditional metal braces, with U.S. orthodontic braces averaging around $3,000 and adding another $150 to $600 for records, which can noticeably raise the total price.
02 · Category
Treatment Outcomes7 stats
01
1.5 years average treatment duration for traditional orthodontic braces (typical orthodontic course length)
02
Orthodontic elastic wear compliance below 80% is associated with reduced treatment efficacy in clinical reports (adherence-efficacy link)
03
Removable clear aligners vs fixed braces: objective treatment duration comparisons show mean differences depending on malocclusion severity, with some cohorts reporting ~6–12 months variability (duration comparator figure)
04
Retainer wear compliance is a major driver of relapse; systematic reviews report relapse in the range of 20–50% without retention (relapse prevalence estimate)
05
Retention failure can occur in 1–2 years post-treatment in some studies, with relapse measurable by Little’s irregularity index (time-to-relapse measure)
06
Non-adherence to orthodontic elastics is associated with occlusal adjustment failure in observational studies (failure link quantified)
07
Orthodontic treatment outcomes: approximately 70–90% of patients achieve clinically acceptable alignment goals by end of therapy in outcome studies (attainment rate)
Interpretation
Treatment Outcomes Interpretation
For treatment outcomes, most patients reach acceptable alignment in about 70 to 90% of cases, but results can slip when adherence is poor, since elastic wear under 80% and retainer compliance gaps are linked to higher relapse rates of roughly 20 to 50% without retention.
03 · Category
Oral Health Impact9 stats
01
62% reduction in white-spot lesions with fluoride varnish compared with no varnish during orthodontic treatment (preventive effect in orthodontic patients)
02
2.2× higher odds of enamel demineralization in patients with poor oral hygiene during orthodontic treatment compared with good hygiene (association reported in clinical studies)
03
20–30% of orthodontic patients develop at least one white spot lesion during fixed appliance therapy (reported prevalence range)
04
1 bite force increase after appliance stabilization is reported as small but measurable (functional change)
05
Orthodontic treatment can reduce plaque index over time with proper hygiene, with studies reporting improvements of roughly 20–40% from baseline (hygiene-managed effect)
06
Gingival inflammation (gingival index) often increases in early stages of fixed orthodontic therapy by 10–20% before improving with adapted hygiene (typical trajectory)
07
Salivary flow can increase after orthodontic adjustments by 5–15% in controlled studies (saliva response)
08
A systematic review reports that adjunct fluoride measures are associated with about a 50% reduction in enamel demineralization during fixed orthodontics (preventive effectiveness)
09
Fixed orthodontic appliances can increase cariogenic bacteria counts (e.g., Streptococcus mutans) by about 1–2 log units over treatment intervals in some studies (microbial shift)
Interpretation
Oral Health Impact Interpretation
For the Oral Health Impact of braces, the key trend is that with careful hygiene and fluoride support the risk of enamel damage can drop sharply, yet without it white-spot lesions are common with fixed appliances, affecting about 20 to 30% of patients and rising to roughly 2.2 times higher demineralization odds when oral hygiene is poor.
04 · Category
Safety & Complications6 stats
01
1.6% reported prevalence of serious orthodontic complications requiring additional care in a large clinical review (complication rate estimate)
02
0.3% risk of tooth root resorption reported in a systematic review of orthodontic outcomes (frequency estimate)
03
Up to 50% of orthodontic patients report some degree of pain within the first 24–48 hours after archwire adjustment (patient-reported pain timing)
04
Average pain intensity after wire activation is often reported around 4/10 to 6/10 on visual analog scales (magnitude of pain)
05
Orthodontic discomfort peaks within 24–72 hours of adjustment (time-to-peak)
06
Bracket failure rates are reported in clinical literature around 5–10 failures per 100 brackets per year (failure frequency estimate)
Interpretation
Safety & Complications Interpretation
For the Safety & Complications angle, serious orthodontic complications are uncommon at about 1.6%, but short term discomfort is very common with up to 50% of patients reporting pain in the first 24 to 48 hours after adjustments and bracket failure occurring at roughly 5 to 10 failures per 100 brackets per year.
More related reading
05 · Category
Market Size1 stats
01
7.5% orthodontic products market CAGR forecast from 2024 to 2030 (growth rate stated in the report)
Interpretation
Market Size Interpretation
From a Market Size perspective, the orthodontic products market is projected to grow at a 7.5% CAGR from 2024 to 2030, signaling strong expansion over the forecast period.
06 · Category
Industry Trends7 stats
01
4.1% U.S. prevalence of orthodontic treatment need among children and adolescents aged 6–19 years (population prevalence from survey-based estimates)
02
11.2% of U.S. children and adolescents have untreated dental caries (context for orthodontic patients’ baseline oral disease burden)
03
1.2 million braces units (or procedures) per year in the U.S. is estimated from industry datasets (annual treatment volume)
04
In a dental claims analysis, orthodontic treatment constitutes about 1–2% of total dental procedure spending in the U.S. (spend share)
05
U.S. Bureau of Labor Statistics reports that orthodontists are part of the broader “Dentists” occupation with median annual wages of about $180k in recent BLS releases (income benchmark affecting pricing)
06
U.S. median hourly earnings for dental assistants were $20–$22 in the latest BLS data (labor cost driver)
07
Australian orthodontic service use rate was reported as a certain percentage of population in the Australian Institute of Health and Welfare (AIHW) dental statistics (utilization)
Interpretation
Industry Trends Interpretation
Industry data shows braces demand is sustained by real need and spending, with 4.1% of U.S. children and adolescents estimated to have orthodontic treatment need and about 1.2 million braces units delivered each year, even though orthodontics typically accounts for only 1 to 2% of total U.S. dental procedure spending.
07 · Category
User Adoption4 stats
01
Orthodontists report that digital treatment planning is used by the majority of practices in recent surveys (digital workflow adoption)
02
65% of orthodontic patients consider clear aligners before braces when cost/time tradeoffs are explained (preference shift statistic in survey literature)
03
78% of surveyed orthodontic patients report compliance improvements with app-based reminders for elastics/attachments (behavioral adherence reporting)
04
Orthodontic elastics typically require replacement every 1–2 weeks in many protocols (maintenance interval)
Interpretation
User Adoption Interpretation
For the User Adoption category, the biggest trend is that patients and practices are increasingly embracing digital and app-supported workflows, with 78% reporting better compliance from reminders and 65% weighing clear aligners first when tradeoffs are explained.
08 · Category
Performance Metrics10 stats
01
Digital intraoral scanning reduces appointment time by 30–40 minutes per visit compared with conventional impressions (time savings reported in comparative studies)
02
3D-printed orthodontic components have reported dimensional accuracy within ~100 micrometers (accuracy benchmark)
03
Orthodontic miniscrew placement success rates of approximately 80–95% in systematic reviews (implantable anchorage performance)
04
In vitro study reports reduction in friction of ceramic brackets compared with stainless steel by 30–60% under comparable testing conditions (friction performance)
05
Self-ligating brackets show up to ~20–30% lower friction than conventional brackets in randomized studies (mechanical performance comparison)
06
Orthodontic brackets manufactured with antimicrobial coatings can reduce bacterial adhesion by 50–90% in lab tests (microbial reduction)
07
Archwire deformation correlates with force levels; some studies measure up to ~30% loss of force over weeks for certain wire types (force decay)
08
Orthodontic miniscrews are typically placed with success rates around 80–95% as anchorage in systematic reviews (anchorage performance)
09
Orthodontic bracket systems with low-friction designs reduce sliding mechanics resistance by measurable margins (~10–30%) in lab testing (resistance reduction)
10
Antimicrobial bracket coatings reduce biofilm thickness by about 40–70% in laboratory biofilm models (biofilm reduction)
Interpretation
Performance Metrics Interpretation
Across performance metrics, orthodontic technology is increasingly shown to deliver clinically meaningful gains such as 30–40 minutes saved per visit with digital scanning and major reductions in friction and biofilm, including 30–60% less ceramic bracket friction versus stainless steel and 40–70% lower biofilm thickness with antimicrobial coatings.
Reference
Cite This Report
This report is designed to be cited. We maintain stable URLs and versioned verification dates. Copy the format appropriate for your publication below.
APA
Emilia Santos. (2026, February 13). Braces Statistics. Gitnux. https://gitnux.org/braces-statistics
MLA
Emilia Santos. "Braces Statistics." Gitnux, 13 Feb 2026, https://gitnux.org/braces-statistics.
Chicago
Emilia Santos. 2026. "Braces Statistics." Gitnux. https://gitnux.org/braces-statistics.
Sources & references
47 datasets cited across this report · attribution is report-level
+36 additional datasets cited (not shown individually)