In today’s highly competitive business environment, delivering exceptional customer support has become more critical than ever before. Enabling smooth and effective communication with customers not only fosters trust and loyalty but also cultivates long-term relationships, ultimately driving business growth. To ensure that customer support teams consistently deliver outstanding service, it is essential to establish, measure, and analyze key performance indicators (KPIs).
This blog post will delve into the world of Customer Support KPIs, discussing their importance, various types, and best practices to optimize your team’s efficiency and effectiveness in addressing customer needs and concerns. Stay tuned as we unlock the secrets to supercharging your customer support team and elevating your company’s service standards to new heights.
Customer Support KPIs You Should Know
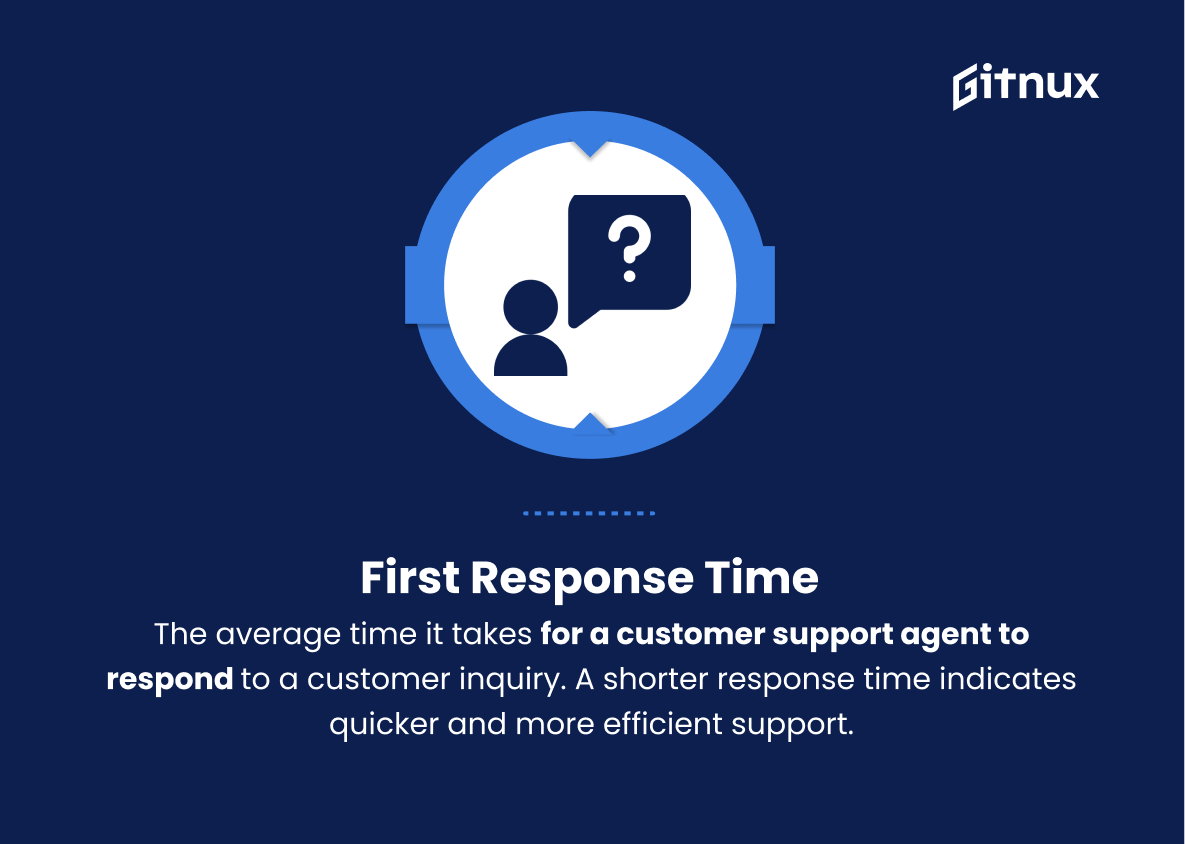
1. First Response Time
The average time it takes for a customer support agent to respond to a customer inquiry. A shorter response time indicates quicker and more efficient support.
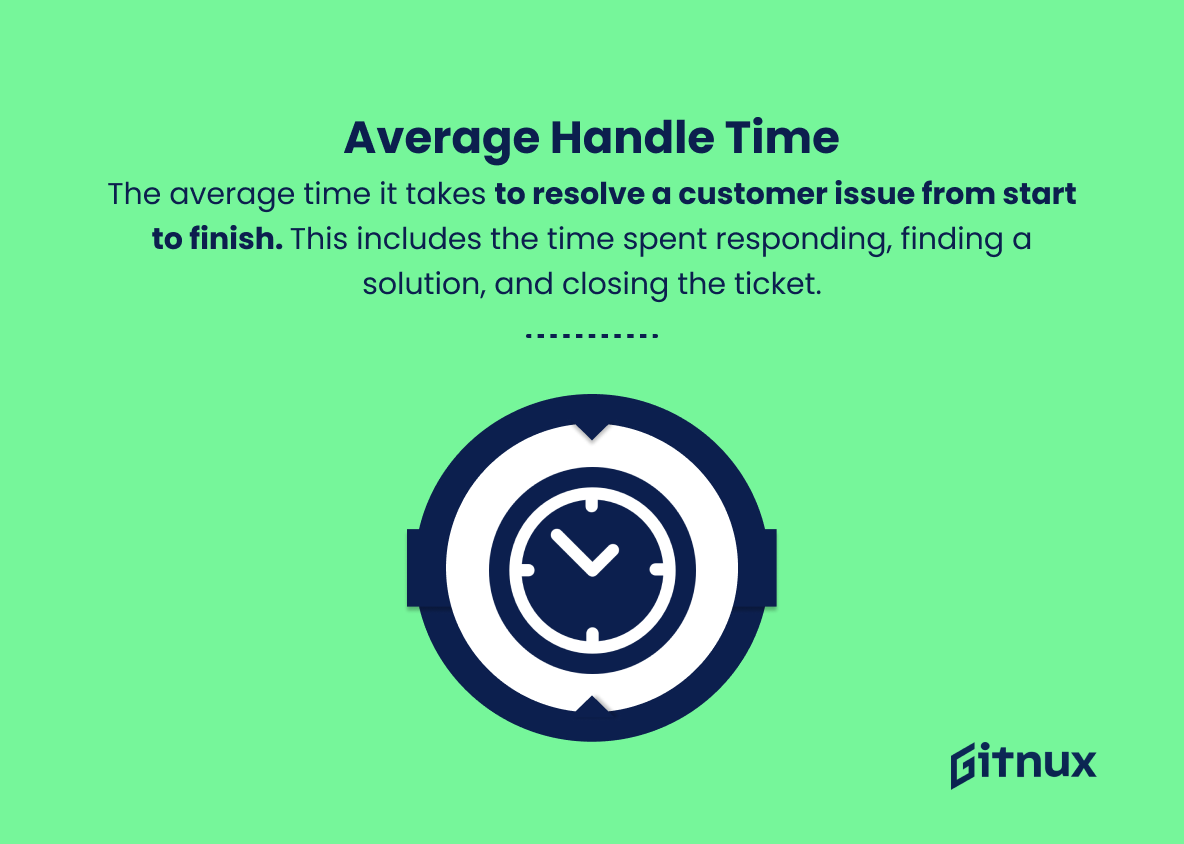
2. Average Handle Time
The average time it takes to resolve a customer issue from start to finish. This includes the time spent responding, finding a solution, and closing the ticket.
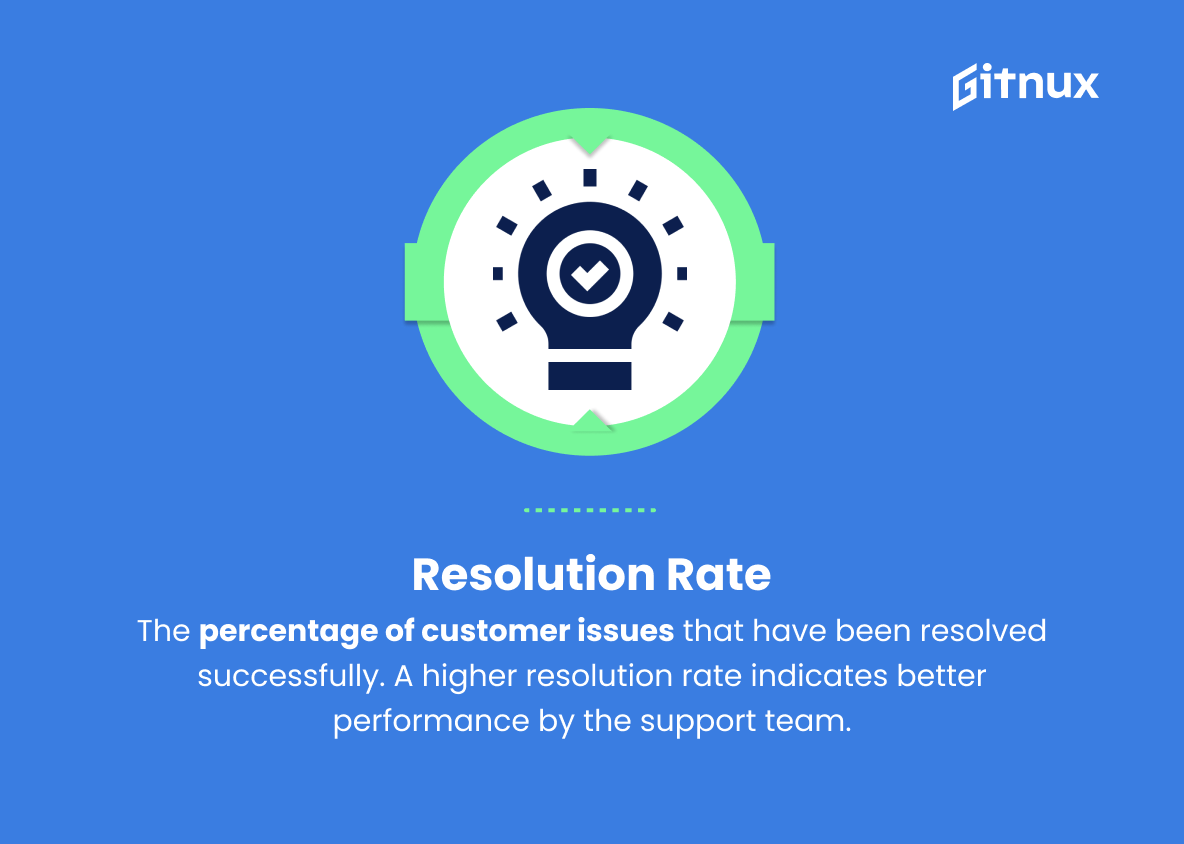
3. Resolution Rate
The percentage of customer issues that have been resolved successfully. A higher resolution rate indicates better performance by the support team.
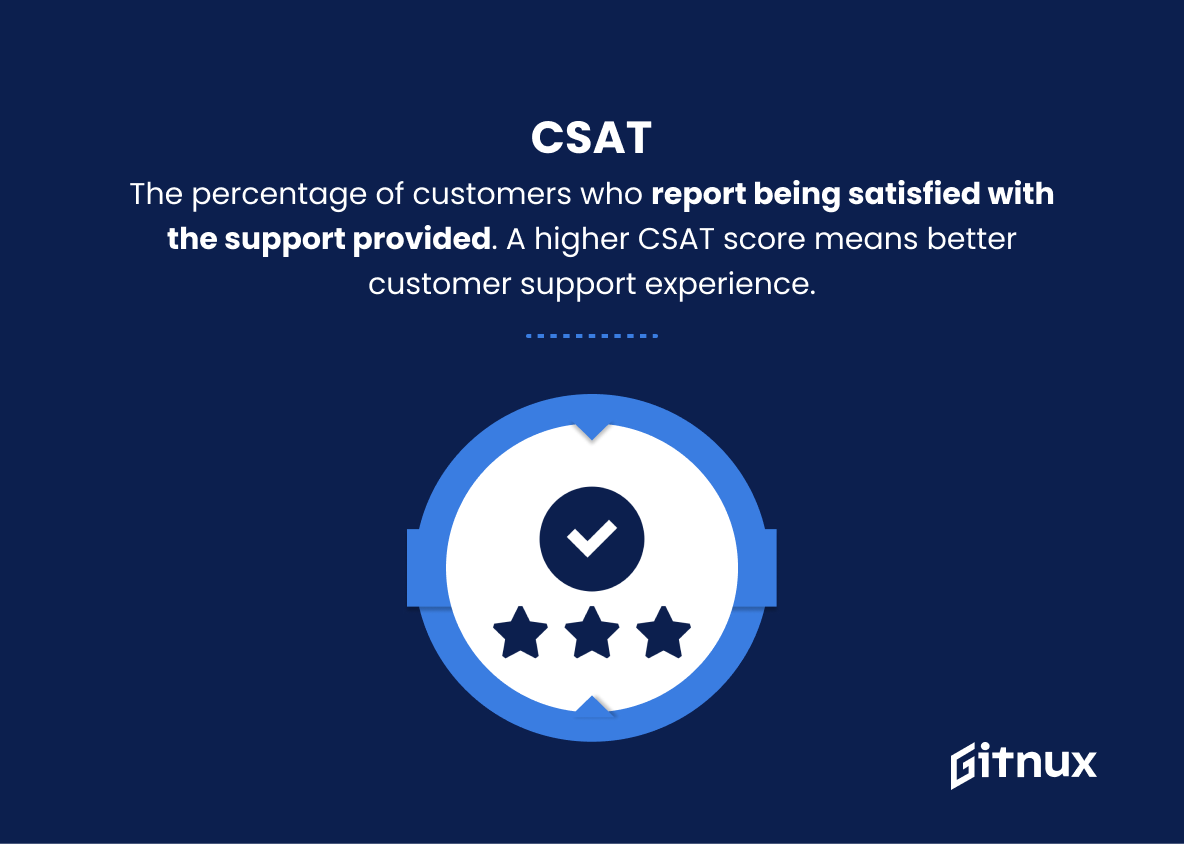
4. Customer Satisfaction Score (CSAT)
The percentage of customers who report being satisfied with the support provided. This is usually measured through post-support surveys, and a higher CSAT score means better customer support experience.
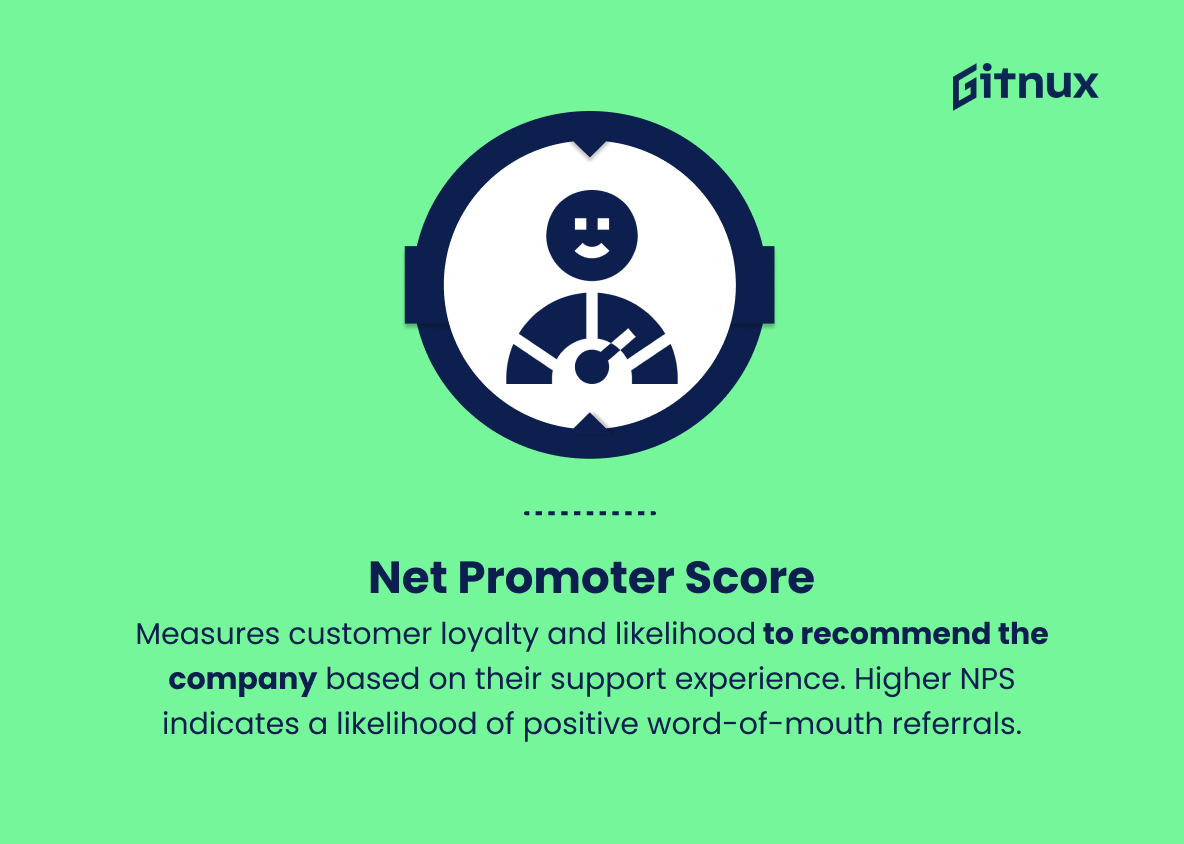
5. Net Promoter Score (NPS)
Measures customer loyalty and likelihood to recommend the company based on their support experience. A higher NPS score indicates a stronger likelihood of positive word-of-mouth referrals.
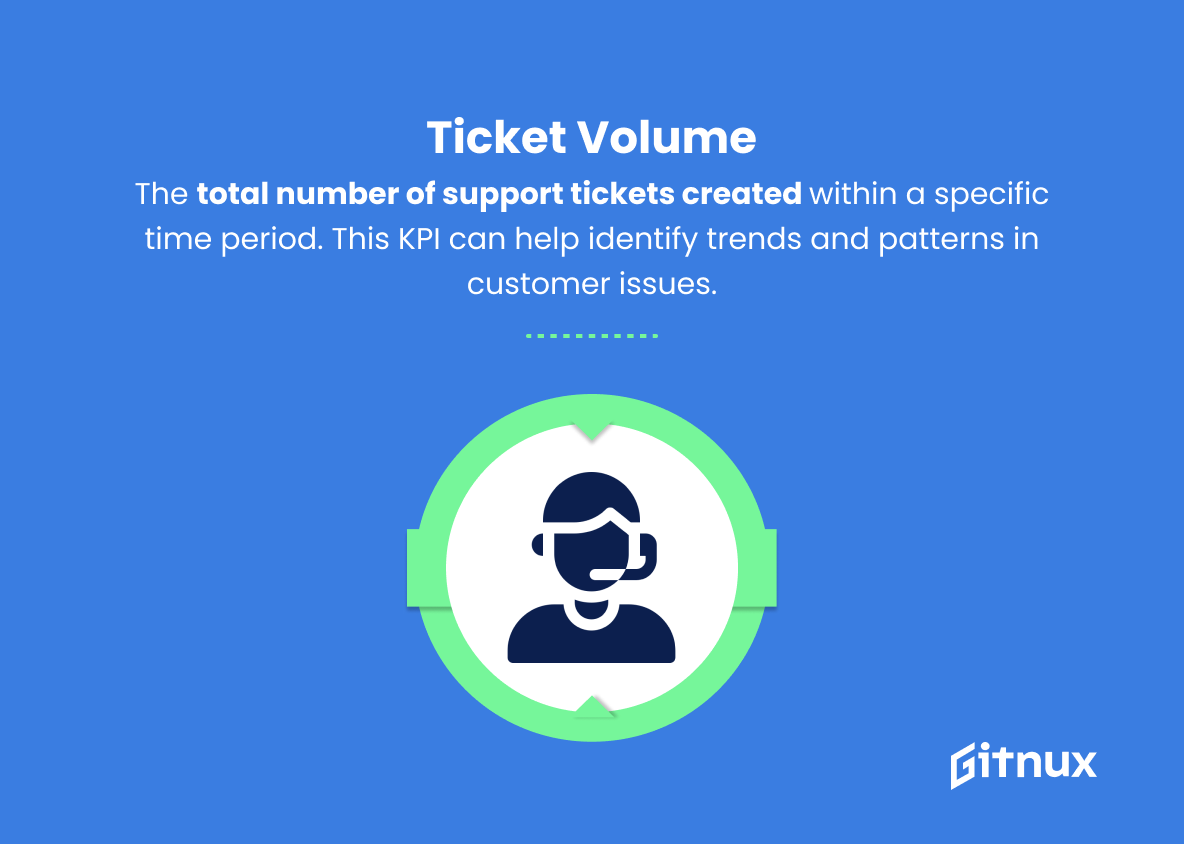
6. Ticket Volume
The total number of support tickets created within a specific time period. This KPI can help identify trends and patterns in customer issues and signal when additional resources may be needed.
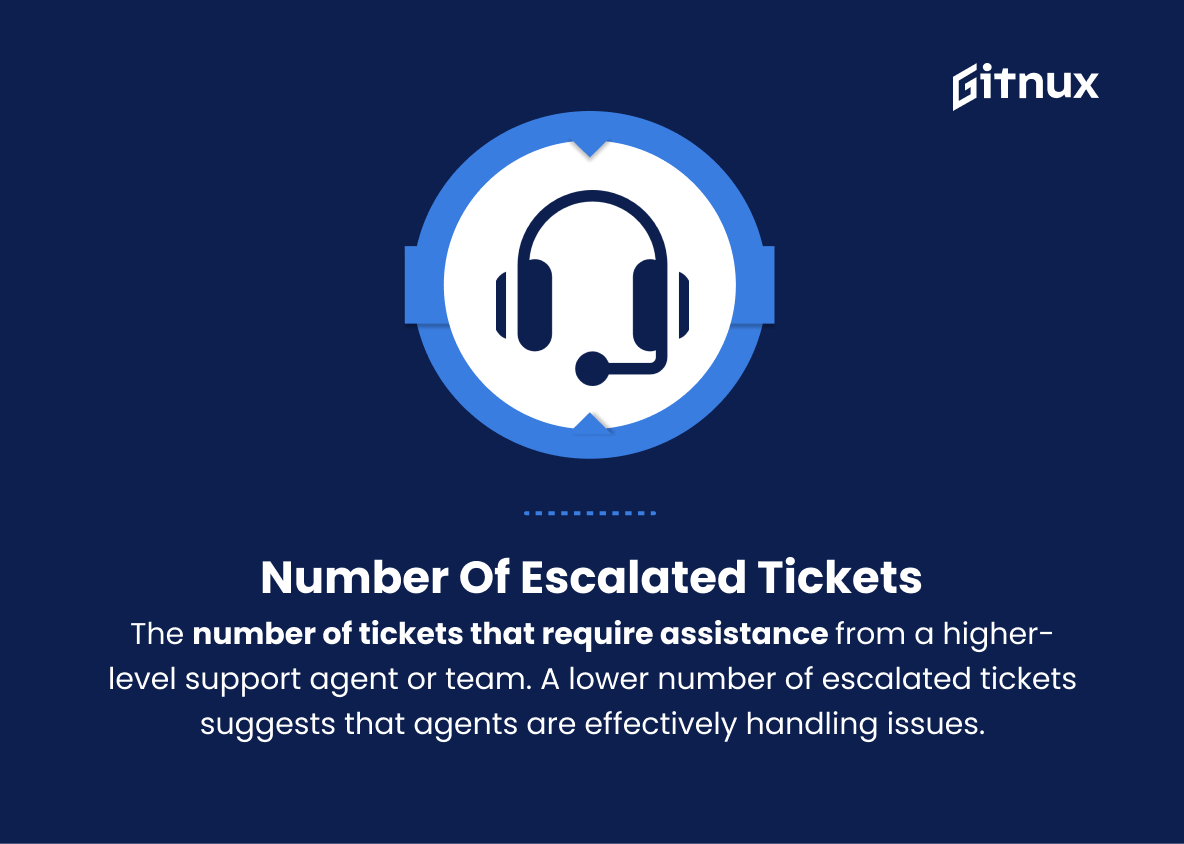
7. Number of Escalated Tickets
The number of tickets that require assistance from a higher-level support agent or team. A lower number of escalated tickets suggests that agents are effectively handling and resolving issues independently.
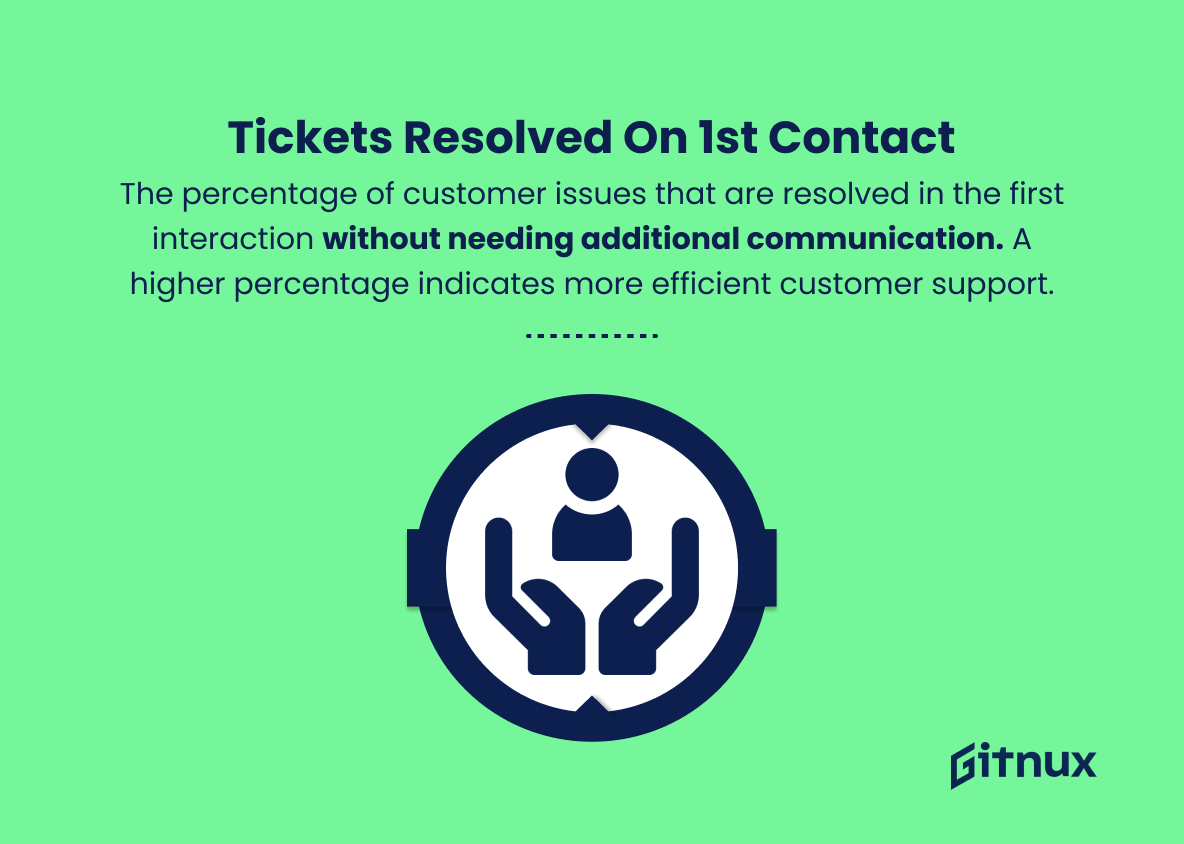
8. Percentage of Tickets Resolved on First Contact
The percentage of customer issues that are resolved in the first interaction without needing additional communication or escalation. A higher percentage indicates more efficient customer support.
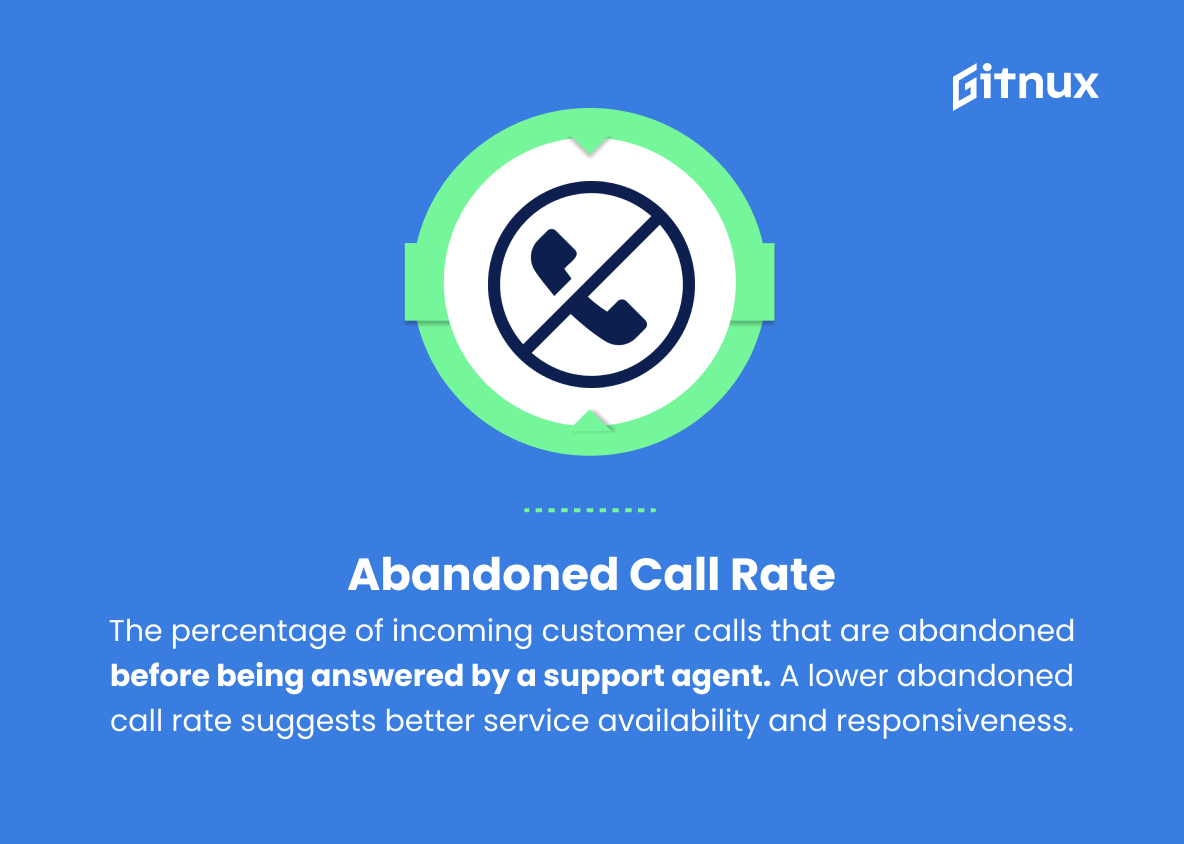
9. Abandoned Call Rate
The percentage of incoming customer calls that are abandoned (customer hangs up) before being answered by a support agent. A lower abandoned call rate suggests better service availability and responsiveness.
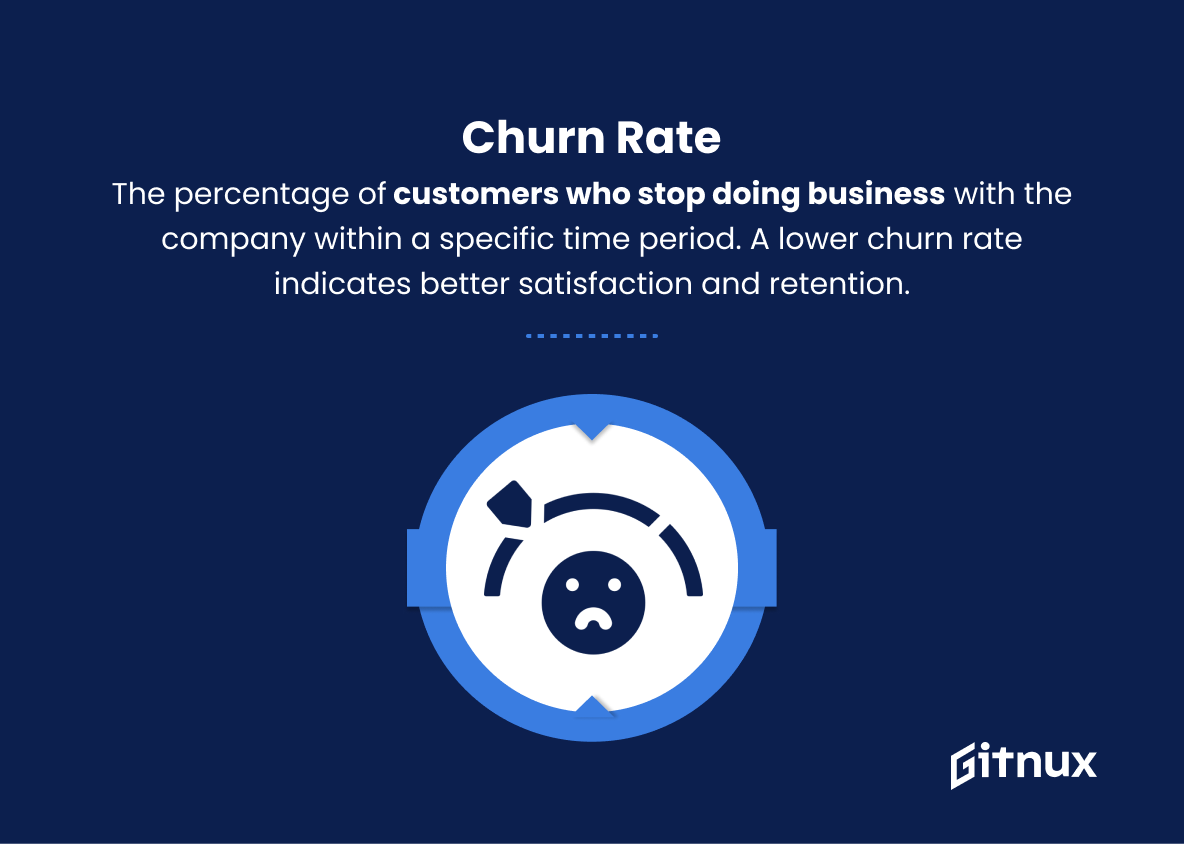
10. Churn Rate
The percentage of customers who stop doing business with the company within a specific time period. This can be influenced by customer support experiences, and a lower churn rate indicates better satisfaction and retention.
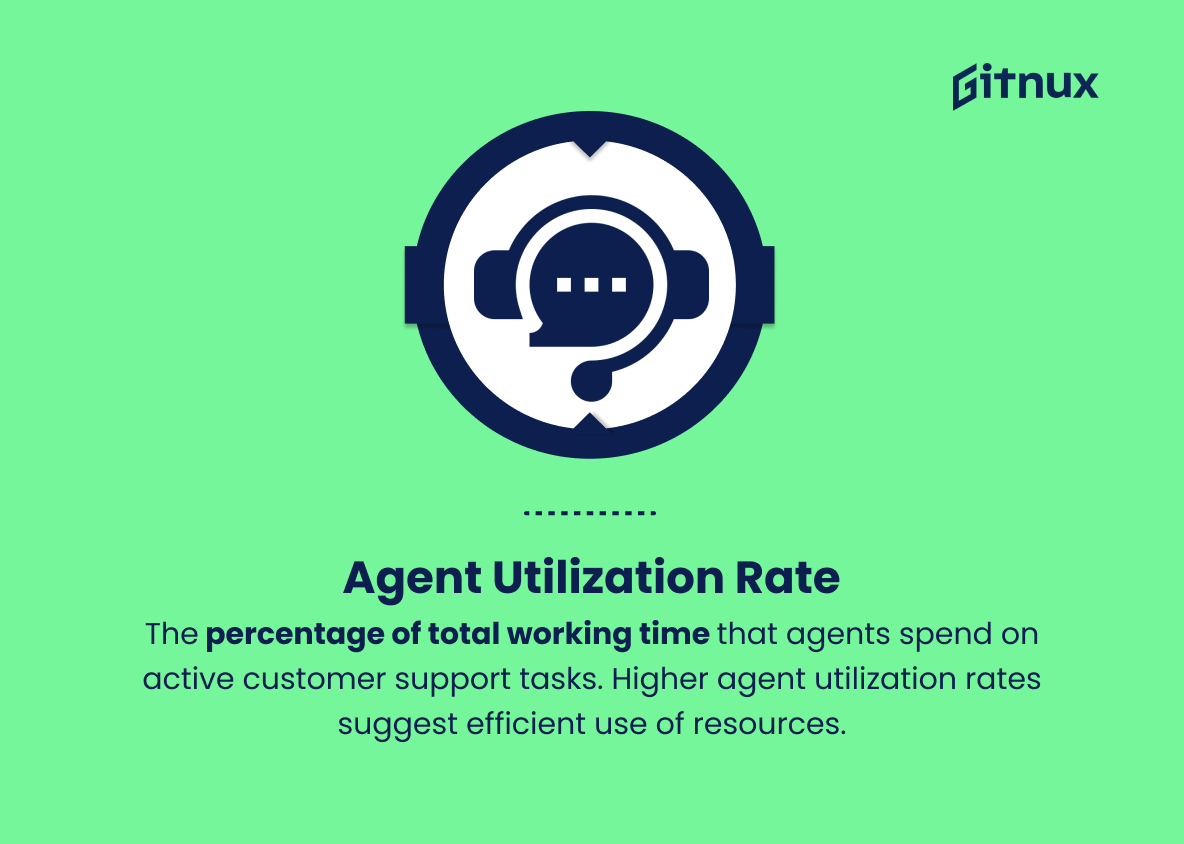
11. Agent Utilization Rate
The percentage of total working time that agents spend on active customer support tasks. Higher agent utilization rates suggest efficient use of resources and may also indicate the need for more team members to handle the workload.
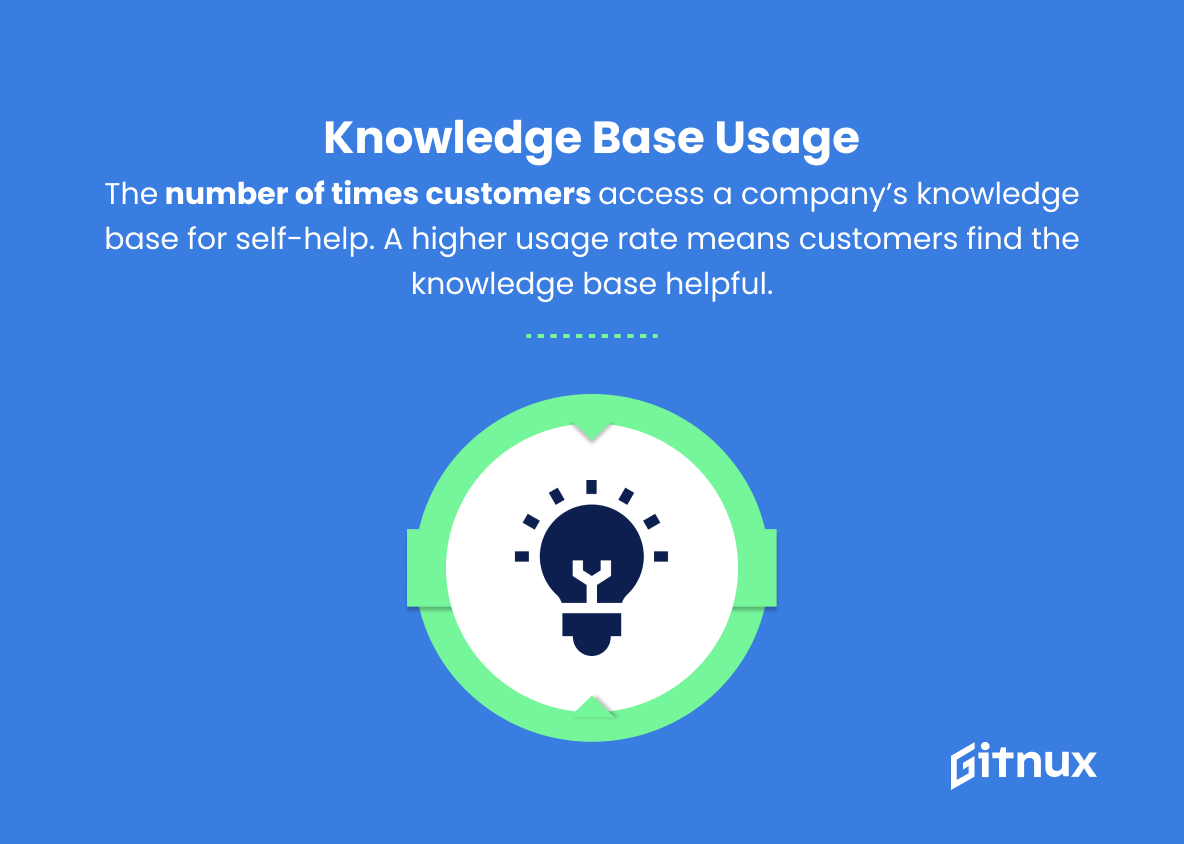
12. Knowledge Base Usage
The number of times customers access a company’s knowledge base for self-help. A higher usage rate means customers find the knowledge base helpful and easy to use, reducing the burden on customer support agents.
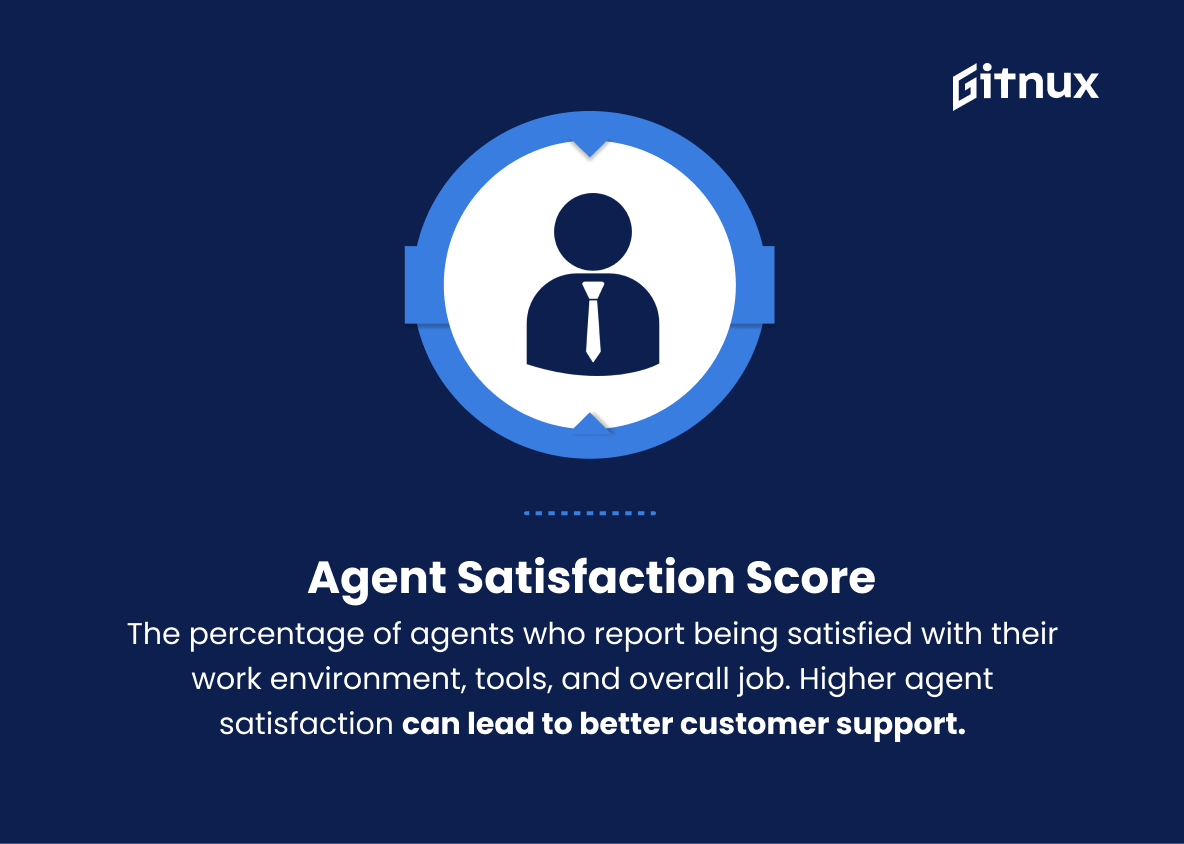
13. Agent Satisfaction Score
The percentage of agents who report being satisfied with their work environment, tools, and overall job. Higher agent satisfaction can lead to better customer support experiences and reduced employee turnover.
Customer Support KPIs Explained
Customer Support KPIs serve as essential performance metrics that help businesses understand the effectiveness and efficiency of their customer support teams. Key indicators such as First Response Time and Average Handle Time measure the team’s promptness and problem-solving capabilities. Meanwhile, the Resolution Rate, Customer Satisfaction Score (CSAT), and Net Promoter Score (NPS) gauge customer satisfaction levels and the potential for positive brand referrals.
Ticket Volume and Number of Escalated Tickets help identify trends and resource allocation needs, while Percentage of Tickets Resolved on First Contact, Abandoned Call Rate, and Churn Rate offer insights into service quality and customer retention. Supporting these metrics, Agent Utilization Rate and Knowledge Base Usage enable companies to optimize their resources and support infrastructure.
Finally, Agent Satisfaction Score reflects the work environment and satisfaction, leading to better overall customer support experiences and a stable workforce. Collectively, these KPIs empower businesses to create well-rounded, effective support teams and maintain high levels of customer satisfaction.
Conclusion
In summary, understanding and consistently monitoring Customer Support KPIs is crucial for any thriving business aiming to provide exceptional customer experiences. By focusing on key performance indicators such as resolution times, customer satisfaction rates, and ticket volumes, organizations can continuously assess the effectiveness of their customer support teams, identify areas for improvement, and invest in the necessary resources to enhance service quality.
Ultimately, these metrics serve as valuable tools in creating an atmosphere of customer-centricity that drives loyalty and long-term growth. Staying ahead in today’s competitive marketplace requires organizations to analyze and prioritize Customer Support KPIs in order to shape successful strategies for the benefit of both the company and its customers.
