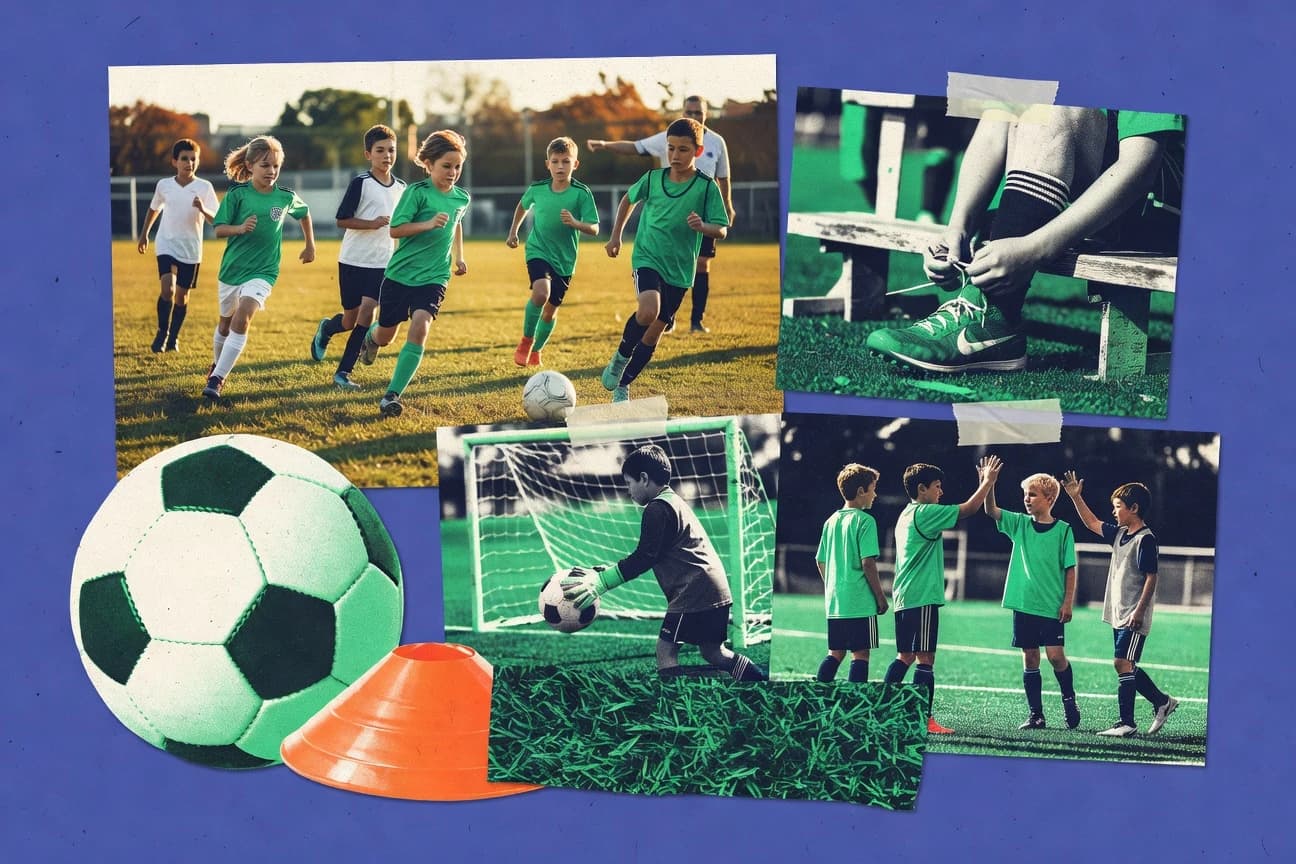
GITNUXREPORT 2025

Youth Sports Participation Statistics

Youth sports engagement declines 10%, but benefits include development and health.

Jannik Lindner

Jannik Linder

Co-Founder of Gitnux, specialized in content and tech since 2016.

First published: April 29, 2025

Our Commitment to Accuracy

Rigorous fact-checking • Reputable sources • Regular updatesLearn more

Key Statistics

Statistic 1

Over 60% of youth sports injuries are caused by overuse, often resulting from repetitive motion without proper rest

Statistic 2

The most common injury among youth sports participants is sprains and strains, accounting for about 50% of injuries

Statistic 3

Nearly 25% of youth sports injuries are caused by improper equipment, such as ill-fitting helmets or pads, highlighting the importance of safety gear

Statistic 4

Nearly 80% of youth sports injuries are preventable through proper training, conditioning, and protective equipment, emphasizing injury prevention strategies

Statistic 5

The majority of youth sports injuries occur during practices rather than competitions, accounting for nearly 60% of injury cases

Statistic 6

The implementation of injury prevention programs in youth sports has reduced injury rates by up to 30%, according to research

Statistic 7

Only about 10% of youth sports organizations have formal policies on concussion management, indicating a gap in safety protocols

Statistic 8

Nearly 65% of youth sports injuries occur in children aged 10-14, making it a critical age group for injury prevention efforts

Statistic 9

The number of youth sports organizations that offer injury prevention education has grown by approximately 15% in the past three years, signaling increased awareness

Statistic 10

Nearly 75% of youth sports coaches are volunteers, highlighting community-based involvement

Statistic 11

Among youth athletes, participation in team sports is associated with higher levels of social skills and teamwork abilities, according to research

Statistic 12

Sponsorship and funding for youth sports organizations increased by approximately 12% in 2022, signaling rising investment in youth development programs

Statistic 13

Data shows that youth sports involvement is linked to improved self-esteem and confidence, with nearly 70% of participants reporting positive self-image outcomes

Statistic 14

Less than 25% of youth sports programs have dedicated resources for mental health support, a growing concern among youth-athlete advocates

Statistic 15

Approximately 70% of parents state that sports participation helps their children develop important life skills

Statistic 16

About 80% of parents believe that sports participation positively impacts their child's character development and leadership skills

Statistic 17

Peer influence plays a significant role in youth sports participation, with children more likely to stay engaged if friends also participate

Statistic 18

Youth sports programs that include family engagement tend to have higher retention rates, with some programs seeing increases of up to 25%

Statistic 19

The dropout rate for youth sport participation is about 20% after the first year, often due to lack of enjoyment or burnout

Statistic 20

Only about 15% of children with disabilities participate in organized sports, indicating a significant participation gap

Statistic 21

The average cost of youth sports participation can range from $200 to over $600 per sport per season, which may be a barrier for lower-income families

Statistic 22

About 30% of children who drop out of sports cite a lack of fun or enjoyment as the primary reason

Statistic 23

Less than 30% of youth sports programs provide adequate access to inclusive sports options for children with disabilities, indicating room for expansion

Statistic 24

Approximately 20% of youth sports participants experience burnout, often due to high pressure and overtraining, leading to dropout

Statistic 25

Less than 20% of youth sports leagues are presented in languages other than English, limiting access for non-English speaking families

Statistic 26

About 50% of youth sports participants do not receive formal coaching or training, relying instead on peer or family guidance, which can impact safety and skill development

Statistic 27

Approximately 45 million children and teens participate in organized sports in the United States each year

Statistic 28

The National Federation of State High School Associations reported over 7.9 million high school students participated in boys' sports and 6.2 million in girls' sports during the 2021-2022 school year

Statistic 29

Youth sports participation declined by about 10% between 2008 and 2018 in the U.S.

Statistic 30

Boys participate in youth sports at a rate of about 30%, while girls participate at approximately 23% among U.S. youth aged 6-17

Statistic 31

Participation in youth sports is associated with better academic achievement, with athletes in some studies scoring higher on standardized tests

Statistic 32

The top three sports for participation among youth are basketball, soccer, and swimming, respectively

Statistic 33

Girls' participation in youth sports has increased by approximately 20% over the past decade, yet they still trail behind boys in overall athletic involvement

Statistic 34

Youth sports participation tends to be higher in urban areas compared to rural areas, with disparities greater among minority populations

Statistic 35

Approximately 60% of youth sports participants play multiple sports throughout their youth career, rather than specializing early, to reduce injury risk and improve skills

Statistic 36

Youth sports participation is linked to increased physical activity levels, with active youth averaging 1.5 hours of exercise daily, exceeding recommended guidelines

Statistic 37

Approximately 65% of youth sports coaches report that their teams emphasize skill development over winning, fostering a positive environment for youth development

Statistic 38

The average age for children starting organized sports is around 5 to 6 years old, with earlier participation linked to long-term engagement

Statistic 39

Youth sports programs in the U.S. are increasingly integrating mental health education and support into their curricula, aiming to promote overall well-being

Statistic 40

Participation in youth sports is associated with a 15% reduction in the likelihood of engaging in risky behaviors such as smoking or substance abuse, according to some studies

Statistic 41

The national participation rate for youth in competitive sports at school is approximately 55%, varying by region and socioeconomic status

Statistic 42

Approximately 35% of youth sports programs incorporate educational components about nutrition and healthy living, aimed at promoting lifelong wellness

Statistic 43

The dropout rate among youth who start sports before age 8 is approximately 40% by age 15, often due to burnout or loss of interest

Statistic 44

About 70% of children and teens who participate in sports say they benefit from increased physical fitness, according to surveys

Statistic 45

The average number of sports played per youth athlete is approximately 2.3, reflecting participation in multiple sports over childhood and adolescence

Statistic 46

Youth sports participation in the U.S. is increasingly gender-balanced, with females comprising around 44% of participants, compared to 41% a decade ago

Statistic 47

The participation rate for Latino youth in organized sports is approximately 55%, which is higher than the national average, highlighting significant engagement in minority groups

Statistic 48

The use of technology, such as sports apps and tracking devices, in youth sports has increased by over 40% in recent years, enhancing training and engagement

Statistic 49

Participation in youth sports has been associated with reduced rates of obesity in children and adolescents, with studies indicating a 12% lower obesity risk among active participants

Statistic 50

Only around 20% of youth sports leagues operate on a year-round basis, with most sports being seasonal, which impacts consistent skill development and fitness

Statistic 51

Girls' participation in competitive youth sports has increased at nearly twice the rate of boys' over the past five years, yet gender disparities still exist

Statistic 52

Participation in youth sports is associated with higher levels of social capital, including community engagement and teamwork skills, as noted in recent studies

Slide 1 of 52
Share:FacebookLinkedIn
Sources

Our Reports have been cited by:

Trust Badges - Publications that have cited our reports

Key Highlights

  • Approximately 45 million children and teens participate in organized sports in the United States each year
  • The National Federation of State High School Associations reported over 7.9 million high school students participated in boys' sports and 6.2 million in girls' sports during the 2021-2022 school year
  • Youth sports participation declined by about 10% between 2008 and 2018 in the U.S.
  • Approximately 70% of parents state that sports participation helps their children develop important life skills
  • Boys participate in youth sports at a rate of about 30%, while girls participate at approximately 23% among U.S. youth aged 6-17
  • The dropout rate for youth sport participation is about 20% after the first year, often due to lack of enjoyment or burnout
  • Over 60% of youth sports injuries are caused by overuse, often resulting from repetitive motion without proper rest
  • Only about 15% of children with disabilities participate in organized sports, indicating a significant participation gap
  • The average cost of youth sports participation can range from $200 to over $600 per sport per season, which may be a barrier for lower-income families
  • Nearly 75% of youth sports coaches are volunteers, highlighting community-based involvement
  • Participation in youth sports is associated with better academic achievement, with athletes in some studies scoring higher on standardized tests
  • The top three sports for participation among youth are basketball, soccer, and swimming, respectively
  • About 30% of children who drop out of sports cite a lack of fun or enjoyment as the primary reason

Despite the inspiring growth and countless benefits of youth sports, participation rates in the United States are declining, revealing ongoing challenges in access, safety, and enjoyment that impact millions of children and teens nationwide.

Injury and Safety Concerns

  • Over 60% of youth sports injuries are caused by overuse, often resulting from repetitive motion without proper rest
  • The most common injury among youth sports participants is sprains and strains, accounting for about 50% of injuries
  • Nearly 25% of youth sports injuries are caused by improper equipment, such as ill-fitting helmets or pads, highlighting the importance of safety gear
  • Nearly 80% of youth sports injuries are preventable through proper training, conditioning, and protective equipment, emphasizing injury prevention strategies
  • The majority of youth sports injuries occur during practices rather than competitions, accounting for nearly 60% of injury cases
  • The implementation of injury prevention programs in youth sports has reduced injury rates by up to 30%, according to research
  • Only about 10% of youth sports organizations have formal policies on concussion management, indicating a gap in safety protocols
  • Nearly 65% of youth sports injuries occur in children aged 10-14, making it a critical age group for injury prevention efforts
  • The number of youth sports organizations that offer injury prevention education has grown by approximately 15% in the past three years, signaling increased awareness

Injury and Safety Concerns Interpretation

Despite growing awareness and preventative programs, overuse injuries from repetitive motions and equipment issues continue to account for the majority of youth sports injuries—primarily affecting 10-14-year-olds—highlighting that a proactive approach combining proper training, safety gear, and comprehensive safety policies remains crucial to safeguarding young athletes.

Leadership, Organization, and Program Support

  • Nearly 75% of youth sports coaches are volunteers, highlighting community-based involvement
  • Among youth athletes, participation in team sports is associated with higher levels of social skills and teamwork abilities, according to research
  • Sponsorship and funding for youth sports organizations increased by approximately 12% in 2022, signaling rising investment in youth development programs
  • Data shows that youth sports involvement is linked to improved self-esteem and confidence, with nearly 70% of participants reporting positive self-image outcomes
  • Less than 25% of youth sports programs have dedicated resources for mental health support, a growing concern among youth-athlete advocates

Leadership, Organization, and Program Support Interpretation

While rising investments and the communal spirit of volunteer coaching bolster youth sports' positive impact on self-esteem and social skills, the glaring lack of mental health resources underscores an urgent need to prioritize holistic athlete well-being beyond the game.

Parental and Community Influence

  • Approximately 70% of parents state that sports participation helps their children develop important life skills
  • About 80% of parents believe that sports participation positively impacts their child's character development and leadership skills
  • Peer influence plays a significant role in youth sports participation, with children more likely to stay engaged if friends also participate
  • Youth sports programs that include family engagement tend to have higher retention rates, with some programs seeing increases of up to 25%

Parental and Community Influence Interpretation

While nearly three-quarters of parents laud sports as a vital classroom for life skills and character building, it’s the peer pressure and family involvement that really score the winning goals in keeping kids engaged and thriving on the field.

Participation Barriers and Costs

  • The dropout rate for youth sport participation is about 20% after the first year, often due to lack of enjoyment or burnout
  • Only about 15% of children with disabilities participate in organized sports, indicating a significant participation gap
  • The average cost of youth sports participation can range from $200 to over $600 per sport per season, which may be a barrier for lower-income families
  • About 30% of children who drop out of sports cite a lack of fun or enjoyment as the primary reason
  • Less than 30% of youth sports programs provide adequate access to inclusive sports options for children with disabilities, indicating room for expansion
  • Approximately 20% of youth sports participants experience burnout, often due to high pressure and overtraining, leading to dropout
  • Less than 20% of youth sports leagues are presented in languages other than English, limiting access for non-English speaking families
  • About 50% of youth sports participants do not receive formal coaching or training, relying instead on peer or family guidance, which can impact safety and skill development

Participation Barriers and Costs Interpretation

Despite the evident passion for youth sports, economic barriers, limited inclusivity, and burnout contribute to high dropout rates, highlighting the urgent need for accessible, enjoyable, and inclusive athletic opportunities for all children.

Participation Trends and Demographics

  • Approximately 45 million children and teens participate in organized sports in the United States each year
  • The National Federation of State High School Associations reported over 7.9 million high school students participated in boys' sports and 6.2 million in girls' sports during the 2021-2022 school year
  • Youth sports participation declined by about 10% between 2008 and 2018 in the U.S.
  • Boys participate in youth sports at a rate of about 30%, while girls participate at approximately 23% among U.S. youth aged 6-17
  • Participation in youth sports is associated with better academic achievement, with athletes in some studies scoring higher on standardized tests
  • The top three sports for participation among youth are basketball, soccer, and swimming, respectively
  • Girls' participation in youth sports has increased by approximately 20% over the past decade, yet they still trail behind boys in overall athletic involvement
  • Youth sports participation tends to be higher in urban areas compared to rural areas, with disparities greater among minority populations
  • Approximately 60% of youth sports participants play multiple sports throughout their youth career, rather than specializing early, to reduce injury risk and improve skills
  • Youth sports participation is linked to increased physical activity levels, with active youth averaging 1.5 hours of exercise daily, exceeding recommended guidelines
  • Approximately 65% of youth sports coaches report that their teams emphasize skill development over winning, fostering a positive environment for youth development
  • The average age for children starting organized sports is around 5 to 6 years old, with earlier participation linked to long-term engagement
  • Youth sports programs in the U.S. are increasingly integrating mental health education and support into their curricula, aiming to promote overall well-being
  • Participation in youth sports is associated with a 15% reduction in the likelihood of engaging in risky behaviors such as smoking or substance abuse, according to some studies
  • The national participation rate for youth in competitive sports at school is approximately 55%, varying by region and socioeconomic status
  • Approximately 35% of youth sports programs incorporate educational components about nutrition and healthy living, aimed at promoting lifelong wellness
  • The dropout rate among youth who start sports before age 8 is approximately 40% by age 15, often due to burnout or loss of interest
  • About 70% of children and teens who participate in sports say they benefit from increased physical fitness, according to surveys
  • The average number of sports played per youth athlete is approximately 2.3, reflecting participation in multiple sports over childhood and adolescence
  • Youth sports participation in the U.S. is increasingly gender-balanced, with females comprising around 44% of participants, compared to 41% a decade ago
  • The participation rate for Latino youth in organized sports is approximately 55%, which is higher than the national average, highlighting significant engagement in minority groups
  • The use of technology, such as sports apps and tracking devices, in youth sports has increased by over 40% in recent years, enhancing training and engagement
  • Participation in youth sports has been associated with reduced rates of obesity in children and adolescents, with studies indicating a 12% lower obesity risk among active participants
  • Only around 20% of youth sports leagues operate on a year-round basis, with most sports being seasonal, which impacts consistent skill development and fitness
  • Girls' participation in competitive youth sports has increased at nearly twice the rate of boys' over the past five years, yet gender disparities still exist
  • Participation in youth sports is associated with higher levels of social capital, including community engagement and teamwork skills, as noted in recent studies

Participation Trends and Demographics Interpretation

While nearly 45 million young Americans score goals, dribble, and swim their way to better health and brains, the declining participation rates and persistent gender gaps suggest that perhaps it’s time to invest less in equipment and more in keeping kids active and inspired beyond just the scoreboard.