
The U.S. nail salon industry reached $11.2 billion in revenue in 2023, with the average consumer spending $35 per visit. Customer demand is also shifting toward loyalty and convenience, since 72% of clients return annually and 68% book online. Those trends collide with operational reality, including a turnover rate averaging 25% and profit margins of 15% to 20%.
Key Takeaways
- 65% of U.S. women aged 18-34 visited a nail salon at least once in 2023.
- U.S. nail technicians number over 120,000 in 2023.
- 92% of nail products contain chemicals linked to health risks.
- The U.S. nail salon industry market size reached $11.2 billion in revenue in 2023.
- Average U.S. nail salon has 4.2 technicians per location.
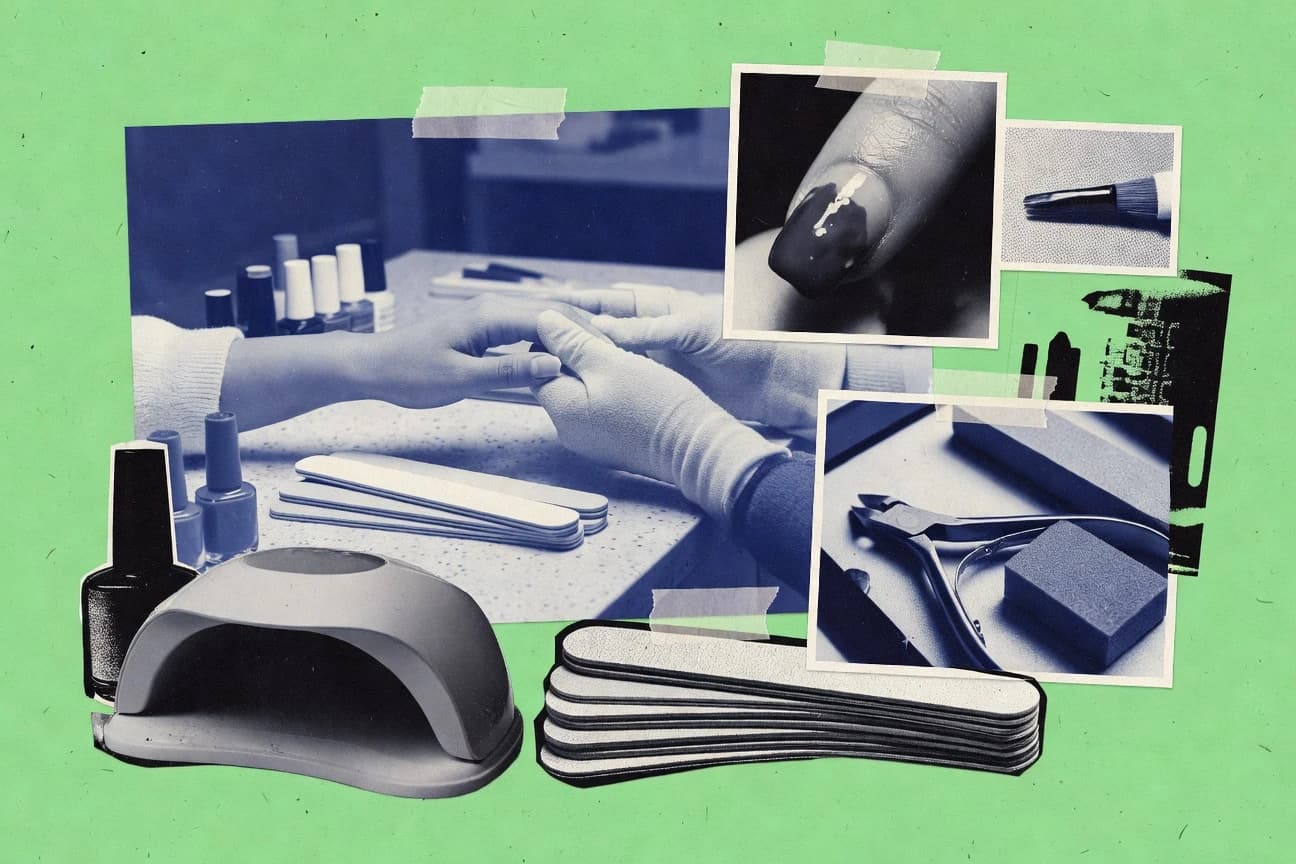
The nail salon industry is thriving, driven by rising demand for professional manicures and pedicures.
Related reading
01 · Category
Consumer Demographics and Trends20 stats
01
65% of U.S. women aged 18-34 visited a nail salon at least once in 2023.
02
Millennial women account for 42% of nail salon customers in the U.S.
03
28% of men in the U.S. reported getting manicures in 2023 surveys.
04
Average spend per nail salon visit in the U.S. is $35for consumers.
05
72% of nail salon clients are repeat customers annually.
06
Gen Z (18-24) increased nail salon visits by 18% in 2023.
07
Urban women visit nail salons 5.2 times per year on average.
08
55% of Hispanic women in U.S. prioritize nail services monthly.
09
Eco-friendly nail products preferred by 40% of consumers in 2023.
10
Online booking used by 68% of nail salon customers.
11
52% of Black women visit salons weekly for nails.
12
Average age of nail salon customer is 32 years.
13
38% increase in male pedicures since 2020.
14
$42average spend for full set of acrylics.
15
80% of customers influenced by Instagram visuals.
16
Suburban areas see 25% higher frequency visits.
17
Vegan nail polish demand up 30% among millennials.
18
62% of customers aged 25-44 book via apps.
19
Lower-income groups ($30k-$50k) 22% of clients.
20
Seasonal peaks: summer visits up 40%.
Interpretation
Consumer Demographics and Trends Interpretation
While women remain the dominant force, with urbanites, Gen Z, and loyal clientele driving the market, a quiet revolution is underway as men increasingly embrace pedicures and a growing eco-conscious, app-booking majority demands vegan polish and convenient online scheduling, proving the modern nail salon is far more than just a weekly splash of color.
02 · Category
Employment and Workforce20 stats
01
U.S. nail technicians number over 120,000 in 2023.
02
Average hourly wage for nail technicians in U.S. is $14.50in 2023.
03
85% of nail salon workers are women.
04
Nail salon industry employs 150,000 full-time workers in U.S.
05
Turnover rate in nail salons averages 25% annually.
06
40% of nail technicians are self-employed or booth renters.
07
Training hours required for licensure average 600 in most states.
08
15% annual growth in nail technician jobs projected to 2030.
09
Immigrant workers comprise 45% of nail salon workforce in U.S.
10
Average workweek for nail techs is 38 hours.
11
Projected 160,000 nail tech jobs by 2032.
12
California employs 25% of U.S. nail technicians.
13
Median salary for salon owners $55,000annually.
14
70% of techs work part-time.
15
Certification held by 95% of active technicians.
16
Booth rental model used by 35% of salons.
17
Unionized workers in salons <5%.
18
Online training courses completed by 20% yearly.
19
Injury rate 4.2 per 100 workers.
20
Florida has 12,000 licensed nail techs.
Interpretation
Employment and Workforce Interpretation
Behind the glossy finish of America's $11 billion nail industry lies a demanding reality: a predominantly female and immigrant workforce is painting a picture of resilience for modest pay, while navigating high turnover and physical strain to meet booming demand, all on the edge of a salon chair.
03 · Category
Health, Safety, and Regulations19 stats
01
92% of nail products contain chemicals linked to health risks.
02
20,000 nail salon workers suffer respiratory issues annually.
03
30% of salons cited for violations in health inspections.
04
Formaldehyde exposure in salons exceeds safe limits by 40%.
05
15% of technicians report skin allergies from products.
06
Ventilation systems compliant in only 55% of U.S. salons.
07
California mandates 350 hours training for safety protocols.
08
25% reduction in infections after glove mandates.
09
40% of salons lack proper waste disposal for chemicals.
10
MRSA infections from salons down 18% with regulations.
11
Toluene levels in 60% of salons above OSHA limit.
12
45 states require salon licensing.
13
Allergic reactions reported in 12% of clients yearly.
14
Dust extraction systems in 40% of salons.
15
Worker compensation claims up 10% for skin issues.
16
EU bans 22 harmful chemicals in nail products.
17
Hand washing compliance 75% in audits.
18
Cancer risk from acrylates 2x higher for techs.
19
70% salons trained in bloodborne pathogens.
Interpretation
Health, Safety, and Regulations Interpretation
These statistics paint a picture of an industry that seems to have one hand beautifully manicured while the other is holding a toxic, non-compliant cocktail of health violations.
More related reading
04 · Category
Market Size and Growth19 stats
01
The U.S. nail salon industry market size reached $11.2 billion in revenue in 2023.
02
Global nail salon market was valued at $12.5 billion in 2022 and is projected to grow at a CAGR of 8.2% from 2023 to 2030.
03
Number of nail salons in the U.S. increased to 55,000 in 2023.
04
Nail polish market, a key segment, generated $2.8 billion in the U.S. in 2023.
05
U.S. nail salon industry revenue grew by 4.5% year-over-year in 2023.
06
Asia-Pacific nail salon market holds 35% of global share in 2023.
07
Average annual revenue per U.S. nail salon was $204,000in 2023.
08
Nail salon industry in the UK reached £1.2 billion in 2023.
09
Projected U.S. nail salon market to hit $14.5 billion by 2028.
10
Post-COVID recovery saw 12% growth in nail salon revenues globally in 2022.
11
U.S. nail salon industry saw 5.2% CAGR from 2018-2023.
12
Europe nail salon market valued at €3.5 billion in 2023.
13
Franchise nail salons grew 10% in number in 2023.
14
Online nail care market segment $1.1 billion globally.
15
Vietnam exports $500 million in nail products yearly.
16
U.S. luxury nail salons revenue up 7% in 2023.
17
Small salons (<5 employees) make 60% of total outlets.
18
Canada nail salon market $1.4 billion CAD in 2023.
19
Organic nail services segment growing at 9.5% CAGR.
Interpretation
Market Size and Growth Interpretation
While global manicure moguls are cashing in on billions, the average American salon owner is scraping by on a modest $204,000, proving this high-gloss industry is polished on the surface but has its financial cracks filled in with sheer volume and a dash of franchised ambition.
05 · Category
Operational and Business Statistics20 stats
01
Average U.S. nail salon has 4.2 technicians per location.
02
60% of nail salons operate 7 days a week.
03
Profit margins in nail salons average 15-20%.
04
Gel manicures account for 45% of services provided.
05
Average salon rent costs $3,500monthly in urban areas.
06
75% of salons use POS systems for inventory.
07
Peak hours are Saturdays with 80% capacity utilization.
08
Product sales contribute 25% to salon revenue.
09
Social media marketing drives 35% of new clients.
10
50% of salons offer loyalty programs.
11
Average salon capacity 6 stations.
12
Electricity costs average $800monthly per salon.
13
Acrylic services 35% of revenue.
14
65% salons offer add-on services like waxing.
15
Inventory turnover 8 times per year.
16
Walk-ins 40% of appointments.
17
Marketing budget 5-10% of revenue.
18
Closing rate for leads 25%.
19
Mobile nail services up 15% post-pandemic.
20
PPE usage up to 90% in 2023.
Interpretation
Operational and Business Statistics Interpretation
The manicured world of nail salons runs on the delicate balance of meticulous gel artistry, relentless Saturday rushes, and the sharp calculus of surviving on 20% margins while urban rent looms like an unpaid bill.
Reference
Cite This Report
This report is designed to be cited. We maintain stable URLs and versioned verification dates. Copy the format appropriate for your publication below.
APA
Henrik Dahl. (2026, February 13). Nail Salon Industry Statistics. Gitnux. https://gitnux.org/nail-salon-industry-statistics
MLA
Henrik Dahl. "Nail Salon Industry Statistics." Gitnux, 13 Feb 2026, https://gitnux.org/nail-salon-industry-statistics.
Chicago
Henrik Dahl. 2026. "Nail Salon Industry Statistics." Gitnux. https://gitnux.org/nail-salon-industry-statistics.
Sources & references
61 datasets cited across this report · attribution is report-level