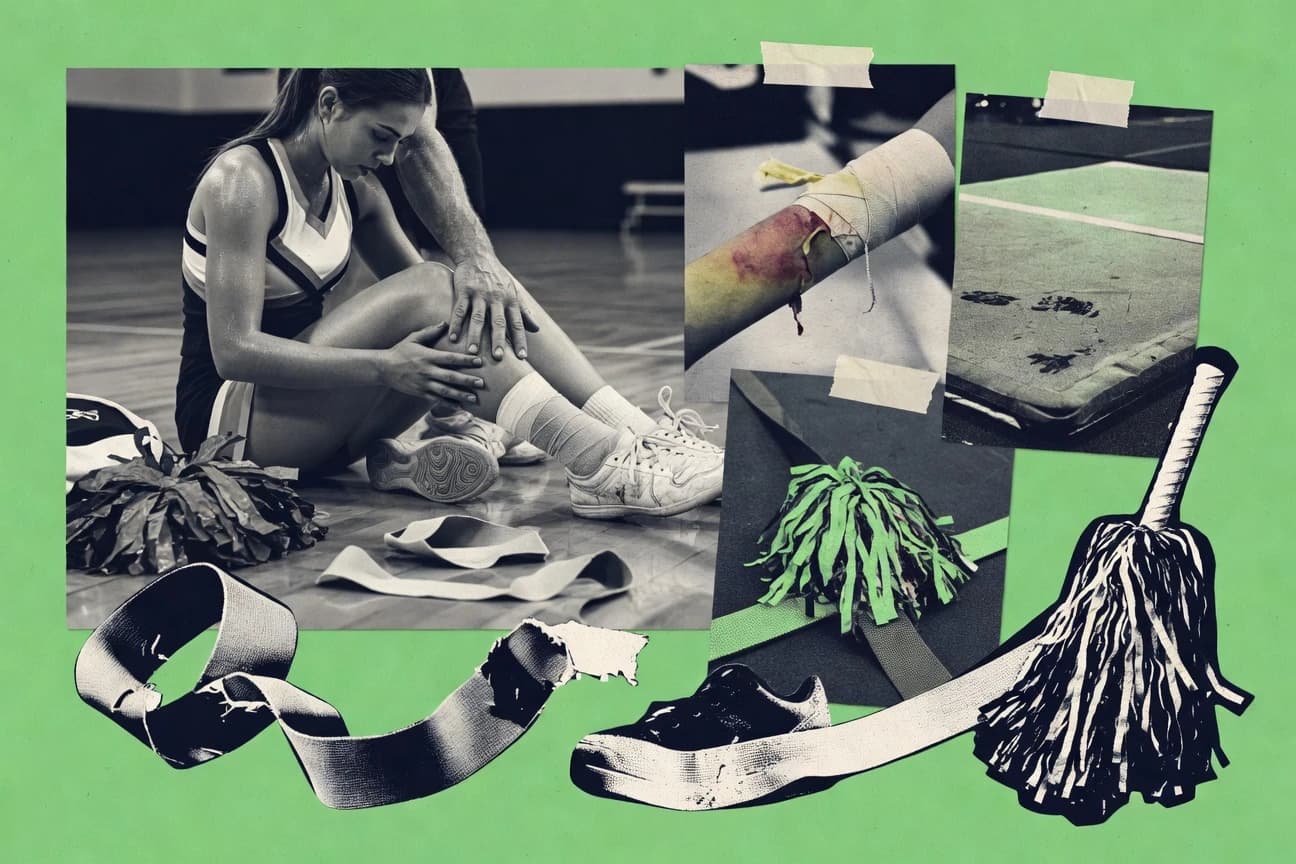

Females aged 14-18 make up 60% of cheer ED visits, even as practice remains the most injury-prone setting. In the US, the annual cheerleading injury rate is 0.99 per 1,000 participants, and 65% of injuries happen during practice. The figures also show youth cheer accounts for 25% of all injuries, with stunt groups driving a large share of severe outcomes.
Key Takeaways
- Females aged 14-18 account for 60% of cheer ED visits
- Cheerleading accounted for 37,902 emergency department visits in 2019 for ages 5-24
- 40% of cheer injuries are lower extremity
- 35% of injuries require >1 week recovery in teens
- Cheer injuries rose 28% from 2010-2018
Cheerleading injuries are common, but most are preventable with proper training, safe practices, and attention to warning signs.
Related reading
01 · Category
Demographics16 stats
01
Females aged 14-18 account for 60% of cheer ED visits
02
High school females have 2x injury rate vs males in cheer
03
Ages 12-17: 70% of cheerleading catastrophic injuries
04
College cheerleaders: 80% female, higher stunt injuries
05
Youth cheer (5-11): 25% of all injuries
06
All-girl squads: 85% of high school cheer injuries
07
Flyers experience 40% more injuries than bases
08
Novice cheerleaders: 3x higher injury rate than experienced
09
Black cheerleaders have higher fracture rates
10
Middle school cheer: 55% injuries in females only squads
11
Elite level cheer: injuries peak at age 16-18
12
Co-ed cheer: males have 30% more upper body injuries
13
Recreational cheer: lower rates in ages 8-12
14
90% of cheerleaders are female
15
Injuries higher in urban vs rural cheer programs
16
Seasoned athletes (3+ years): 20% lower injury risk
Interpretation
Demographics Interpretation
While young women dominate the spirit of cheerleading, these statistics starkly reveal that they are also overwhelmingly bearing its physical toll, making targeted safety reforms not just advisable but urgently necessary.
02 · Category
Incidence Rates20 stats
01
Cheerleading accounted for 37,902 emergency department visits in 2019 for ages 5-24
02
High school cheerleaders experience 1.5 injuries per 1,000 athletic exposures
03
College cheerleaders had an injury rate of 6.0 per 1,000 exposures in 2018
04
Youth cheerleaders aged 6-11 had 15,000 injuries requiring medical attention in 2020
05
Cheerleading injuries represent 6% of all sport-related ED visits for females
06
65% of cheerleading injuries occur during practice
07
Annual cheerleading injury rate is 0.99 per 1,000 participants in the US
08
28,000 cheerleaders treated in EDs annually from 2010-2014 average
09
Injury incidence in stunt cheerleading is 3.7 per 1,000 AEs
10
Middle school cheerleaders report 2.2 injuries per season
11
Cheer injuries increased 23% from 2013-2017
12
1 in 5 cheerleaders sustains a time-loss injury per season
13
Practice injury rate: 4.1 per 1,000 AEs in high school
14
Competition injury rate: 1.4 per 1,000 AEs
15
All-girl cheer squads have higher injury rates than co-ed
16
12,000 catastrophic injuries in cheerleading over 30 years
17
Cheerleading causes 20% of female high school sport injuries
18
56 injuries per 10,000 athletes in youth cheer
19
ED visits for cheerleading: 2.3 per 10,000 population
20
Injury rate in elite cheer: 9.1 per 1,000 practice hours
Interpretation
Incidence Rates Interpretation
The soaring pyramids and gravity-defying stunts of cheerleading come with a sobering reality, as these statistics reveal a hidden lattice of risk where practice sessions are the most dangerous stage and the pursuit of perfection exacts a measurable physical toll.
03 · Category
Injury Types20 stats
01
40% of cheer injuries are lower extremity
02
Ankle sprains account for 23% of all cheerleading injuries
03
Concussions make up 12% of cheerleading ED visits
04
Knee injuries represent 15% of cheerleader injuries
05
Fractures occur in 10% of cheerleading injuries
06
Head and neck injuries: 17% of total
07
Shoulder dislocations: 8% in stunt positions
08
Low back strains: 11% of practice injuries
09
Wrist fractures: 5% of cheer injuries
10
ACL tears: 4% but high severity
11
Spinal injuries: 2% of all cheerleading injuries
12
Finger injuries: 7% in bases and spotters
13
Heat-related illnesses: 3% of cheer ED visits
14
Elbow injuries: 6% from tumbling
15
Hip strains: 9% in flyers
16
Facial lacerations: 4% from collisions
17
Dental injuries: 2% in cheerleading
18
Cervical strains: 13% of neck injuries
19
Hamstring pulls: 12% of lower leg injuries
20
Patellar dislocations: 3% in cheerleaders
Interpretation
Injury Types Interpretation
It turns out that cheerleading is essentially a contact sport fought against gravity, where the most common battle scars are ankle sprains and the most alarming are concussions.
More related reading
04 · Category
Severity19 stats
01
35% of injuries require >1 week recovery in teens
02
15% of cheer injuries lead to hospitalization
03
Catastrophic spinal injuries: 67 cases 1982-2011 average 2.2/year
04
Concussions: 30% result in >7 days absence
05
Fractures require surgery in 20% of cases
06
ACL injuries sideline for 6-9 months in 80%
07
5% of cheer injuries are permanent disabilities
08
Hospital charges for cheer injuries: $100M annually
09
25% of head injuries lead to CT scans
10
Ankle sprains: 10% chronic instability post-injury
11
Shoulder injuries: 40% require rehab >4 weeks
12
12% of cheerleaders report long-term pain
13
ED admission rate: 8% for cheer fractures
14
Neck injuries: 18% with neurological symptoms
15
Knee surgeries: 15% of severe cheer injuries
16
22% recurrence rate for sprains
17
Back injuries: 30% lead to missed season
18
Concussion recovery: average 14 days in cheer
19
7% of injuries require ambulance transport
Interpretation
Severity Interpretation
Behind the glitter and chants, cheerleading harbors a brutal truth: it’s a statistically significant sport where a shocking portion of the stunts come with a real risk of trips to the operating room, seasons on the sidelines, and even lifelong consequences.
05 · Category
Trends17 stats
01
Cheer injuries rose 28% from 2010-2018
02
Stunting injuries increased 40% post-2010 rule changes
03
Concussion rates doubled in cheer from 2007-2014
04
Youth cheer injuries up 12% yearly since 2015
05
Practice injuries declined 10% with safety rules 2015-2020
06
Catastrophic injuries dropped 50% after 2006 AAC guidelines
07
ED visits peaked in 2012 at 40,000 then stabilized
08
High school cheer injuries steady at 15k/year 2015-2019
09
Elite cheer injury rates fell 15% with mat mandates
10
Female-only squads saw 20% injury rise 2010-2020
11
Tumbling injuries up 25% with skill progression
12
Prevention programs reduced strains by 18%
13
COVID-19 pause led to 30% drop in 2020 injuries
14
Ankle injury rates unchanged despite braces
15
Head injury reporting increased 300% post-concussion protocols
16
Co-ed cheer injuries declined 22% 2015-2020
17
Overall cheer ED visits down 5% since 2018 safety push
Interpretation
Trends Interpretation
The evolving story of cheerleading safety is one of remarkable progress in preventing catastrophic harm, yet stubbornly persistent spikes in common injuries reveal that the sport's soaring athleticism continues to outpace its safeguards.
Reference
Cite This Report
This report is designed to be cited. We maintain stable URLs and versioned verification dates. Copy the format appropriate for your publication below.
APA
Nathan Caldwell. (2026, February 13). Cheerleading Injuries Statistics. Gitnux. https://gitnux.org/cheerleading-injuries-statistics
MLA
Nathan Caldwell. "Cheerleading Injuries Statistics." Gitnux, 13 Feb 2026, https://gitnux.org/cheerleading-injuries-statistics.
Chicago
Nathan Caldwell. 2026. "Cheerleading Injuries Statistics." Gitnux. https://gitnux.org/cheerleading-injuries-statistics.
Sources & references
15 datasets cited across this report · attribution is report-level