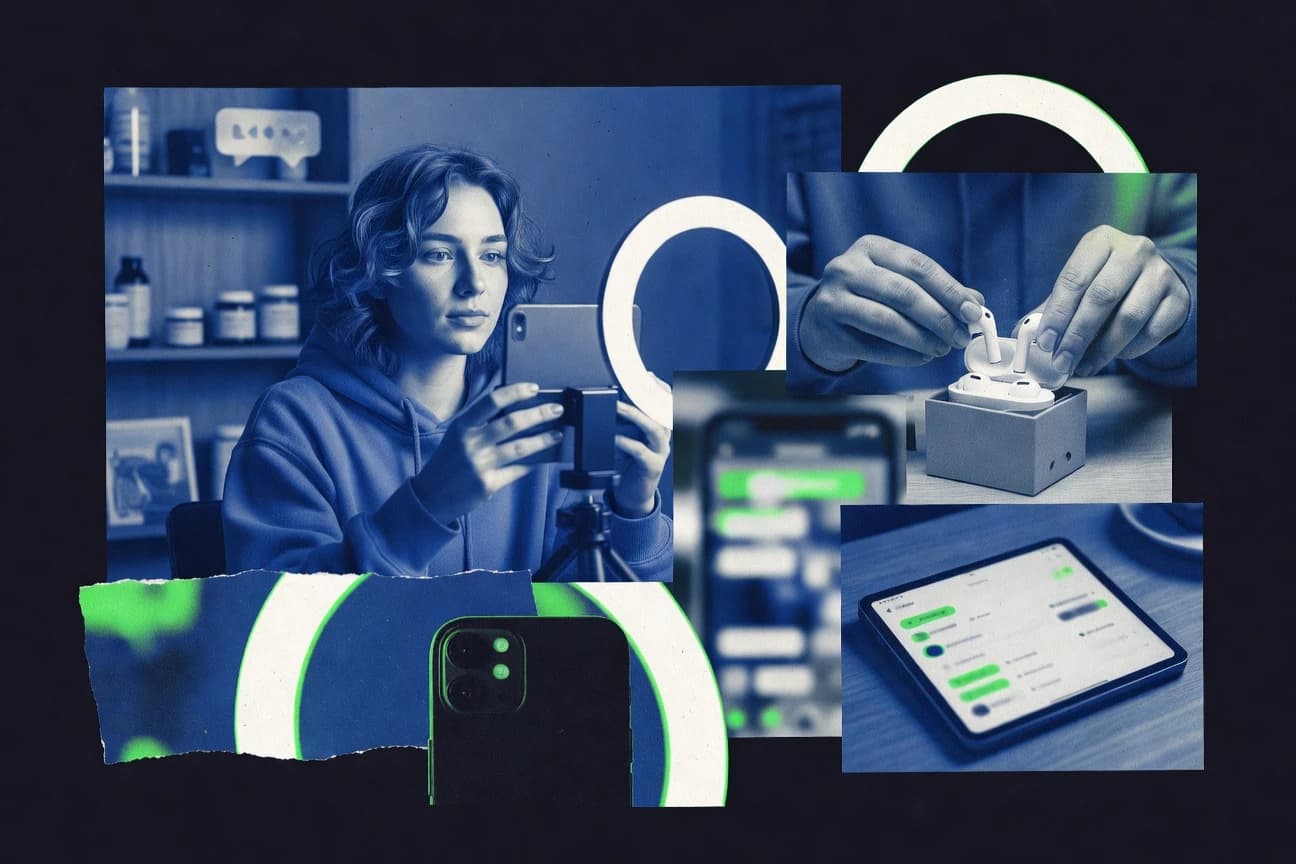

Influencer marketing is reshaping discovery and trust across social platforms, with results that vary by audience and channel. For example, 57% of Instagram users explore brands via influencers, while TikTok influencers average a 17.96% engagement rate. Marketers also lean into measurable performance—global spending hit $21.1B in 2023, and ROI is a standout reason many teams expand campaigns. Explore how platforms, formats, and regions shape the numbers.
Key Takeaways
- 61% of consumers trust influencer recommendations over brand ads.
- 40% of consumers have purchased products after seeing influencer posts.
- 70% of teens trust influencers more than celebrities.
- 31.6% of marketers use Instagram for influencer campaigns, highest platform share.
- TikTok influencers average 17.96% engagement rate, highest among platforms.
- YouTube holds 14.4% of influencer marketing activity in 2023.
- The global influencer marketing market size reached $21.1 billion in 2023, marking a 22.4% increase from the previous year.
- Influencer marketing spending in the United States is projected to hit $8.4 billion by 2025.
- The number of influencer marketing campaigns worldwide grew by 53.9% from 2021 to 2022.
- Influencer marketing delivers an average ROI of $5.78 for every dollar spent.
- 89% of marketers say influencer marketing ROI exceeds other channels.
- Campaigns with micro-influencers yield 22% higher ROI than macro.
- 51% of brands plan AI-influencer use by 2025.
- Long-term ambassador programs up 34% in adoption since 2022.
- 68% of marketers prioritize micro-influencers in 2024 strategies.
Influencer marketing is surging, delivering strong trust and ROI as brands invest more in micro and shoppable campaigns.
Related reading
01 · Category
Consumer Engagement And Trust27 stats
01
61% of consumers trust influencer recommendations over brand ads.
02
40% of consumers have purchased products after seeing influencer posts.
03
70% of teens trust influencers more than celebrities.
04
57% of Instagram users explore brands via influencers.
05
Authenticity is valued by 86% of consumers in influencer content.
06
69% of consumers influenced by user-generated content from influencers.
07
Gen Z 2.5x more likely to engage with influencer content daily.
08
82% of consumers more likely to purchase with trusted influencer endorsement.
09
Fake followers reduce trust by 45% among discerning consumers.
10
75% of users ignore sponsored posts without clear disclosure.
11
Video testimonials from influencers boost trust by 34%.
12
63% of consumers prefer influencers over athletes for product recs.
13
Engagement drops 50% if influencer doesn't align with brand values.
14
54% of followers research brands after influencer mentions.
15
Micro-influencers foster 60% higher trust levels than mega.
16
71% of consumers ignore influencers with inconsistent content.
17
Personalized influencer recs increase purchase intent by 29%.
18
66% of women trust beauty influencers more than brand claims.
19
Live streams with influencers see 3x engagement rates.
20
59% of consumers share influencer content with friends.
21
Trust in influencers rose 12% post-2022 authenticity campaigns.
22
77% of Gen Z discovers products via social influencers.
23
Negative influencer scandals reduce brand trust by 23%.
24
Transparent pricing in influencer posts builds 41% more trust.
25
65% of consumers engage more with niche influencers.
26
52% of users block influencers perceived as overly salesy.
27
Nano-influencers command 8.4% average engagement rate from followers.
Interpretation
Consumer Engagement And Trust Interpretation
With 61% of consumers trusting influencer recommendations more than brand ads and 86% valuing authenticity, consumer engagement and trust are clearly driven by credible, real influencer content.
02 · Category
Demographics And Platforms27 stats
01
31.6% of marketers use Instagram for influencer campaigns, highest platform share.
02
TikTok influencers average 17.96% engagement rate, highest among platforms.
03
YouTube holds 14.4% of influencer marketing activity in 2023.
04
78% of influencers are aged 18-34 years old.
05
Female influencers dominate with 77.7% share across platforms.
06
Gen Z makes up 40% of influencer audience demographics.
07
Facebook sees 10.3% average engagement for influencers.
08
45% of influencers specialize in fashion niche.
09
Millennials represent 36% of active influencer followers.
10
LinkedIn influencer marketing used by 11% of B2B brands.
11
Pinterest influencers average 12% engagement in lifestyle niche.
12
25% of influencers are parents, targeting family demographics.
13
Snapchat influencers engage 9.8% of urban millennials.
14
62% of beauty influencers are women aged 18-24.
15
Twitter (X) used in 8% of campaigns, focusing professionals 25-44.
16
Gaming influencers 70% male, audience skewed to 18-24 males.
17
35% of influencers based in USA, 20% in India.
18
Fitness influencers average 4.2% engagement, popular with 25-34 females.
19
Travel influencers 55% female, audience 56% millennials.
20
Tech influencers 65% male, targeting 18-35 professionals.
21
28% of luxury influencers in Europe, audience high-income 30+.
22
Food influencers 60% female, engaging families 25-44.
23
15% of campaigns on emerging platforms like BeReal.
24
Health influencers 52% female millennials, 48% Gen Z.
25
Automotive influencers target 55% male 25-54 demographics.
26
42% of e-commerce influencers focus on fashion for young women.
27
Podcast influencers growing 22%, audience 30-49 professionals.
Interpretation
Demographics And Platforms Interpretation
With 31.6% of marketers prioritizing Instagram and TikTok leading engagement at 17.96% alongside a young, female-dominated audience where 78% of influencers are 18 to 34 and women make up 77.7%, influencer campaigns are clearly being driven by Gen Z heavy demographics across these top platforms.
03 · Category
Market Size And Growth30 stats
01
The global influencer marketing market size reached $21.1 billion in 2023, marking a 22.4% increase from the previous year.
02
Influencer marketing spending in the United States is projected to hit $8.4 billion by 2025.
03
The number of influencer marketing campaigns worldwide grew by 53.9% from 2021 to 2022.
04
Asia-Pacific region accounts for 46% of global influencer marketing spend in 2023.
05
Brand spending on nano-influencers is expected to rise by 25% annually through 2027.
06
European influencer marketing market valued at $4.2 billion in 2023 with 18% YoY growth.
07
TikTok influencer marketing budgets increased by 547% from 2020 to 2023.
08
Global influencer marketing platform market projected to reach $32.5 billion by 2030 at 28.5% CAGR.
09
In 2023, 72% of brands increased their influencer marketing budgets.
10
Latin America influencer market expected to grow at 27% CAGR to $2.5 billion by 2028.
11
Middle East influencer marketing spend hit $1.8 billion in 2023, up 35% YoY.
12
Instagram remains the top platform with 62% of influencer campaigns in 2023.
13
Influencer marketing industry expected to surpass $24 billion globally by 2024.
14
B2B influencer marketing spend grew 40% in 2023 to $2.1 billion.
15
Fashion industry allocates 15% of marketing budget to influencers, totaling $3.2 billion in 2023.
16
Gaming influencer market valued at $9.8 billion in 2023, projected 32% growth by 2027.
17
Beauty sector influencer spend reached $4.5 billion globally in 2023.
18
Travel influencer marketing budgets up 28% to $1.9 billion in 2023 post-pandemic.
19
Food and beverage brands spent $2.3 billion on influencers in 2023.
20
Health and wellness influencer market at $1.7 billion in 2023 with 24% YoY growth.
21
Luxury goods influencer marketing valued at $1.4 billion in 2023.
22
Tech influencer campaigns spend hit $2.8 billion globally in 2023.
23
Automotive brands allocated $900 million to influencers in 2023.
24
E-commerce influencer marketing grew to $6.5 billion in 2023.
25
Fitness influencer market size $1.2 billion in 2023, 30% CAGR projected.
26
Influencer marketing in APAC to reach $10 billion by 2025.
27
North America holds 35% of global influencer market share in 2023.
28
UK influencer market valued at $1.1 billion in 2023.
29
India influencer marketing spend $250 million in 2023, up 45%.
30
China influencer market dominates with $7.5 billion in 2023.
Interpretation
Market Size And Growth Interpretation
The market is expanding fast, with the global influencer marketing industry reaching $21.1 billion in 2023 and growing 22.4% year over year, showing how strong momentum in market size and growth is being fueled especially by Asia-Pacific’s 46% share and sustained double digit expansion in key regions like Europe’s 18% YoY growth.
More related reading
04 · Category
Roi And Effectiveness26 stats
01
Influencer marketing delivers an average ROI of $5.78for every dollar spent.
02
89% of marketers say influencer marketing ROI exceeds other channels.
03
Campaigns with micro-influencers yield 22% higher ROI than macro.
04
75% of brands report positive ROI from influencer partnerships.
05
Average engagement rate for influencer posts is 3.5%, vs 1.5% for brand posts.
06
Influencer content generates 11x higher ROI than digital display ads.
07
67% of brands measure success via engagement metrics in influencer campaigns.
08
Nano-influencers provide 2.5x better ROI per engagement than mega-influencers.
09
Video influencer content sees 49% higher ROI than static images.
10
81% of brands find influencer marketing more effective for awareness than traditional ads.
11
Average cost per acquisition via influencers is $4.50, 30% lower than PPC.
12
Authenticity-driven campaigns achieve 28% higher ROI.
13
Long-term influencer partnerships yield 3x ROI over one-offs.
14
Influencer marketing boosts sales lift by average 14% per campaign.
15
Email sign-ups from influencers 5x higher than other social tactics.
16
B2C brands see 6.7x ROI from influencers vs 3.2x for B2B.
17
UGC from influencers increases conversion rates by 22%.
18
TikTok influencers deliver 2x ROI compared to Instagram for Gen Z.
19
94% of in-house teams report improved ROI with dedicated influencer tools.
20
Campaigns with diverse influencers show 19% higher ROI.
21
Influencer marketing shortens purchase cycle by 25% on average.
22
Sponsored posts with storytelling yield 31% better ROI.
23
Cross-platform influencer campaigns boost ROI by 40%.
24
73% of marketers say influencers outperform organic content in ROI.
25
Average lifetime value from influencer-acquired customers is 2.1x higher.
26
49% of consumers trust influencer recommendations, leading to higher ROI.
Interpretation
Roi And Effectiveness Interpretation
For the ROI and effectiveness angle, influencer marketing stands out by delivering an average $5.78 ROI per $1 spent and generating 11x higher ROI than digital display ads, with 89% of marketers reporting it outperforms other channels.
05 · Category
Trends And Strategies22 stats
01
51% of brands plan AI-influencer use by 2025.
02
Long-term ambassador programs up 34% in adoption since 2022.
03
68% of marketers prioritize micro-influencers in 2024 strategies.
04
Shoppable posts in influencer content rose 150% in 2023.
05
55% of campaigns now include performance-based payments.
06
UGC integration in 79% of influencer strategies for 2024.
07
TikTok live shopping via influencers up 300% YoY.
08
62% of brands shift to employee influencers in 2024.
09
AI analytics tools used by 47% for influencer selection.
10
Sustainability-focused influencers in 41% of brand strategies.
11
Virtual influencers like Lil Miquela in 12% of luxury campaigns.
12
Cross-border influencer collabs up 28% with globalization.
13
70% of strategies emphasize community building over sales.
14
Podcast sponsorships by influencers grow 45% in audio trend.
15
36% of brands test metaverse influencer activations.
16
Diversity and inclusion metrics in 58% of vetting processes.
17
Headless CMS for scalable influencer content in 25% agencies.
18
64% prioritize video shorts like Reels in strategies.
19
Gamification in influencer challenges up 52% engagement.
20
Zero-party data from influencers key in 39% privacy-focused strategies.
21
53% of B2B brands adopt influencer marketing in 2024.
22
AR filters co-created with influencers in 22% beauty campaigns.
Interpretation
Trends And Strategies Interpretation
In Trends And Strategies, brands are quickly shifting to measurable, commerce-ready influencer approaches, with 51% planning AI-influencer use by 2025 and 79% integrating UGC into 2024 campaigns.
Reference
Cite This Report
This report is designed to be cited. We maintain stable URLs and versioned verification dates. Copy the format appropriate for your publication below.
APA
Marcus Engström. (2026, February 13). Influencer Marketing Statistics. Gitnux. https://gitnux.org/influencer-marketing-statistics
MLA
Marcus Engström. "Influencer Marketing Statistics." Gitnux, 13 Feb 2026, https://gitnux.org/influencer-marketing-statistics.
Chicago
Marcus Engström. 2026. "Influencer Marketing Statistics." Gitnux. https://gitnux.org/influencer-marketing-statistics.
Sources & references
12 datasets cited across this report · attribution is report-level